HAL Id: hal-02475755
https://hal.archives-ouvertes.fr/hal-02475755
Submitted on 12 Feb 2020HAL is a multi-disciplinary open access archive for the deposit and dissemination of sci-entific research documents, whether they are pub-lished or not. The documents may come from teaching and research institutions in France or abroad, or from public or private research centers.
L’archive ouverte pluridisciplinaire HAL, est destinée au dépôt et à la diffusion de documents scientifiques de niveau recherche, publiés ou non, émanant des établissements d’enseignement et de recherche français ou étrangers, des laboratoires publics ou privés.
Corrosion Behavior of α,β’-Brass in NaNO3 Solutions
Clément Berne, Eric Andrieu, Jean Reby, Jean-Michel Sobrino, Christine
Blanc
To cite this version:
Clément Berne, Eric Andrieu, Jean Reby, Jean-Michel Sobrino, Christine Blanc. Corrosion Behavior of α,β’-Brass in NaNO3 Solutions. ECS Transactions, Electrochemical Society, Inc., 2015, 64 (26), pp.111-120. �10.1149/06426.0111ecst�. �hal-02475755�
OATAO is an open access repository that collects the work of Toulouse researchers and makes it freely available over the web where possible
Any correspondence concerning this service should be sent
to the repository administrator: tech-oatao@listes-diff.inp-toulouse.fr
This is an author’s version published in: http://oatao.univ-toulouse.fr/24448
To cite this version:
Berne, Clément and Andrieu, Eric and Reby, Jean and Sobrino, Jean-Michel and Blanc, Christine Corrosion Behavior of α,β'-Brass in NaNO3
Solutions. (2015) ECS Transactions, 64 (26). 111-120. ISSN 1938-6737 Official URL: https://doi.org/10.1149/06426.0111ecst
Corrosion behavior of α,β’-Brass in NaNO3 Solutions
C. Bernea, b, c, E. Andrieub, J. Rebyc, J-M. Sobrinod, and C. Blancb a
PhD candidate, joint laboratory CETIMAT, CETIM – CIRIMAT b
Université de Toulouse, CIRIMAT, UPS / INPT / CNRS, Equipe MEMO ENSIACET, 4, allée Emile Monso BP 44362, 31030 Toulouse Cedex 4, France
c
CETIM, Pôle Matériaux Métalliques et Surface 74, route de la Jonelière CS 82617, 44326 Nantes Cedex 3, France
d
CETIM, Pôle Matériaux Métalliques et Surface 52, Avenue Félix Louat CS 80067, 60304 Senlis Cedex, France
The corrosion behavior of an α,β’-brass CuZn40Pb2 (CW617N) was studied in solutions with basic pHs and various nitrate ion concentrations. Corrosion at the open circuit potential was observed to proceed by the galvanic coupling of α and β’ phases, leading to a surface dezincification of the β’ phase and the evolution of the passive layer. When the alloy was polarized in the anodic domain, a pseudo-passive or a passive stage followed by a passive breakdown was observed.
Introduction
In various corrosive environments, α,β’-brasses, used in components in gas distribution networks, are believed to be susceptible to simultaneous dissolution (Cu, Zn) and/or selective dissolution (Zn, dezincification) processes. These phenomena are expected to play a major role during the first stages (incubation and initiation) of stress corrosion cracking (SCC) damage, leading to rupture, that can be observed on network components in service. In this framework, it is of interest to develop a good knowledge of α,β’-brasses corrosion mechanisms. However, abundant literature can be found for α-brass (in nitrite solutions, for example: (1) (2) (3) (4) (5) (6) (7) (8) (9) (10)) but not for α,β’-brasses (11) (12) (13) (14).
Therefore, the present study aimed to contribute to a better understanding of the corrosion processes of α,β’-brass. The target of this study was to test the influence of the environment (pH, composition) on the corrosion behavior using electrochemical techniques. The specimens investigated in the present work were composed of α,β’-brass CuZn40Pb2 (CW617N) removed from stamping rods that were used to manufacture gas transfer valves. This specific alloy, CW617N, used principally for its good machinability and resistance to corrosion, is principally studied for the development of water taps (15) (16) (17) (18). In the present work, corrosion tests were performed in NaNO3 solution, selected on the basis of a literature review on α-brass (19), although in literature the solutions that are most often used are ammonia (14) (20) (21), sulfuric acid (22) (23) (24), and nitrite solutions (9). Results obtained over a wide range of conditions (pH, nitrate ion concentrations) were analyzed by comparing open circuit potential (OCP) measurements, anodic polarization curves, and surface characterizations (Optical Microscope, Scanning Electron Microscope and X-Ray photoelectron spectrometry).
Experimental Material
The samples of α,β’-brass CuZn40Pb2 were removed from casting rods. Their chemical composition (Zn 38.35, Al 0.008, Ni 0.051, Fe 0.205, Mn 0.004, Sn 0.150, Pb 1.875, Si 0.001, Cu 59.35, wt. %) was similar to that from the standard composition CW617N. Their metallurgical state was that of the heart of a 65mm diameter stamping rod (Figure 1). The α phase (64 at% Cu, 36 at% Zn) was included in an enveloping β’ phase (55at% Cu, 45at% Zn). A transverse section of the rod was characterized by equiaxed grains (α and β’ phase) with an average size of 24 µm in diameter for the α phase and 20µm for the β’ phase. In the longitudinal sections of the rod, a texturation of the β’ grains was observed: their size varied from 20µm to 120µm compared to 20µm in the transverse direction. Moreover, the α grains distribution in the longitudinal section was heterogeneous: α grains had preferentially germinated at the β’ grain boundaries, leading to a specific chaining of β’ and α phases.
Figure 1. Optical microscope observations of the α,β’-brass CuZn40Pb2 (CW617N) Corrosion tests
Corrosion tests were performed in NaNO3 solutions (0.05M, 0.1 M, 0.5 M, 1 M - AnalaR NORMAPUR® ACS, ISO, Reag. Ph. Eur. analytical reagent).The pH of the different solutions was adjusted (11, 12, 13) by the addition of NaOH (AnalaR NORMAPUR® ACS, ISO, Reag. Ph. Eur. analytical reagent).
Open Circuit Potential (OCP) measurements, anodic potentiokinetic polarization experiments and corrosion tests at constant potential were performed with a standard device composed of a potentiostat connected to a reference electrode (Saturated Calomel Electrode), a counter electrode (platinum) and a working electrode composed of an α,β’-brass sample. The surface exposed to the electrolyte corresponded to the plane perpendicular to the extrusion direction. For the OCP measurements and the polarization tests, the surface area was equal to approximatively 4 cm². The sample surface was polished with 4000 grit SiC paper before the experiments. Tests were performed in a beaker with 300 mL of the solution that was open to the air and moderately stirred with a magnetic stirrer. During the tests, the beakers were placed in a thermostatically controlled water-bath maintained at 23.5±2 °C. OCP values were measured for 15 minutes upon immersion of the working electrode, and then the anodic polarization curves were plotted from the last OCP value to a potential sufficient to observe the passivity breakdown at a scan rate of 0.070 mV/s.
Complementary tests
Surface observations and analyses after the corrosion tests were performed through optical microscopy (OM) (Olympus 2000) and X-ray photoelectron spectroscopy (XPS K alpha ThermoScientific, and monochromatic excitation source A1Kα 1486.6eV). Semi-quantification and XPS peak deconvolutions were made after selections of the peak Binding Energy (BE) or the Kinetic Energy in common database.
Results Corrosion behavior of α,β’-brass CuZn40Pb2 at OCP
The corrosion behavior of α,β’-brass CuZn40Pb2 during immersion in different NaNO3 solutions is presented as OCP vs. time curves. These curves were plotted during 15 minutes upon immersion of the samples in the electrolyte for various chemical conditions (different pH values and nitrate ion concentrations) (Figure 2).
Whatever the pH and the nitrate ion concentration (Figure 2 a and b), the OCP first increased rapidly (except for pH 13, Figure 2 a) and then tended to stabilize, which could be associated to passivation/pseudo passivation of the exposed surface. The results showed that the pH (Figure 2 a) significantly influenced the OCP measurements. The evolution rates of the OCP from one curve to another were quite different: when the pH increased, the OCP evolution slowed down during the first 400s, which was markedly visible for pH 13. Furthermore, the OCP value was stabilized at -0.24 V/SCE for a pH of 13 whereas for a pH equal to 12 and 11, the OCP reached a value of approximately -0.17 V/SCE after 15 minutes in solution but that was not totally stabilized, as confirmed by longer measurements. The results were probably correlated to a surface evolution that was strongly dependent on pH. Figure 2 b shows the influence of the nitrate ion concentration on OCP values for a pH 11 solution. The effect of the nitrate ion concentration was less significant than that of the pH. Globally, all curves presented the same shape with a rapid increase of the OCP in the first part of the immersion. The OCP value reached after 15 minutes in solution increased with the nitrate ion concentration; however longer tests showed that the OCP values were slightly dependent on the nitrate ion concentration.
Figure 2. OCP vs. time of the α,β’ brass CuZn40Pb2 (a) at various pH, in a 0.5 M NaNO3 solution (b) at various NaNO3 concentrations, pH 11.
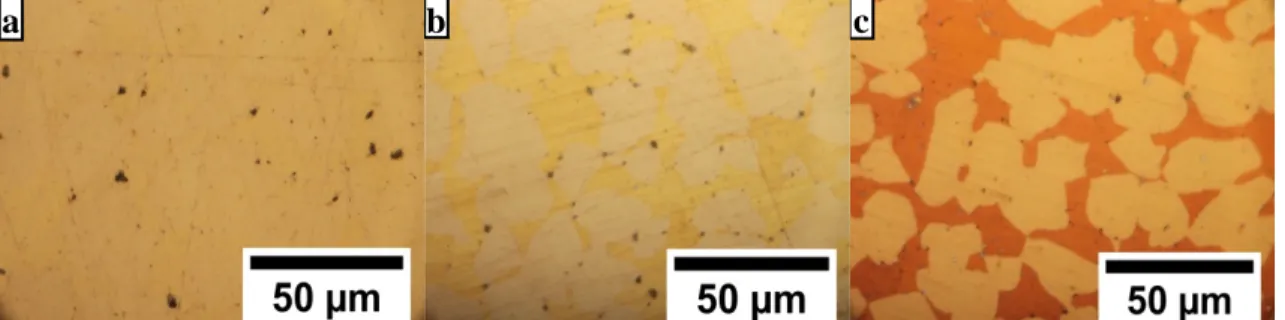
Figure 3. Optical microscope observations of the α,β’ brass CuZn40Pb2 sample surface (a) before immersion (b) after 15 minutes at OCP in a 0.5 M NaNO3 solution at pH 11 (c) after 15 minutes at OCP in a 0.5 M NaNO3 solution at pH 12.
The preliminary results presented in Figure 2, characterizing surface evolution through potential evolution, were completed further by OM observations (Figure 3) and XPS analyses (Figure 4 and Figure 5). Because the pH was found to be the major parameter on OCP values, attention was paid to surface evolution depending on the pH of the electrolyte in a 0.5M NaNO3 solution. Comparison of OM observations before immersion (Figure 3 a) and after 15 minutes at OCP in a 0.5 M NaNO3 solution at pH 11 (Figure 3 b) showed an orange discoloring of the β’ phase after immersion. This discoloring became more pronounced after 15 minutes at OCP in a 0.5 M NaNO3 solution at pH 12 (Figure 3 c).
Figure 4. General XPS spectra and identification of the characteristic peaks on α,β’ brass CuZn40Pb2. Spectra are plotted for a non-corroded sample and for a sample after a 15 minute immersion at OCP in a pH 11 solution (0.5M NaNO3).
These evolutions were assumed to be mainly due to the formation of a passive/pseudo-passive layer and its evolution as well as a dezincification process of the sample surface, in particular of the β’ phase. Figure 4 shows general XPS spectra obtained for a non-corroded sample and for a sample after a 15 minutes immersion at OCP in a pH 11 solution. For the non-corroded sample, Zn and Cu characteristic peaks were detected, as well as O and C peaks. Attention was paid to Cu 2p3/2 and Zn 2p3/2 peaks.
c b
Figure 5. XPS analyses of α,β’-brass CuZn40Pb2. Focus on (a) and (b) Cu2p3/2 peaks, (c) and (d) Zn2p3/2 peaks, and (e) and (f) Cu LMN peaks. Figures (a), (c) and (e) correspond to a pH 11 solution. Figures (b), (d) and (f) correspond to a pH 12 solution. All solutions contained 0.5M NaNO3. On each figure, XPS analyses were performed for a non-corroded sample, a sample after a 15 minute immersion at the OCP, and samples after the polarization until the potentials before and after the passivity breakdown.
Results showed that, for the non-corroded sample, the intensity of Cu 2p3/2 (Figure 5 a and b) and Zn 2p3/2 (Figure 5 c and d) peaks was strong. Deconvolution of these peaks, as well as that of Auger Cu peak (Figure 5 e and f), showed that the surface was covered by a passive film mainly composed of Cu2O and ZnO for a lower part. However, the signals of both metallic Zn and Cu were strong showing that this passive film was very thin. After a 15 minutes immersion at OCP in the pH 11 solution, the general spectrum (Figure 4) evidenced a decrease of Zn 2p3/2 peak. Figure 5 c confirmed that the Zn 2p3/2 peak was significantly reduced and its intensity was even lower for the pH 12 solution (Figure 5 d) compared to pH 11. This was confirmed by XPS semi-quantitative analysis of the samples (Figure 6). The results thus corroborated the dezincification hypothesis and showed that the dezincification process was increased when the pH increased. This was correlated with an evolution of the composition of the surface with, after immersion at
Figure 6. XPS semi-quantification for the characterization of the dezincification phenomenon of α,β’ brass CuZn40Pb2 during immersion at the OCP and anodic polarization in a 0.5M NaNO3 solution (a) at pH 11 (b) at pH 12. The Cu/Zn ratio of a non-corroded sample (reference) is reported for comparison.
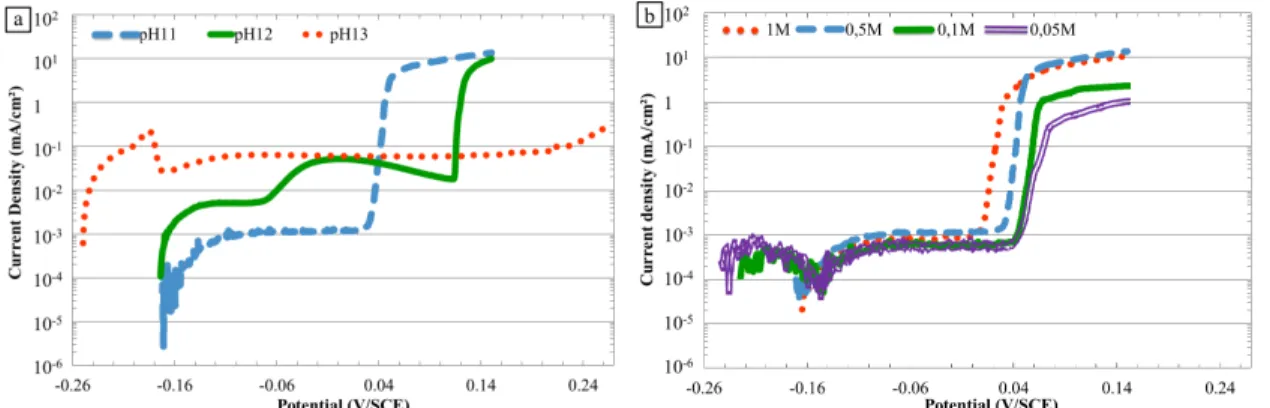
Figure 7. Current density vs. potential curves for the α,β’ brass CuZn40Pb2 (a) at various pHs, 0.5 M NaNO3 (b) at various nitrate ion concentrations, pH 11
Corrosion behavior of α,β’-brass CuZn40Pb2 under anodic polarization
The anodic behavior of the material, evaluated through anodic polarization curves plotted after 15 minutes at OCP, is shown in Figure 7. Globally, all curves presented a similar shape with a first breakdown potential corresponding to the corrosion potential, Ecorr, then a passivity or pseudo-passivity plateau followed by a second breakdown potential, Ebp, and finally a strong increase of the current densities corresponding to the passivity/pseudo passivity breakdown. Figure 7a shows the influence of the pH on the current-potential curves. The shift of the OCP towards more cathodic values when the pH value increased, as shown in Figure 2 a, was clearly evidenced on the polarization curves with the shift of Ecorr. Furthermore, a significant influence of the pH was observed on the current densities and on the values of the second breakdown potential, Ebp. At pH 11, a passivity plateau was observed that was characterized by low current densities
OCP in pH 11, a passive layer mainly composed of Cu2O with a very low amount of
ZnO; at pH 12, the passive layer seemed to be thicker and mainly composed of Cu2O, Zn being significantly depleted at the surface. The differences in the chemical composition of the surface layer depending on the pH should explain the OCP results (Figure 2 a). The slowing down of the OCP evolution rate and the decrease of the OCP values when the pH increased should be related to a higher dezincification process leading to a more porous structure of the brass surface.
Figure 8. Optical microscope observations of the α,β’ brass CuZn40Pb2 after interrupted anodic polarization tests in a 0.5 M NaNO3 solution (a) before breakdown potential (20 mV.SCE), pH 11 (b) after breakdown potential (50 mV.SCE), pH 11 (c) before breakdown potential (50 mV.SCE), pH 12 (d) after breakdown potential (140 mV.SCE), pH 12.
At pH 11, during the passivity stage, OM observations (Figure 8a) and XPS analyses (Figure 5) did not show any significant evolution of the surface on the passivity plateau compared to the surface analyzed after OCP. The formation of a Cu2O layer was revealed (Figure 5 a and e), with Cu in metallic form, demonstrating that the passive layer should be thin. After the breakdown potential, OM observations (Figure 8 b) showed that the β’ phase started to dissolve locally while the α phase appeared to remain stable. XPS analyses (Figure 5) showed no significant differences concerning the major elements, i.e., Cu and Zn, compared to the results on the passivity plateau. This was probably because
c d
b a
approximately 10-6 A.cm-2 before Ebp. For a pH 12 solution, an intermediate breakdown potential, Ebi, was evidenced: Ecorr was first followed by a passivity plateau at higher current densities than for pH 11, i.e., approximately 5.10-6 A.cm-2; then, after Ebi, a pseudo-passivity plateau characterized by current densities approximately 6.10-5 A.cm-2 was observed before the breakdown potential Ebp. At pH 13, only the pseudo-passivity plateau was observed before Ebp with current density values similar to those values for pH 12. Concerning the breakdown of the passivity or the pseudo passivity, observations showed that an increase in the pH shifted the breakdown potential, Ebp, towards more anodic potentials. Similarly to the OCP results (Figure 2 b), the effect of nitrate ion concentration on the current-potential curves was studied for a pH 11 solution (Figure 7b). The results showed that a variation in nitrate ion concentration did not show a significant effect on the current-potential curves. It had no effect on the current densities of the passivity stage; however, a decrease in the nitrate ion concentration led to a small shift of the second breakdown potential, Ebp, towards more anodic potentials
Characterization of the α,β’ brass CuZn40Pb2 anodic behavior was completed by OM surface observations (Figure 8) and XPS chemical analyses (Figure 5) after interrupted polarization tests performed in solutions at pH 11 and 12. Selected arrest potentials for analyses were chosen at points before and after the passivity/pseudo-passivity breakdown, i.e .20mV/SCE and 50 mV/SCE at pH 11 and 50 mV/SCE and 140mV/SCE at pH 12.
the breakdown of the passivity corresponded to local corrosion phenomena on the β’ phase. Quantification of the Cu and Zn amounts corroborated the results (Figure 6). The dezincification process occurred during immersion at OCP; it was not significantly promoted by an anodic polarization in a pH 11 solution for a short time polarization. At pH 12, before the end of the pseudo-passivity stage, OM observations (Figure 8c) showed an inversion in color between the α and the β’ phases. A new surface layer seemed to be formed on the α phase. XPS analyses (Figure 5 b, d and f) showed the formation of a layer mainly composed of Cu2O, CuO and Cu(OH)2.After the breakdown potential, OM observations showed that the β' phase was considerably dissolved (Figure 8 d) while a layer remained on the α phase. XPS analyses (Figure 5 b, d and f) revealed some significant changes in the chemical composition of the surface layer. CuO and Cu(OH)2
signals were not observed while Cu2O was still detected. Concerning Zn, Figure 5d
showed that ZnO participated in the formation of the thick surface layer observed during the pseudo-passivity stage. However, after the pseudo-passivity breakdown, the Zn signal was significantly reduced. Figure 6 clearly evidenced this surface evolution. As previously stated, the immersion of the α,β’ brass at the OCP in a pH 12 solution led to a dezincification phenomenon stronger than at pH 11. When the brass was polarized at potentials corresponding with the pseudo-passivity, a thick surface layer formed, leading to an additional dezincification of the brass in the bulk and an incorporation of Zn as ZnO in this surface layer. Therefore, the Cu/Zn ratio measured by XPS was lower than that after the OCP. When the sample was polarized at a higher potential, after the pseudo-passivity breakdown, this thick surface layer was removed and its chemical composition strongly evolved. Dissolution phenomena on the β’ phase continued and a strong dezincification was observed, leading to a very high Cu/Zn ratio.
Discussion
Immersion of the α,β’-brass CuZn40Pb2 in basic solutions of sodium nitrate (pH 11, 12 and 13) at the OCP led to a spontaneous surface dezincification. This occurred simultaneously with the formation of a passive/pseudo-passive oxide layer that was identified by XPS analyses. The results showed that this layer was mainly composed of copper oxide. At the microstructural scale, OM observations indicated that the α phase was relatively stable in the nitrate solutions compared to the β’ phase, for which the chemical composition strongly evolved due to complex dissolution mechanisms. The galvanic coupling between the two phases probably acted according to the mechanism proposed by Assouli et al. (25). Small electrochemical cells could exist at the microstructural scale with the α phase, which contains more copper than the β’ phase, being more noble than the β’ phase and acting as the cathode while the β’ phase was the anode. Therefore, passivation could occur in the α phase with the formation of a copper oxide layer. Concerning the β’ phase, an initial dezincification process should be necessary to achieve a surface that was more noble and susceptible to passivation, leading to the formation of a copper-rich oxide layer.
Influence of pH. OCP values were found to decrease with an increase in pH, which was in agreement with previous studies on α-brass (19). This could be attributed to the formation of a poorly efficient passive layer as the pH increased. It was assumed that the passive film formed at pH 12 should evolve during the immersion in the nitrate solution and, for example, the participation of Cu(OH)2 in the oxide layer should make it more
porous and therefore less protective. Concerning the selective dissolution of the Zn present in the β’ phase, the Pourbaix diagram for Cu and Zn (pure metals) provides data on the stability of the species under different pH conditions. This approach is quite simplistic; the metals are studied separately in a very simple aqueous solution. Nevertheless, these diagrams show that Zn stability decreases when the pH increases. Zn(OH)2 is the most stable species until pH 10. Beyond that, HZnO2- and ZnO22- are the thermodynamically stable species, which could explain the corrosion that the β’ phase undergoes in solution over the range of pH that was tested. The level of the β’ phase dezincification as a function of pH may be associated to the propensity of the Zn dissolution in this phase. Dezincification was faster as the pH increased, but, for immersion at OCP, dezincification did not affect the material in the bulk in agreement with the stabilization of the OCP. This could be due to the formation of a copper-rich surface layer which is stable in this pH range. Indeed, the range of pH corresponded to
the stability of Cu, Cu2O and CuO (for higher potentials) according to Pourbaix’s
diagram of pure copper. These data could be easily extended to brass to explain the formation of the Cu2O passive layer in this range of pH for the α phase and for the β’ phase after the initial stage of surface dezincification. Concerning the behavior of the brass under anodic polarization, the pH effect was strong. At low pH (11), a passivity stage was observed whereas at higher pH (12 or 13), only a pseudo-passivity phenomenon was observed. With increasing the pH value, the passivity layer formed should be considered as less efficient. The results could be explained by the species detected by the XPS analyses at pH 12, i.e., Cu(OH)2/CuO. Cu(OH)2 was probably less efficient in achieving a passivity of the brass. However, the question of efficiency of the passive layer is complex since, as shown by the current-potential curves, the passivity/pseudo-passivity breakdown potentials increased with the pH, which could be due to the stability/thickness of the passive layers formed as a function of pH.
Influence of nitrate ion concentrations. Variation in the nitrate ion concentration led to small differences in the OCP values for tests of 15 minutes, but longer experiments showed that the OCP values were quite similar over the range of nitrate ion concentrations tested. Nitrate ion concentration affects the O2 availability in solution, which could explain why, depending upon the nitrate ion concentration, the rate of the OCP evolution versus time was different and longer experiments were necessary to obtain an OCP stabilization. Concerning the corrosion behavior of the brass under an anodic polarization, the nitrate ion concentration was found to significantly influence the passivity breakdown. Additional experiments showed that, in adjusted pH solutions without NaNO3, the passivity breakdown was not observed at pH 11 and pH 12, whereas the current densities during the passivity stages were similar to those measured in the presence of nitrate ions. As stated by Fernandez et al. (19), for α-brass, NO3- could certainly play a role in the corrosion mechanism observed after the passivity breakdown.
Conclusions
Results for the α,β’-brass CuZn40Pb2 in NaNO3 solutions are summarized in the following points.
- Preferential Zn dissolution, promoted by the galvanic coupling between the α and the β’ phases was observed on the β’ surface at the open circuit potential (OCP). The kinetics depended essentially on the pH.
- The anodic behavior investigated by the current-potential curves was characterized by a passivity/pseudo-passivity stage followed by a passivity breakdown for which NO3- participation was a key parameter. A copper-rich passive layer was formed in basic solutions of NaNO3 but the properties of the passive layer depended significantly on the pH of the solution and on the corresponding oxides that were formed.
This work was performed in the framework of the CETIMAT. The CIRIMAT and the CETIM collaborate for certain aspects of their research activities; this collaboration is performed in a joint laboratory, called CETIMAT.
Acknowledgments
The authors would like to express their sincere thanks to J. Esvan for the XPS analyses performed in the CIRIMAT laboratory.
References
1. J. Yu and R. N. Parkins, Corros. Sci., 27(2), 159 (1987).
2. J. Yu, R. N. Parkins, Y. Xu, G. Thompson and G. C. Wood, Corros. Sci., 27(2), 141 (1987).
3. R. B. Rebak, R. M. Carranza and J. R. Galvele, Corros. Sci., 28(11), 1089 (1988). 4. A. T. Cole, R. C. Newman and K. Sieradzki, Corros. Sci., 28(1), 109 (1988). 5. R. M. Carranza and J. R. Galvele, Corros. Sci., 28(9), 851 (1988).
6. D. Wu, H. S. Ahluwalia, H. Cai, J. T. Evans and R. N. Parkins, Corros. Sci., 32(7), 769 (1991).
7. F. Mackay, J. T. Evans and R. N. Parkins, Corros. Sci., 33(5), 699 (1992). 8. E. A. Ashour and B. G. Ateya, Corros. Sci., 37(3), 371 (1995).
9. M. G. Alvarez, P. Lapitz, S. A. Fernandez and J. R. Galvele, Corros. Sci., 47, 1643 (2005).
10. P. Lapitz, J. Ruzzante and M. G. Alvarez, Corros. Sci., (49), 3812 (2007). 11. M. B. Hintz, L. J. Nettleton and L. A. Heldt, Metall. Trans. A, 16A, 971 (1985). 12. M. B. Hintz, W. K. Blanchard, P. K. Brindley and L. A. Heldt, Metall. Trans. A,
17A, 1081 (1986).
13. F. Zucchi, G. Trabanelli, M. Fonsati and A. Giusti, Mater Corros, 49, 864 (1998). 14. B. Assouli, A. Srhiri and H. Idrissi, NDT&E Int., 36, 117 (2003).
15. E. Brandl, R. Malke, T. Beck, A. Wanner and T. Hack, Mat. Corros., 60(4) (2009). 16. E. Sarver and M. Edwards, Corros. Sci., 53, 1913 (2011).
17. C. Mapelli, A. Gruttadauria and M. Bellogini, Eng. Fail. Anal., 17, 431 (2010). 18. C. Mapelli, D. Mombelli, S. Barella and A. Gruttadauria, Eng. Fail. Anal., 27, 141
(2013).
19. S. A. Fernandez and M. G. Alvarez, Corros. Sci., 53, 82 (2011).
20. T. KG. Namboodhiri, R. S. Chaudhary, B. Prakash and M. K. Agrawal, Corros. Sci., 22(11), 1037 (1982).
21. J. J. Podesta, G. P. Rothwell and T. P. Hoar, Corros. Sci., 11, 241 (1971). 22. L. Burzynska, Corros. Sci., 43, 1053 (2001).
23. T. J. Kagetsu and W. F. Graydon, J. Electrochem. Soc., 110(7), 709 (1963). 24. J. Bumbulis and W. F. Graydon, J. Electrochem. Soc., 109(12), 1130 (1962). 25. B. Assouli, Thèse de doctorat, (2002).