Publisher’s version / Version de l'éditeur:
Vous avez des questions? Nous pouvons vous aider. Pour communiquer directement avec un auteur, consultez
la première page de la revue dans laquelle son article a été publié afin de trouver ses coordonnées. Si vous n’arrivez pas à les repérer, communiquez avec nous à PublicationsArchive-ArchivesPublications@nrc-cnrc.gc.ca.
Questions? Contact the NRC Publications Archive team at
PublicationsArchive-ArchivesPublications@nrc-cnrc.gc.ca. If you wish to email the authors directly, please see the first page of the publication for their contact information.
https://publications-cnrc.canada.ca/fra/droits
L’accès à ce site Web et l’utilisation de son contenu sont assujettis aux conditions présentées dans le site LISEZ CES CONDITIONS ATTENTIVEMENT AVANT D’UTILISER CE SITE WEB.
Galvanized Autobody Partnership Progress Report, 2006-10-01
READ THESE TERMS AND CONDITIONS CAREFULLY BEFORE USING THIS WEBSITE.
https://nrc-publications.canada.ca/eng/copyright
NRC Publications Archive Record / Notice des Archives des publications du CNRC :
https://nrc-publications.canada.ca/eng/view/object/?id=7c97eb10-5521-4c9b-9021-a2e81f4df6ce https://publications-cnrc.canada.ca/fra/voir/objet/?id=7c97eb10-5521-4c9b-9021-a2e81f4df6ce
NRC Publications Archive
Archives des publications du CNRC
This publication could be one of several versions: author’s original, accepted manuscript or the publisher’s version. / La version de cette publication peut être l’une des suivantes : la version prépublication de l’auteur, la version acceptée du manuscrit ou la version de l’éditeur.
Access and use of this website and the material on it are subject to the Terms and Conditions set forth at
ILZRO Project ZCO-8-10: Dissolution and Growth of Dross Particles During Galvanize and Galvanneal Operations
Dissolution and growth of dross particles
during galvanize and galvanneal operations
Frank Ajersch, PhD, Professor
Ecole Polytechnique de Montréal
Mohamad Sabsabi, PhD and Paul Bouchard, PhD
Industrial Materials Institute National Research Council Canada
ILZRO N.A. GAP Meeting
Indianapolis, 10-11 May 2007
2 2
BACKGROUND
• Kinetics of dross formation and dissolution
• Rate of iron dissolution from strip
• Development of LIBS (Laser Induced Breakdown Spectroscopy)
• Successful lab scale trials and plant (Sorevco) trials
OBJECTIVES
• Measurement of the rate of formation and growth of dross
particles in controlled simulated conditions
• Sensitivity of LIBS technology
• Comparison with other analytical tools
4 4
METHODOLOGY
(SUMMARY)
• Dross formation
• Dross dissolution
• Transition tests
• Bottom dross to top dross
• Top dross to bottom dross
Continuous
LIBS
Analysis
Analysis of pot Samples :
•Particle analysis – morphology (image analysis)
•SEM and X-ray spectroscopy
Gas flow Laser beam Molten Zn bath Laser head +
light collection optics
Plasma Probe lance Bubbles Dross Stirrer
6 6
DROSS FORMATION
AND DISSOLUTION
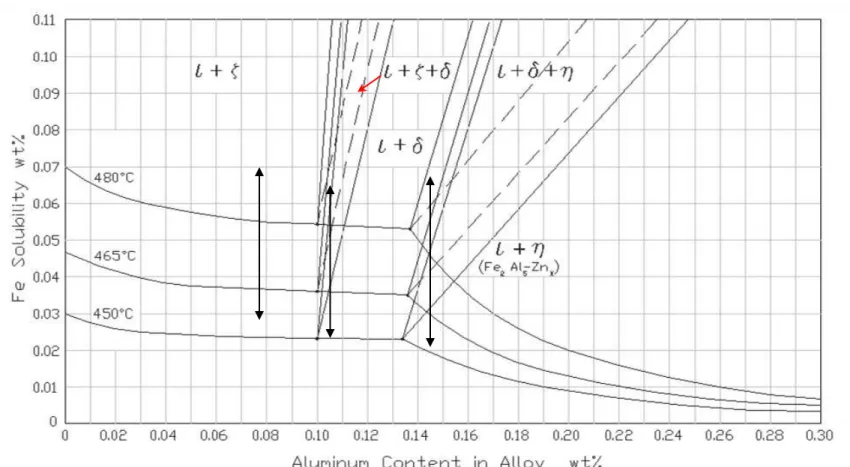
• Step 1 : Saturate zinc bath with Al an Fe at 500°C (solubility data from Tang)
For effective Al contents of: 0.08% Al
0.12% Al 0.18% Al
• Step 2 : Decrease temperature of bath at about 1°C per minute down to 430°C with continuous stirring (formation). Increase temperature back to 500°C at same rate (dissolution).
Two stirring speeds were used: 200 rpm
500 rpm • Monitor Al and Fe composition using LIBS
8 8
TRANSITION TESTS
BOTTOM DROSS TO TOP DROSS
• Bath at galvanneal composition (0.07% Fe) with no Al content
• Constant bath temperature at 460°C
• Add small quantities of Al-Zn alloy (5% Al) to gradually increase
the Al content up to 0.18% Al
ANALYSIS OF
POT SAMPLES
Samples were taken using a small spoon and solidified in a
graphite mold
Polished sections: micrography
• Image analysis of particle size distribution and evolution
• SEM and X-ray spectroscopy of particles
10 10
Experimental set-up:
Experimental set-up:
12 12
Experimental set-up:
Dross formation (z phase)
and dissolution results
0.08% Al 0.07% Fe (total)
200 rpm
500 rpm
Al
14 14
Dross formation (d phase)
and dissolution results
0.12% Al 0.07% Fe (total)
200 rpm
500 rpm
Al
Dross formation (h phase)
and dissolution results
0.18% Al 0.07% Fe (total)
200 rpm
500 rpm
Al
16 16
Transition tests results
0.07% Fe (total) T = 460°C
200 rpm
500 rpm
Al and Fe concentration measurement in molten zinc by LIBS: Al and Fe LIBS signal vs. time
0.03 0.05 0.07 0.09 0.11 0.13 0.15 0.17 0.19 0 40 80 120 160 200 240 time (min) Al c o n ce n trat io n ( %) 0.01 0.015 0.02 0.025 0.03 0.035 Fe concentra tio n (%)
LIBS signal (Al) LIBS signal (Fe) [Fe] = 0.07% stirrer: 200 rpm
Al and Fe concentration measurement in molten zinc by LIBS: Al and Fe LIBS signal vs. time
0.03 0.05 0.07 0.09 0.11 0.13 0.15 0.17 0.19 0 40 80 120 160 200 240 time (min) Al conce ntrat ion (% ) 0.01 0.015 0.02 0.025 0.03 0.035 F e c o n ce n trat io n ( %)
LIBS signal (Al) LIBS signal (Fe) [Fe] = 0.07% stirrer: 500 rpm
Transition tests results
0.07% Fe (total) T = 460°C
Al calibration curves
18 18
Micrographs of Dross Particles
(
z
phase)
Solution: 0.08%Al, 0.07%Fe, 200 rpm
489°C (500X) 440°C (100X) 490°C (500X)
Micrographs of Dross Particles
(
z
phase)
Solution: 0.08%Al, 0.07%Fe, 500 rpm
490°C (200X) 450°C (100X) 490°C (100X)
20 20
Micrographs of Dross Particles
(
d
phase)
Solution: 0.12%Al, 0.07%Fe, 200 rpm
440°C (100X) 500°C (100X) 480°C (100X)
Micrographs of Dross Particles
(
d
phase)
Solution: 0.12%Al, 0.07%Fe, 500 rpm
490°C (100X)
470°C (100X)
22 22
Micrographs of Dross Particles
(
h
phase)
Solution: 0.18%Al, 0.07%Fe, 200 rpm
435°C (500X) 500°C (500X) 500°C (500X)
Micrographs of Dross Particles
(
h
phase)
Solution: 0.18%Al, 0.07%Fe, 500 rpm
500°C (500X)
435°C (500X)
24 24
Size and Shape of Dross Particles
(
z
phase)
Solution: 0.08%Al, 0.07%Fe, 200 rpm
Average Spherical Diameter as Function of Temperatur
0,00 10,00 20,00 30,00 40,00 50,00 60,00 506 489 480 468 460 450 440 435 440 450 460 470 480 490 500
Average Aspect Ratio as Function of Temperature
0,00 1,00 2,00 3,00 4,00 5,00 6,00 7,00 8,00 9,00 506 489 480 468 460 450 440 435 440 450 460 470 480 490 500
Size and Shape of Dross Particles
(
z
phase)
Solution: 0.08%Al, 0.07%Fe, 500 rpm
Average Spherical Diameter as Function of Temperatur
0,00 10,00 20,00 30,00 40,00 50,00 60,00 70,00 80,00 90,00 500 490 480 470 460 450 440 435 440 450 460 470 480 490 500
Average Aspect Ratio as Function of Temperature
0,00 1,00 2,00 3,00 4,00 5,00 6,00 7,00 8,00 9,00 500 490 480 470 460 450 440 435 440 450 460 470 480 490 500
26 26
Size and Shape of Dross Particles
(
d
phase)
Solution: 0.12%Al, 0.07%Fe, 200 rpm
Average Spherical Diameter as Function of Temperatur
0,00 10,00 20,00 30,00 40,00 50,00 60,00 70,00 500 490 480 470 460 449 440 435 440 450 460 470 480 490 500
Average Aspect Ratio as Function of Temperature
0,00 0,50 1,00 1,50 2,00 2,50 3,00 3,50 500 490 480 470 460 449 440 435 440 450 460 470 480 490 500
Size and Shape of Dross Particles
(
d
phase)
Solution: 0.12%Al, 0.07%Fe, 500 rpm
Average Spherical Diameter as Function of Temperatur
0,00 10,00 20,00 30,00 40,00 50,00 60,00 70,00 80,00 90,00 100,00 500 490 480 470 460 450 440 435 440 450 460 470 480 490 500
Average Aspect Ratio as Function of Temperature
0,00 0,50 1,00 1,50 2,00 2,50 3,00 3,50 4,00 4,50
28 28
Size and Shape of Dross Particles
(
h
phase)
Solution: 0.18%Al, 0.07%Fe, 200 rpm
Average Spherical Diameter as Function of Temperature
0,0 5,0 10,0 15,0 20,0 25,0 30,0 500 490 480 470 460 450 440 435 440 450 460 470 480 490 500 Temperature (°C)
Average Aspect Ratio as Function of Tempreature
0,0 0,5 1,0 1,5 2,0 2,5 3,0 500 490 480 470 460 450 440 435 440 450 460 470 480 490 500 Temperature (°C)
Size and Shape of Dross Particles
(
h
phase)
Solution: 0.18%Al, 0.07%Fe, 500 rpm
Average Spherical Diameter as Function of Temperature
0,0 20,0 40,0 60,0 80,0 100,0 120,0 140,0 160,0 500 490 480 470 460 450 440 435 440 450 460 470 480 490 500 Temperature (°C)
Average Aspect Ratio as Function of Temperature
0,5 1,0 1,5 2,0 2,5 3,0
30 30
Summary of particle
sizes and shapes
Particle Type
200 rpm 500 rpm
500°C → 435°C 435°C → 500°C 500°C → 435°C 435°C → 500°C
size A. R. size A. R. size A. R. size A. R.
µm L1/L2 µm L1/L2 µm L1/L2 µm L1/L2
z phase 5 - 30 1 - 5 30 - 10 4 - 2 10 - 55 2 - 7.5 55 - 20 7.5 - 3
d phase 5 - 40 1.5 - 2.5 40 - 30 2.5 – 2.0 50 - 60 2.0 – 2.5 50 - 60 3.0 – 2.0
CONCLUSIONS
1. The formation and dissolution of particles of all three phases (z, d and h) can be monitored using the LIBS system and the analysis of the particle sizes of samples taken from the bath.
2. Solubility limits of Al and Fe in the bath were verified using a calibration technique and were found to
correspond to the values from the phase diagram.
3. Generally, all three types of particles are larger for the case of stirring at 500 rpm when compared to 200 rpm. The average particle sizes measured from 5 µm to
32 32
CONCLUSIONS
4. Zeta (z) phase particles grow and redissolve during the temperature cycle for both 200 rpm and 500 rpm tests. Aspect ratios also increase and decrease over a wide range over the temperature cycle.
5. Delta (d) phase particles also increase in size with
decreasing temperature but do not redissolve as rapidly when the temperature is increased. The aspect ratios vary over a smaller range for the temperature cycle. 6. Eta (h) phase particles are the smallest at the low
mixing speed and are relatively compact. The particle sizes increase very slowly but do not decrease as the temperature is increased back to 500°C. The particles are larger at 500 rpm with no specific trend as to particle size.