HAL Id: hal-00123922
https://hal.archives-ouvertes.fr/hal-00123922
Submitted on 31 Aug 2020HAL is a multi-disciplinary open access
archive for the deposit and dissemination of sci-entific research documents, whether they are pub-lished or not. The documents may come from teaching and research institutions in France or abroad, or from public or private research centers.
L’archive ouverte pluridisciplinaire HAL, est destinée au dépôt et à la diffusion de documents scientifiques de niveau recherche, publiés ou non, émanant des établissements d’enseignement et de recherche français ou étrangers, des laboratoires publics ou privés.
Validation of MIPAS-ENVISAT version 4.61 HNO3
operational DATA by stratospheric balloon, aircraft and
ground-based measurements
H. Oelhaf, T. Blumenstock, M. de Mazière, S. Mikuteit, C. Vigouroux, S.
Wood, G. Bianchini, R. Baumann, C. Blom, U. Cortesi, et al.
To cite this version:
H. Oelhaf, T. Blumenstock, M. de Mazière, S. Mikuteit, C. Vigouroux, et al.. Validation of MIPAS-ENVISAT version 4.61 HNO3 operational DATA by stratospheric balloon, aircraft and ground-based measurements. Proceedings of the Second Workshop on the Atmospheric Chemistry Validation of ENVISAT (ACVE?2), 3-7 Mai 2004, ESA-ESRIN, Frascati, Italie, May 2004, Frascati, Italy. 7 p. �hal-00123922�
VALIDATION OF MIPAS-ENVISAT VERSION 4.61 HNO
3OPERATIONAL DATA BY
STRATOSPHERIC BALLOON, AIRCRAFT AND GROUND-BASED MEASUREMENTS
H. Oelhaf(1), T. Blumenstock(1), M. De Mazière(7), S. Mikuteit(1), C. Vigouroux(7), S. Wood(8), G. Bianchini(5),
R. Baumann(6), C. Blom(1), U. Cortesi (5), G.Y. Liu(1) , H. Schlager(6), C. Camy-Peyret(2), V. Catoire(3),
M. Pirre(3), K. Strong(4), G. Wetzel(1)
(1)
IMK-ASF, Forschungszentrum Karlsruhe, Karlsruhe, Germany, Email: [email protected]
(2)
LPMA, Universite Pierre et Marie Curie / CNRS, Paris, France
(3)
LPCE/CNRS et Université d'Orléans, Orléans, France
(4)
Department of Physics, University Toronto, Canada
(5)
Istituto di Fisica Applicata "Nello Carrara" (IFAC-CNR), Firenze, Italy
(6)
DLR-IPA, Oberpfaffenhofen, Germany
(7)
Belgian Institute for Space Aeronomy (BIRA), Brussels, Belgium
(8)
NIWA, Lauder, New Zealand
ABSTRACT
Embedded in the ENVISAT validation programme of the chemistry instruments GOMOS, MIPAS, and SCIAMACHY, a large number of balloon-borne, aircraft and ground-based measurements were carried out in the years 2002 and 2003 at various locations. Unfortunately, by the date of the ACVE-2 conference, re-analyzed operational MIPAS data was almost only available for the year 2002 limiting the number of validation cases with the new operational version 4.61 (v4.61) data significantly. Generally, the MIPAS HNO3
profiles as processed with v4.61 are in good agreement with airborne observations in all cases with a good coincidence in time and space between the MIPAS observations and the correlative measurements. However, these validation cases have been confined so far to mid-latitudes only. Retrievals of MIPAS HNO3
profiles as obtained by different processors appear to be generally rather robust as proven by a statistics of inter-comparisons of HNO3 profiles between the
operational v4.61 data and data processed with the IMK scientific processor. Ground-based correlative measurements based on the FTIR technique have been provided from different sites all over the world. Both column amounts and vertical profiles of HNO3 with
coarse resolution can be derived from such measurements. This data is potentially very useful for monitoring the longer term quality of MIPAS satellite data. However, the comparison of those columns amounts and profiles is not straightforward and a careful and consistent procedure needs to be applied to determine comparable values for the columns as well as to take into account the different vertical resolutions of the space-borne limb emission and the ground-based solar absorption measurements.
Further validation coincidences in different geophysical situations have to be considered based on v4.61 data before a final quantitative assessment on the
quality of the MIPAS operational HNO3 data will
become possible.
1. INTRODUCTION
The absolute necessity of validating satellite instrument products is obvious from experience with prior space instruments (as, e.g., described in [1]). Increasing complexity of space instruments and enhanced diversity of products expected from instruments like MIPAS on ENVISAT (called hereafter MIPAS-E) demand for even increased efforts in validation. Apart from satellite measurements, balloon-borne observations are a very useful tool to obtain distributions of a large number of molecules with sufficiently high vertical resolution over most of the stratospheric altitude region. However, due to a large logistical effort the number of these flights will be very limited. This holds also for aircraft observations which may cover larger horizontal regions compared to balloons, but are restricted to the lowermost stratosphere. Ground-based measurements can be carried out routinely all over the year but the vertical resolution is generally very low.
This paper outlines the current status of the validation activities of MIPAS within the ACVE community concerning the molecule HNO3 as reported during the
ACVE-2 meeting in Frascati (Italy) from 3-7 May 2004. The comparisons were preferably made to the new MIPAS ESA operational v4.61 data. However, unfortunately almost no v4.61 data for the year 2003 was available by the time of the ACVE-2 meeting. Therefore, some comparisons to older version 4.5x data or comparisons to off-line retrieved data have also been considered in this evaluation, whereas examples are shown only if the comparisons were based on the latest processor version v4.61.
_______________________________________________________
Proceedings of the Second Workshop on the Atmospheric Chemistry Validation of ENVISAT (ACVE-2) ESA-ESRIN, Frascati, Italy, 3-7 May 2004 (ESA SP-562, August 2004) EMI02HO2
2. BALLOON-BORNE OBSERVATIONS
Only one case of direct comparison of MIPAS-E HNO3
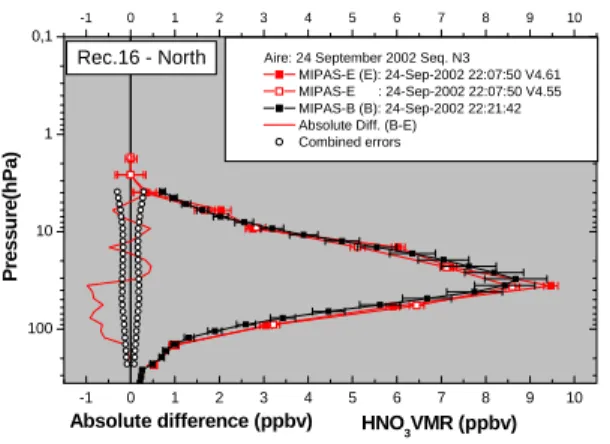
measurements as processed with the latest processor version 4.61 to coincident balloon-borne measurements has been available by the time of the ACVE-2 conference: On 24 September 2002 a mid-latitude flight was carried out with the cryogenic Fourier transform infrared spectrometer MIPAS-B [2], the balloon-borne version of MIPAS on ENVISAT (MIPAS-E). For this flight a perfect coincidence in terms of time and location between MIPAS-E and MIPAS-B could be achieved for two MIPAS-E scans of orbit #2975. Figure 1 shows the HNO3 profile as
measured by MIPAS-B compared to profiles obtained from MIPAS-E with the two processor versions 4.55 and 4.61. The collocation in the example shown was better than 20 min in time and better than 100 km in location. The comparison reveals an excellent agreement with only a slight high bias of MIPAS-E between about 40 and 150 hPa.
0,1 1 10 100 -1 0 1 2 3 4 5 6 7 8 9 10 -1 0 1 2 3 4 5 6 7 8 9 10
Aire: 24 September 2002 Seq. N3 MIPAS-E (E): 24-Sep-2002 22:07:50 V4.61 MIPAS-E : 24-Sep-2002 22:07:50 V4.55 MIPAS-B (B): 24-Sep-2002 22:21:42 Absolute Diff. (B-E)
Combined errors
Absolute difference (ppbv) HNO3VMR (ppbv) Rec.16 - North
Pressu
re(
h
Pa)
Fig. 1. Direct comparison of MIPAS-Envisat and MIPAS-Balloon HNO3 at mid-latitudes along with
absolute differences and combined error bars (1 σ). Error bars for MIPAS-B represent the total 1-σ uncertainty while for MIPAS-E only the noise error is given.
For another series of balloon flights carried out with various sensors either MIPAS-E v4.61 data have not yet been available or do exhibit an imperfect coincidence between the Envisat and the correlative measurement which is requiring some trajectory matching before a quantitative assessment becomes possible.
The diode laser spectrometer SPIRALE [3] measured HNO3 during a flight at mid-latitudes on 2 October
2002 from Aire-sur-l’Adour (44°N, France). Since there was no MIPAS-E data available on this date, backward trajectory calculations were performed to match MIPAS-E on 25, 27, and 28 September 2002.
The inter-comparison shown in Figure 2 reveals a good agreement apart from the region of the peak which appears much sharper in the MIPAS-E case and a general tendency of a slight low bias in MIPAS-E. Balloon flights in arctic winter and spring 2003 from Kiruna (68°N, Sweden) were performed with the instruments LPMA [4] as well as, once more, MIPAS-B and SPIRALE. As for all these flights MIPAS-E v4.61 data have not been available yet, examples are not shown here. Generally, the comparisons with data based on processor v4.5x have revealed a rather good agreement in all cases where good coincidences in time and space were reached. The same holds for a flight of the MANTRA HNO3 radiometer [5] performed over
Canada in September 2002. This finding needs still to be confirmed with data from the latest processor version (v4.61). SPIRALE/MIPAS_200209 300 400 500 600 700 800 900 1000 0 2 4 6 8 10 HNO3 (ppb) T h e ta (K )
Fig. 2. Comparison of SPIRALE HNO3 (black solid
line) obtained on October 2, 2002 to MIPAS-E measurements obtained on September 25 (blue), 27 (purple) and 28 (orange) as selected from trajectory calculations.
3. AIRCRAFT OBSERVATIONS
A considerable number of aircraft missions with the Geophysica and Falcon aircraft was devoted to Envisat validation. Unfortunately, due to unavailability of v4.61 data of MIPAS-ENVISAT, only small subsets of aircraft data gained during campaigns based in Forli/Italy in July and October 2002 could be used for validation so far. Comparisons have been provided from the in-situ sensor SIOUX [6] as well as the remote-sensing instruments MIPAS-STR [7] and SAFIRE [8].
Fig. 3 shows a comparison between the in situ sensor SIOUX and MIPAS-E for a case with excellent coincidence in space and time. SIOUX is a 2-channel chemiluminescence detector and provides [NOy –
NOx]. In the lower stratosphere at mid-latitudes this
difference is within 5% equal to HNO3. In the
stratosphere both data sets agree very well within combined errors. Below about 100 hPa, in the vicinity of the tropopause, SIOUX and MIPAS-E are difficult to compare because of increasing fractions of non-NOx and non-HNO3 reactive nitrogen species and the larger
variability of NOy species. More cases need to be compared as soon as all data will have been processed with v4.61, and the different altitude resolutions need to be taken into account to allow a quantitative evaluation. 500 450 400 350 300 250 200 150 10090 80 70 60 50 40 30 20 20 0 1 2 3 4 5 6 7 8 VMR in ppbv 4.55 4.61 22.07.2002
SIOUX NOy - NOx 09:29 - 09:57 (45.1°N, 11.9°E @ 19.5 km altitude) NOy error bars
MIPAS(V4.55) HNO3, 09:19:25 (19.1 km @ 45.8°N) MIPAS(V4.61) HNO3, 09:19:25 (20.3 km @ 45.7°N, 12.9°E); MIPAS error bars = ± 3*σ
Pre s s u re i n hP a
Fig. 3. Comparison of aircraft in-situ measurements provided by the SIOUX sensor (red) onboard the Geophysica with MIPAS-E observations based on v4.55 (open squares) and v4.61 (full squares)
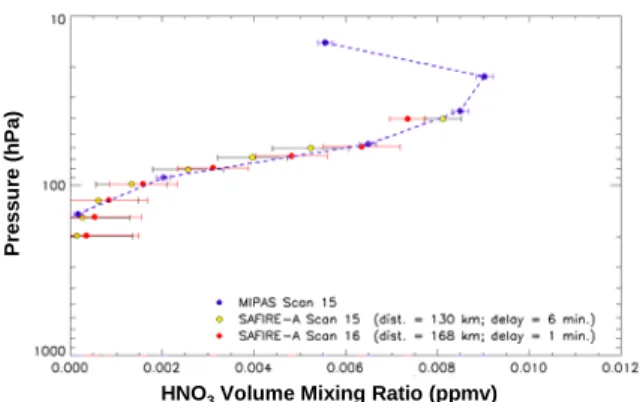
Figure 4 displays a comparison between two scans of the sub-mm Fourier transform spectrometer SAFIRE and scan #15 of MIPAS-E orbit #3403 (blue) which represents an excellent coincidence in time (<10 min) and space (<200 km). The agreement between the correlative measurements and the MIPAS-E HNO3
profile is well within the combined error bars.
HNO3Volume Mixing Ratio (ppmv)
P res su re ( h P a )
HNO3Volume Mixing Ratio (ppmv)
P res su re ( h P a )
Fig. 4. MIPAS-E HNO3 profile of orbit 3403/scan15
(blue dots) compared to two closely collocated profiles of SAFIRE.
The situation is a little bit more complex in the third aircraft comparison case. Figure 5 shows a comparison of two MIPAS-E scans 12 and 13 of orbit 2051 to collocated profiles of MIPAS-STR, the aircraft version of MIPAS. First, it is obvious that the satellite data reveal a huge gradient of HNO3 VMR in the lowermost
stratosphere which is not supported by the aircraft measurement. Furthermore, the ‘North’ scans of MIPAS-STR agree reasonably well with MIPAS-E scan 12 but the opposite is true for the other pair of comparison. It is worth to note here, that obviously this specific orbit of MIPAS-E seems to show unphysical results also for other species, such as N2O and CH4 (cf.
[7])
.
300 270 240 210 180 150 120 90 60 0 1 2 3 4 5 HNO3 [ppbv]M55-flight 22-Jul-2002 / ENVISAT orbit 2051 (v4.61)
MIPAS-STR (north) MIPAS-STR (south) MIPAS-ENV (scan 12) MIPAS-ENV (scan 13) flight level (north) flight level (south)
Pr e s sure [hPa ]
Fig. 5. Comparison of STR profiles to MIPAS-E profiles of v4.61. The error bars for MIPAS-STR profiles show the contributions from spectral noise, radiometric calibration, uncertainty in the HITRAN line data and finally the propagation of a 2 K error in the retrieved temperatures. Note that in this figure 'north' is from the northern flight leg of the Geophysica in which MIPAS-STR is viewing to the south. ‘South’ is from the southern leg in which it was viewing to the north.
4. GROUND-BASED OBSERVATIONS
Ground-based (g-b) measurements of HNO3 are
regularly performed at a series of sites under the framework of the NDSC (Network for the Detection of Stratospheric Change). Intercomparisons of column amounts derived from ground-based measurements at a number of stations all over the world to MIPAS-E data have been compiled at BIRA [9]. In addition, individual comparisons of (partial) column amounts of HNO3 have been provided from a number of stations,
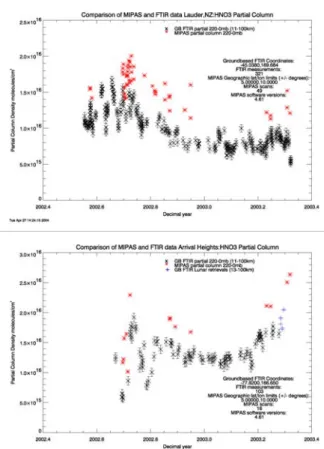
such as Lauder/NZ and Arrival Heights (Antarctica) [10]. Figure 6 presents as an example such comparisons of partial column amounts obtained
between Northern summer 2002 and spring 2003 at Lauder and Arrival Heights to collocated MIPAS-E partial columns. While the seasonal evolution of the HNO3 columns is represented quite well, there is an
obvious high bias in the MIPAS-E partial columns in the order of 10 to 20%. Reasons for this discrepancy are meanwhile mostly understood as discussed below along with Figure 7.
Fig. 6. Stratospheric columns amounts observed with g-b FTIR instruments (black) at Lauder (southern mid-latitudes) and Arrival Heights (Antarctica) as compared to MIPAS-E columns (red) based on v4.61. Coincidence criteria were +/- 5° and +/- 10° in latitude and longitude, respectively, and 12 hours in time. Columns were calculated between 220 and 0 hPa. A compilation of available coincidences at all g-b sites in the same period [9], i.e. the NDSC FTIR stations Harestua (Norway), Jungfraujoch (Switzerland), Kiruna (Northern Sweden), Lauder (New Zealand), Arrival Heights (Antarctica) and Ny Alesund (Spitsbergen), is presented in Fig. 7. The coincidence criterion was rather relaxed (circle of 1000 km radius, 12 hrs) to obtain sufficient statistics. It has to be noted, that here total atmospheric vertical columns from the NDSC stations are compared to only stratospheric columns (i.e. integrated VMR profiles of MIPAS-E above 12 km). Apart from the rather large scatter a systematic high bias of the MIPAS-E data with respect
to the ground-based data of about 20% (on average) is obvious. As the missing tropospheric portion of the MIPAS column can be attributed to be larger than 10% (up to 20%), the bias between the satellite measurement and the gb data is actually less than -10% on average. These remaining differences, and particularly the large scatter is presumably arising from mainly three issues: (1) due to cloud filtering the lowermost data point in MIPAS-E data is changing in altitude which may lead to rather low HNO3 columns
in the case of high Cirrus or PSCs, that means that the partial columns have to be adapted to the lowest MIPAS value, (2) the calculation of the MIPAS-E columns needs to be done using the (retrieved) pressure instead of the (engineering) geometric altitude, and (3) the MIPAS-E altitude resolution needs to be degraded to the coarse resolution of the FTIR g-b measurements. Furthermore, there are some indications that the operational column amounts as given on the MIPAS-E data base are not calculated properly.
Taking these three precautions into account, there remains a positive bias of ~ 10% of the MIPAS-E column amounts with respect to the partial columns amounts as shown recently for the Kiruna data set [11]. The data set for all g-b coincidences is currently being re-evaluated in comparison with MIPAS-E data, by applying a consistent method for calculating the partial columns. First results [12] confirm a systematic bias of MIPAS-E with respect to g-b stratospheric partial columns of the order of +10%. This remaining bias can be explained by a scaling factor that was applied to the HNO3 line intensities in the MIPAS-E spectroscopic
data base used for v4.61 retrievals.
Fig. 7. Inter-comparison of total HNO3 column derived
from various ground-based measurements to MIPAS-E ‘stratospheric’ columns (v4.61). For details, see text. In addition to validation efforts based on (partial) column amounts, profile comparisons have been available for stations located in Kiruna (68°N) [11, 14], Arrival Heights (78°S) [10] and Jungfraujoch (46.5°N)
[13]. Sophisticated retrieval codes have been used in these studies in order to derive some coarsely resolved altitude information of HNO3 fromFTIR ground-based
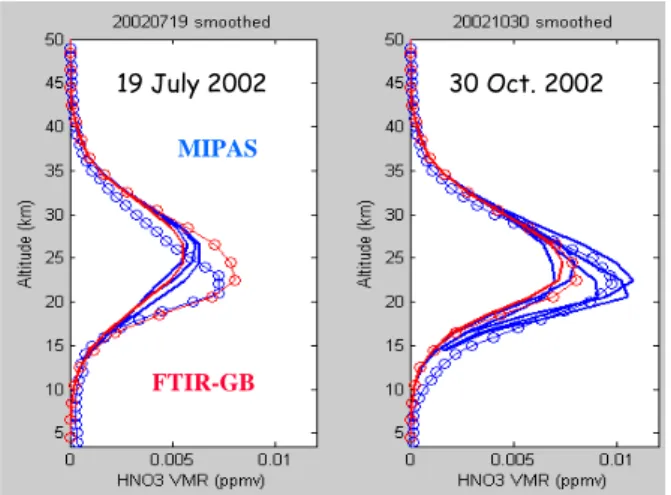
measurements. The vertical resolution is typically between 6 and 10 km (depending on altitude), i.e. a factor of two to three worse than that of the limb sounder MIPAS-E. Anyhow, on a statistical basis such comparisons are very useful due to the large data set provided by the g-b measurements as compared to airborne observations. Due to the large difference in the altitude resolution direct comparisons are not useful, but the two types of data sets (g-b and satellite) have to be brought to a common resolution by applying appropriate techniques. Figure 8 shows a comparison between ground-based FTIR measurements from Jungfraujoch [13] and MIPAS-E for July 19 and October 30, 2002 after applying the averaging kernels of the g-b measurements to the MIPAS-E profiles. While in the July 19 case the agreement is excellent (apart from the high bias of MIPAS-E as explained above) the large scatter of the MIPAS-E profiles in the October 30 case suggests that in this season the chosen coincidence criterion is not tight enough.
19 July 2002 30 Oct. 2002 FTIR-GB MIPAS 19 July 2002 30 Oct. 2002 FTIR-GB MIPAS
Fig. 8. Comparison of coincident MIPAS-E HNO3
profiles (v4.61, blue solid lines) to profiles retrieved from g-b measurements (red solid lines) at Jungfraujoch on two days in 2002. The coincidence criterion was 1000 km and 12 hours. The averaging kernel of the g-b FTIR measurement was applied to the MIPAS-E profiles. Lines with circles represent initial guess or a priori profiles used for MIPAS-E and g-b FTIR, respectively.
The comparison of vertical profiles as derived from g-b measurements obtained in Kiruna to 19 collocated MIPAS-E observations (coincidence criterion: latitude +/- 3°, longitude +/- 20°, time 12h) on a statistical basis is shown in Figure 9 [14]. The Figure reveals a good agreement both in terms of the mean and the 1-σ standard deviation. The bias is again explained by the spectroscopic scaling factor that has been applied in
v4.61 to the HNO3 line intensities. Below about 15 km
the relative differences are getting large due to retrieval instabilities and the low HNO3 values.
10 15 20 25 30 35 -1,5 -1,0 -0,5 0,0 0,5 1,0 1,5 -40 -20 0 20 40 10 15 20 25 30 35 HNO3, Kiruna MIPAS 4.61 19 coinc., all 12 coinc., out of polar vortex FTIR - MIPAS [ppbv] He ig h t [ k m]
(FTIR - MIPAS) / FTIR [%]
Fig. 9. Statistics of 19 coincidence events near Kiruna (of which 12 were selected outside the polar vortex) as obtained from g-b FTIR measurements and resolution-degraded MIPAS-E observations. Left panel: absolute differences, right panel: relative differences.
5. CONCLUSIONS AND OUTLOOK
Validation of HNO3 measurements of MIPAS on
ENVISAT (MIPAS-E) can be based on a considerable number of balloon-borne, aircraft-borne and ground-based measurements that covered different geophysical situations (latitudes, seasons). In situ as well as remote sensing techniques using different spectral domains provide sufficiently independent information for the validation process. Specific advantages and drawbacks of airborne (balloon & aircraft) and ground-based measurements have to be utilized and taken into account. For airborne comparisons the quality of coincidence in time and space between the validation measurement and the satellite observation is particularly crucial since only a restricted number of coincidences can be provided. Ground-based measurements allow statistical approaches to be applied, but only a subset of the MIPAS target species can be validated in terms of partial column amounts or coarsely resolved profiles.
The validation process has been hampered due to a lack of re-processed version 4.61 operational data for the year 2003 where a lot of validation experiments have been carried out. Meanwhile the data for 2003 is being re-processed such that inter-comparison results should be available within the near future.
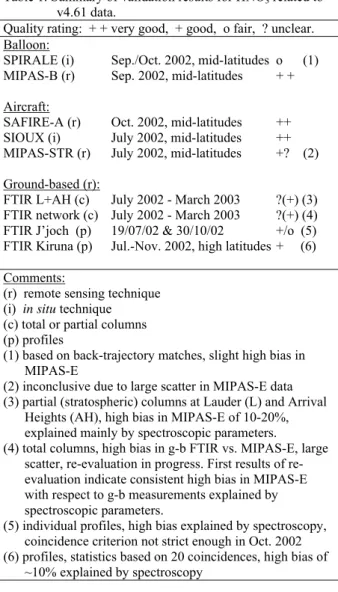
Table 1 gives an overview of the validation results obtained so far, restricted to v4.61 comparisons. The ‘quality rating’ corresponds to the quality of agreement
between the satellite measurement and the correlative observation.
Table 1. Summary of validation results for HNO3 related to
v4.61 data.
Quality rating: + + very good, + good, o fair, ? unclear. Balloon:
SPIRALE (i) Sep./Oct. 2002, mid-latitudes o (1)
MIPAS-B (r) Sep. 2002, mid-latitudes + +
Aircraft:
SAFIRE-A (r) Oct. 2002, mid-latitudes ++
SIOUX (i) July 2002, mid-latitudes ++
MIPAS-STR (r) July 2002, mid-latitudes +? (2)
Ground-based (r):
FTIR L+AH (c) July 2002 - March 2003 ?(+) (3)
FTIR network (c) July 2002 - March 2003 ?(+) (4)
FTIR J’joch (p) 19/07/02 & 30/10/02 +/o (5)
FTIR Kiruna (p) Jul.-Nov. 2002, high latitudes + (6)
Comments:
(r) remote sensing technique (i) in situ technique (c) total or partial columns (p) profiles
(1) based on back-trajectory matches, slight high bias in MIPAS-E
(2) inconclusive due to large scatter in MIPAS-E data (3) partial (stratospheric) columns at Lauder (L) and Arrival
Heights (AH), high bias in MIPAS-E of 10-20%, explained mainly by spectroscopic parameters.
(4) total columns, high bias in g-b FTIR vs. MIPAS-E, large scatter, evaluation in progress. First results of re-evaluation indicate consistent high bias in MIPAS-E with respect to g-b measurements explained by spectroscopic parameters.
(5) individual profiles, high bias explained by spectroscopy, coincidence criterion not strict enough in Oct. 2002 (6) profiles, statistics based on 20 coincidences, high bias of
~10% explained by spectroscopy
Overall, the quality of the operational HNO3 product as
provided from the latest processor version 4.61 can be assessed as robust and reliable. In comparisons to balloon-borne and aircraft measurements with a high degree of coincidence in time and space the MIPAS-E data and the correlative data did generally agree within the combined error bars. Comparisons to ground-based observations also seem to show a good agreement with MIPAS-E data, provided that the columns are calculated properly based on the pressure scale and the different vertical resolutions of ground-based and satellite measurements are taken into account. This statement is based on a few individual stations so far and needs still to be proven for all stations. High biases in MIPAS HNO3 in the order of 10 % are explained by
a line intensity scaling factor that has been used to the MIPAS spectroscopic data base used in v4.61, of which not all validation experimenters have been aware of.
Validation activities need to be continued with the inclusion of further validation cases (especially for the year 2003). Mismatches have to be corrected with the help of forward/backward trajectory matches to increase the number of coincidences. If necessary, different vertical resolutions of the sensors should also be considered during the validation processes as well as more refined error estimates for the calculation of combined errors.
6. ACKNOWLEDGMENTS
The study presented here is based on active contributions by a large number of technicians and researchers working together with the authors in their research institutions. Financial support by ESA, EU and national funding agencies is gratefully acknowledged. We thank P. Wursteisen as ESA representative for active support at the campaign sites, the CNES balloon launching team and the SSC Esrange people for excellent balloon operations and the Free University of Berlin (K. Grunow and B. Naujokat) for meteorological support and trajectory calculations. Special thanks are due and to all data providers of FTIR g-b measurements in AOID126 and to T. Coosemans (BIRA) for making the comparisons with MIPAS-E data. The data providers are T. Blumenstock(2), A. Griesfeller(2), P. Demoulin(5), H.
Fast(3), D. Griffith(4) , N. Jones(4), E. Mahieu(5), J.
Mellqvist(6), R. L. Mittermeier(3), J. Notholt(11), C.
Rinsland(8), T. Warneke(7), D. Smale(9), A.
Strandberg(6), R. Sussmann(10), S. Wood(9) of the (2)Forschungszentrum Karlsruhe, IMK, Germany; (3)Meteorological Service of Canada (MSC),
Downsview, Ontario, Canada; (4)University of
Wollongong, New South Wales, Australia; (5)Institut
d'Astrophysique et de Géophysique, Liège, Belgium;
(6)Chalmers University of Technology, Radio & Space
Science, Göteborg, Sweden; (7)Alfred Wegener
Institute for Polar and Marine Research (AWI), Potsdam, Germany; (8)NASA Langley Research Center,
Hampton, VA, USA; (9)National Institute for Water and
Air Research (NIWA), New-Zealand;
(10)Forschungszentrum Karlsruhe, IFU, Germany; (11)Institute of Environmental Physics, University of
Bremen, FB1,Germany.
7. REFERENCES
1. Gille, J.C., S.T. Massie, and W.G. Mankin, Evaluation of the UARS data, Preface to the special issue of J. Geophys. Res., 101, 9539-9540, 1996. 2. Friedl-Vallon, F., G. Maucher, A. Kleinert, A. Lengel, C. Keim, H. Oelhaf, H. Fischer, M. Seefeldner,
and O. Trieschmann, Design and characterization of the balloon-borne Michelson Interferometer for Passive Atmospheric Sounding, Appl. Opt., 43, 3335-3355, 2004.
3. G. Moreau, et al., A new balloon-borne instrument for in situ measurements of stratospheric trace species using infrared laser diodes, ESA SP-397, pp. 421-426, 1997.
4. C. Camy-Peyret, Jeseck P., Hawat T., Durry G., Payan S., Berube G., Rochette L. and Huguenin D., The LPMA balloon-borne FTIR spectrometer for remote sensing of atmospheric constituents, ESA
publications SP-370, 323-328, 1995.
5. Strong, K. et al., The MANTRA 2002 Balloon Flight from Vanscoy, Canada. Proceedings of the ENVISAT Validation Workshop Frascati, Italy, 9-13 December, 2002. ESA Special Publication SP-531, August 2003. 6. Schlager, H., et al., Observations of denitrification and renitrification in the 2002-2003 Arctic winter stratosphere, in preparation for Atmos. Chem. Phys., 2004.
7. Keim C., E. Blom, P. von der Gathen, T. Gulde, M. Höpfner, G.Y. Liu, A. Oulanovski, C. Piesch, F. Ravegnani, C. Sartorius, H. Schlager, C. M. Volk) et al., Validation of MIPAS-ENVISAT by correlative measurements of MIPAS-STR, This issue. 8. Cortesi U., Bianchini G., Palchetti L., Castelli E., Dinelli B.M., Redaelli G., Results of mid-latitude MIPAS validation measurements obtained by the SAFIRE-A airborne spectrometer, this issue.
9. This work has been carried out as part of the commitment in AO ID 126 ‘Validation of ENVISAT-1 level-2 products related to lower atmosphere O3 and
NOy chemistry by an FTIR quasi-global network’,
coordinated by M. De Maziere at the Belgian Institute for Space Aeronomoy (BIRA).
10. S. Wood, private communication, NIWA, New Zealand, 2004.
11. T. Blumenstock, S. Mikuteit, A. Griesfeller, F. Hase, G. Kopp, I. Kramer, M. Schneider, H. Fischer, M. Gil, J.R. Moreta, M. Navarro Coma, U. Raffalski, E. Cuevas, B. Dix, G. Schwarz: Validation of MIPAS and SCIAMACHY data by ground-based spectroscopy at Kiruna, Sweden, and Izaña, Tenerife Island (AOID-191), this issue, 2004.
12. C. Vigouroux et al., poster #60078 to be presented at COSPAR 2004.
13. Collaboration between BIRA and the University of Liège (E. Mahieu).
14. Blumenstock, T., J. P. Burrows, T. von Clarmann, E. Cuevas, H. Fischer, A. Griesfeller, F. Hase, Y. Kondo, U. Raffalski, C. von Savigny, M. Schneider, T. Steck: Validation of O3 and HNO3 profiles from
ENVISAT with ground-based FTIR measurement at Kiruna (Sweden) and Izaña (Tenereife), Poster (Proceedings p. ), Quadr. Ozone Symposium, Kos, 2004.