HAL Id: hal-00978094
https://hal.archives-ouvertes.fr/hal-00978094
Submitted on 13 Jan 2021HAL is a multi-disciplinary open access archive for the deposit and dissemination of sci-entific research documents, whether they are pub-lished or not. The documents may come from teaching and research institutions in France or abroad, or from public or private research centers.
L’archive ouverte pluridisciplinaire HAL, est destinée au dépôt et à la diffusion de documents scientifiques de niveau recherche, publiés ou non, émanant des établissements d’enseignement et de recherche français ou étrangers, des laboratoires publics ou privés.
Spatio-temporal variability of dust aerosols over the
Sistan region in Iran based on satellite observations
A. Rashki, D. G. Kaskaoutis, P. G. Eriksson, C. J. de W. Rautenbach, Cyrille
Flamant, Farhad Abdi Vishkaee
To cite this version:
A. Rashki, D. G. Kaskaoutis, P. G. Eriksson, C. J. de W. Rautenbach, Cyrille Flamant, et al.. Spatio-temporal variability of dust aerosols over the Sistan region in Iran based on satellite obser-vations. Natural Hazards, Springer Verlag, 2014, 71 (1), pp.563-585. �10.1007/s11069-013-0927-0�. �hal-00978094�
1
Spatio-temporal variability of dust aerosols over the Sistan regionin Iran
based on satellite observations
A. Rashki1, D.G. Kaskaoutis2, P.G. Eriksson1
, C.J. de W. Rautenbach3, C. Flamant4, F. Abdi Vishkaee 4
1
Department of Geology, Faculty of Natural and Agricultural Sciences, University of Pretoria, Pretoria 0002, South Africa
2
Department of Physics, School of Natural Sciences, Shiv Nadar University, Dadri – 203207, India
3
Department of Geography, Geoinformatics and Meteorology, Faculty of Natural and Agricultural Sciences, University of Pretoria, Pretoria 0002, South Africa 3
Laboratoire Atmosphères, Mileux, Observations Spatiales, CNRS and Université Pierre et Marie Curie, Paris, France
Abstract
Satellite remote sensing provides important observational constraints for monitoring dust life cycle and improving the understanding of its effects on local to global scales. The present work analyses the dust-aerosol patterns over the arid environment of the Sistan region-in southeastern Iran, by means of multiple satellite platforms aiming to reveal the spatio-temporal distribution and trends. The dataset includes records of Aerosol Index (AI) from Total Ozone Mapping Spectrometer (TOMS) (1978–2001) and 6-year AI records from the Ozone Monitoring Instrument (OMI) aboard Aura. Moreover, the aerosol optical depth (AOD) is analyzed through 11-year records from Multi-angle Imaging Spectro-Radiometer (MISR) aboard Terra (2000-2010) and from Moderate Resolution Imaging Spectroradiometer (MODIS) onboard Terra (2000-2007) and Aqua (2002-2011). The main focus is to determine similarities and differences in dust variability over southwest Asia, in general, and the Sistan region, in particular. The results show a marked seasonal cycle with high aerosol loading during summer and lower in winter, while MISR, MODIS and TOMS/OMI observations agree in both terms of monthly and seasonally mean spatial and temporal patterns. The higher aerosol concentrations during summer are interpreted as a result of the combined effect of the seasonal drying of the Hamoun lakes and the strong northerly Levar winds favoring dust erosion from the alluvial deposits in Sistan . After prolonged drought period, the dust-aerosol load over the area has increased in the beginning of the 2000s and decreased after 2004,
2
thereby leading to an overall declining trend during the last decade. Such a trend is absent during the winter period when dust emission over the region is minimal.
Keywords: Aerosol variability; remote sensing; dust; Sistan; Hamoun lakes
1. Introduction
The physical, optical and radiative properties of dust aerosols are of great importance over the globe, especially over the desert areas and downwind regions, due to attenuation of solar radiation, mixing processes in the atmosphere, interaction between dust aerosols and clouds and thermal heating of the troposphere (e.g. Rosenfeld et al., 2001; Gautam et al., 2009a; Prasad et al., 2009; Anton et al., 2011; Christopher et al., 2011; Valenzuela et al., 2012). Thus, it is necessary to analyze the seasonality of dust aerosols, particularly over regions affected by frequent and intense dust storms, which affect solar radiation, ecosystems and human health (e.g. Singh et al., 2008; Gupta et al., 2008; Nastos et al., 2010; Maghrabi et al., 2011; Samoli et al., 2011). Various aerosol types have distinct effects on the sign and magnitude of aerosol radiative forcing (Satheesh and Krishnamoorthy, 2005), while the presence of UV-absorbing dust aerosols over highly-reflected desert surfaces may change the sign of the forcing from negative to positive (Hatzianastassiou et al., 2005; Patadia et al., 2009). Furthermore, changes in the aerosol vertical structure due to formation of distinct aerosol layers aloft, mainly consisting of dust plumes, may significantly alter the radiative forcing into the atmosphere (Guan et al., 2010; Lemaître et al., 2010).
Satellite monitoring of dust aerosols has been increasingly available over the globe via observations of the Total Ozone Mapping Spectrometer (TOMS) and Ozone Monitoring Instrument (OMI) (e.g. Hsu et al., 1999; Engelstaedter et al., 2006; Kaskaoutis et al., 2010), Moderate Resolution Imaging Spectroradiometer (MODIS) Deep Blue retrievals (e.g. Hsu et al., 2004; Gautam et al., 2011), Multi-angle Imaging Spectro-Radiometer (MISR) (Kalashnikova et al., 2005; Kahn et al., 2008) and Spinning Enhanced Visible and Infra-Red Imager (SEVIRI) images (Haywood et al., 2011). Ground-based measurements do not have the necessary coverage to analyze regional or global distributions of dust aerosols. Therefore, despite the larger uncertainties compared to ground-based observations, especially over the bright arid and desert areas, satellite remote sensing has been extensively used to analyze the spatio-temporal and vertical distribution of dust aerosols (Deepshikha et al., 2005; Liu et al., 2008; Israelevich et al., 2012; Kaskaoutis et al., 2012; Abdi Vishkaee et al., 2012).
3
Although dust has been thoroughly investigated over the globe via systematic ground-based measurements, experimental campaigns, satellite remote sensing and modeling simulations, there are only a few studies concerned with dust aerosols over the Sistan region in southeast Iran, which is a major dust source in southwest Asia (e.g. Middleton, 1986; Prospero et al., 2002). In this region, frequent and strong dust storms are observed in summer, related to the seasonally strong ―Levar‖ (or 120 days) winds blowing between the Hindu Kush mountains in Afghanistan and the mountain ranges flanking the eastern border of Iran. Miri et al. (2007) reported that during dust storms in Sistan respiratory patients increased significantly, especially those affected by chronic obstructive pulmonary diseases and asthma. The percentage of these diseases increases in summer (June-July) due to frequency and intensity of dust storms. More recently, Rashki et al. (2012) studied the sediment loading and particulate matter (PM) concentrations at the Hamoun Basin (north edge of Sistan), Rashki et al. (2013a) analyzed the PM concentrations and Air Quality Index (AQI) over Zahedan, south Sistan, while Rashki et al. (2013b) and Engelbrecht et al. (2009) analyzed the chemical composition of dust over Sistan and surrounding regions in Afghanistan, respectively. However, the above-mentioned studies are of a limited time period and a long-term dust aerosol variability either from ground-based measurements or satellite remote sensing still is lacking.
This study focuses on dust aerosol monitoring over the arid environment of Sistan, southeast Iran, and surrounding areas and aims to present the inter-annual, seasonal and monthly variations by means of multiple satellite observations. The daily TOMS and OMI Aerosol Index (AI) values as well aerosol optical depth (AOD) retrievals from MISR and MODIS Deep Blue algorithm are used for this purpose. The multiple satellite sensors, which follow different product retrieval techniques and calibration procedures, provide a synergistic approach to complement the present analysis.
2. Study region
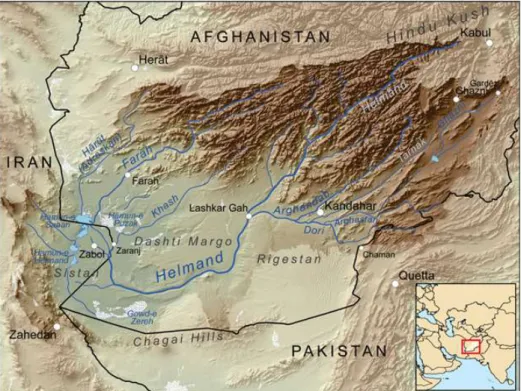
The Sistan region (30°5’ N - 31°28’ N and 61°15’ E - 61°50’ E) is located close to the Iranian borders with Pakistan and Afghanistan, in the south-eastern part of Iran, wedged between the Hindu Kush mountains in Afghanistan and the mountain ranges flanking the eastern border of Iran. The Helmand and its tributary streams drain the southern Hindu Kush Mountains and flow into a waterless basin of gravel plains and sandy tracts before
4
terminating in Sistan (Fig. 1). Sistan covers an area of approximately 15197 km2 with a population of ~400,000, of which half work in agricultural and domesticated fields. It is a large and remote desert basin, extremely arid and known for its windstorms, extreme floods and droughts (Moghadamnia et al., 2009). Hamoun lakes complex is situated in a topographic low basin at the northern edge of Sistan covering nearly 4000 km2They are shallow with average depth of about three meters and extremely vulnerable to the climatic and meteorological conditions over the area. Sistan basin has recently experienced an unusually long (~10-year) drought since 1999 (United Nations Environment Programme, 2006; Sharifikia, 2013: Rashki et al., 2013c) resulting in drying of the Hamoun lakes, altering the land’s saline content and disturbing its soil fertility, while some places became barren. By 2001, the Hamoun lakes had vanished leaving a fine layer of sediment that is easily lifted by the wind and, therefore, making the basin one of the most active sources of dust in southwest Asia (Middleton, 1986; Goudie and Middleton, 2006).
Figure 1: Topographic map of Sistan region and Hamoun Basin. The bold color in the map defines the Helmand drainage basin that fed Hamoun lakes complex. [source: http://en.wikipedia.org/wiki/Sistan_Basin]
5 3. Data
3.1 Satellite dataset
The dataset used in this study includes a synergy of six satellite-derived aerosol products (Table 1). More specifically, it includes AI values from Nimbus 7 (N7T), TOMS-Earth Probe (EP) and OMI as well as AOD values from MISR, Terra and Aqua MODIS via Deep Blue algorithm over bright surfaces.
Table 1: Datasets used in the present study.
Satellite sensor Period Product Spectral resolution
Spectral band
TOMS Nimbus-7 11/1978- 4/1992 AI Daily level-2
1.25° x 1° UV
Earth Probe 8/1997- 12/2001 AI Daily level-2
1.25° x 1° UV
OMI 01/2005- 12/2011 AI Daily level-2
0.25° x 0.25° UV
MISR Terra 3/2000- 12/2010 AOD Daily level-3 0.5o x 0.5° 558 nm Aqua-MODIS
(Deep Blue)
08/2002- 12/2011 AOD Daily level-3 1o x 1o 550 nm
Terra-MODIS (Deep Blue)
03/2000- 12/2007 AOD Daily level-3 1ox1o 550 nm
3.1.1 TOMS/OMI Aerosol Index
The AI is a measure of the wavelength-dependent change in Rayleigh-scattered irradiance from aerosol absorption and is especially suitable for detecting the dust-source regions and the presence of UV-absorbing aerosols (desert dust, soot, volcanic ash) above high reflecting surfaces, such as deserts and snow/ice areas, because of their strong dependence on the imaginary part of the refractive index in the UV (Prospero et al., 2002; De Graaf et al., 2005; Engelstaedter et al., 2006). The main disadvantage in the AI use is its dependence on altitude, since elevated absorbing aerosol layers present larger values (Hsu et al., 1999). Thus, AI cannot simply be used for comparison of the relative strengths of dust sources in different climate and meteorological regimes. Nonetheless, over specific regions and in specific seasons, the AI should provide a rough measure of relative dust concentrations and, hence, relative source strength (Washington et al., 2003).
The TOMS and OMI AI values used in this study correspond to the latest version 8. The dataset is composed of an ensemble of daily records from three satellites, namely Nimbus 7
6
(N7T, 1978-1993), Earth Probe (EP, 1996-2001) and OMI (2005-2011) (Table 1). The eriods 2002-2005 was removed from the AI records, because EP presents a calibration drift produced by sensor degradation affecting the retrievals (Kiss et al. 2007; Bollasina et al., 2008). Errors, uncertainties and validation for detecting aerosols from TOMS and OMI are discussed elsewhere (Torres et al., 1998; 2002; Currier et al., 2008). The entire compilation of TOMS-OMI AI was obtained from the Giovanni website (http://giovanni.gsfc.nasa.gov/) covering the southwest Asia bounded from 20-34oN and 52-72oE in a 1° x 1.25° spatial resolution for TOMS and 0.25o x 0.25o for OMI (Level-2G, Version 003).
3.1.2 MODIS Aerosol Optical Depth
The MODIS sensors onboard NASA’s Terra (launched in December 1999) and Aqua (launched in May 2002) satellites have been acquiring to retrieve global aerosols on nearly daily basis via three independent algorithms operational at spectral bands between 0.47 and 2.130 µm (Remer et al. 2005; Levy et al., 2007). The first two algorithms are based on the ―dark target" approach to retrieve AOD over ocean and non-bright land surfaces (Kaufman et al. 1997; Tanre et al. 1997)while the latter, called "Deep Blue", is able to retrieve AOD over bright land surfaces (Hsu et al., 2004, 2006). Whereas TOMS-OMI AI is only capable of retrieving absorbing aerosols, MODIS AOD measurements are sensitive to both absorbing and non-absorbing aerosols. The Deep Blue algorithm employs radiances in the blue spectrum, where the surface reflectance is very low, able to detect the presence of aerosols by an increase of total reflectance and enhanced spectral contrast (Ginoux et al., 2012; Karimi et al., 2012). Deep Blue AOD550 retrievals have been compared to those obtained from AERONET over arid-desert locations exhibiting a satisfactory agreement for the majority of the sites (Ginoux et al., 2012). In the current work Deep Blue Aqua and Terra-MODIS AOD values at 550 nm (MYD08 and MOD08 version 5.1, respectively) were obtained from Giovanni website (http://giovanni.gsfc.nasa.gov/) over Sistan and southwest Asia with spatial resolution 1ox1o covering the periods 2002-2011 and 2000-2007, respectively.
3.1.3 MISR Aerosol Optical Depth (shorten)
MISR was launched aboard NASA’s Terra satellite on December 18, 1999. The instrument contains 9 push broom cameras pointed at nadir and along-track view angles of 70.5º, 60º,
7
46.1º, 26.1º forward and backward of nadir, with four spectral bands Due to 9 cameras MISR is able to obtain AOD values over desert areas, but due to small swath (~360 km) it needs about 7-9 days for a global coverage. This lengthy cycle limits the use of MISR for high temporal analysis, but the high accuracy of the retrievals over bright desert areas provides the necessary additional synergistic information to supplement AOD values for the present study. MISR provides AOD values at 17.6 x 17.6 km2 spatial resolution that have been extensively validated over the globe by comparison with MODIS and AERONET (Kahn et al. 2009; 2010; Diner et al., 2010); the uncertainty associated with MISR-derived AOD was found to be about 10 to 20%. Terra-MISR AOD555 data was retrieved from Giovanni website at 0.5° x 0.5° spatial resolution over southwest Asia from March 2000 to December 2010 in order to support the analysis.
3.2 Re-analysis data
The monthly evolution of the wind speed and direction is a critical parameter for monitoring the dust emission, accumulation and transport of aerosols over southwest Asia and is analyzed using 6-hourly Interim re-analyses of European Centre for Medium-range Weather Forecasts (ECMWF) horizontal surface winds during the period 2005 and 2011. The resolution of re-analyses is about 0.75° (Dee et al., 2011) and covers a similar area to the satellite retrievals. The ECMWF wind re-analysis helps in understanding the aerosol transport over southwest Asia.
4. Results and discussion
4.1. Wind field over southwest Asia
The monthly-mean wind field (speed and direction) over the study region is shown in Fig. 2 during the period 2005-2011. Very contrasting wind speed and direction depending on season is observed, strongly controlled by the regional monsoon system. More specifically, during the period October to April, the wind speed over Sistan is relatively low (mostly below 4 ms -1
), while over the northern Arabian Sea winds of higher intensity are present, being mostly northeasterly during November to January and westerly from February to April. From May to September, strong southwesterly winds across the Arabian Sea, which are associated with the
8
Indian monsoon, carry dust aerosols from Arabian Peninsula over Pakistan and India (Prospero et al., 2002). At the same time, strong northerly winds are observed over . The seasonal (summer; June - September) Levar wind, between the Hindu Kush mountains and the mountain ranges flanking the eastern border of Iran, is the main meteorological phenomenon over Sistan that affects the local weather, aerosol loading, visibility and human health (Rashki et al., 2012; 2013c). South of Zabol, the wind veers eastward, due to the orography of the area and the influence of the contrasting system over northern Arabian Sea. This wind direction is the controlling factor for the ―U-shaped‖ form of the dust outbreaks originated from Sistan (Alam et al., 2011; Rashki et al., 2012 and 2013b). Note also that the Levar winds and the southwesterly monsoon flow over northern Arabian Sea merge over the coastal Makran Mountains in Pakistan, thereby leading to a mixture of dust aerosols (from Sistan and the Arabian peninsula) in that region. Thus, the wind field over the area plays a vital role in the dust-aerosol cycle (uplift, vertical extent, transport, deposition) and any anomalies in wind field may cause accumulation or re-distribution of aerosols over specific regions. It should be noted that the wind field at higher levels (850, 700 hPa) follows similar pattern (not shown).
9
Figure 2: Monthly-mean wind field over southwest Asia during the period 2005-2011 as
obtained from ECMWF re-analysis
4.2. Multi-year variation of aerosols over Sistan
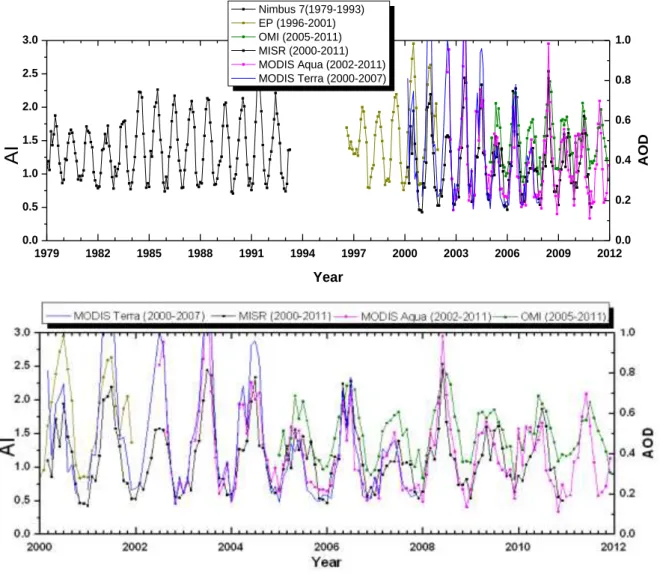
In this section, we analyze and compare the multi-year fluctuation of the aerosol loading (AOD and AI) over the Sistan region as obtained from satellite observations (Fig. 3). Furthermore, temporal trends in aerosol loading over Sistan are examined using linear regression analysis. The results show considerable inter-annual and intra- annual variability for all aerosol products, revealing a pronounced season-dependent aerosol load over Sistan. Dust outbreaks originating from the Hamoun Basin during summer lead to monthly averaged AI and AOD values as high as ~2.0 and ~0.7, respectively, which are considered very high and characteristic of turbid desert environments (Kim et al., 2011; Marey et al., 2011). Fig. 3
10
shows enhanced AI values from Nimbus 7 after 1984 compared to the previous years, while both AOD and AI values are very high during the early 2000s. The large increase in AOD during 2000-2003 is mainly defined at the summer maximum values, while the winter ones are nearly similar for all years (Rashki et al., 2013c).
1979 1982 1985 1988 1991 1994 1997 2000 2003 2006 2009 2012 0.0 0.5 1.0 1.5 2.0 2.5 3.0 Nimbus 7(1979-1993) EP (1996-2001) OMI (2005-2011) MISR (2000-2011) MODIS Aqua (2002-2011) MODIS Terra (2000-2007) Year AI 0.0 0.2 0.4 0.6 0.8 1.0 AOD
Figure 3: Time series of AOD and AI (monthly mean values) from multiple satellite sensors
over Sistan region (30-31º N, 61-62º E). The lower panel emphasizes the 2000s.
The AI and AOD data series after 2000 exhibit a similar monthly and annual variation for all sensors. The analysis revealed a significant correlation between Terra and Aqua MODIS AODs (R2=0.96), as well as between MISR and Terra-MODIS (R2=0.79) and MISR vs Aqua-MODIS (R2=0.79). This suggests that the satellite sensors reveal similar temporal variations and trends in terms of mean aerosol load over Sistan. The correlation coefficients from the comparison between the monthly values of AOD and AI from the different sensors
11
are summarized in Table 2. The results show that all the correlations are statistically significant at 95% confidence level.
Table 2: Coefficient of determination (R2) from the correlations between the monthly values of AOD and AI from the multiple satellite sensors over Sistan. [N: number of data; a.: lack of common period for the correlations; **: The correlation is significant at the 0.05 level]
Earth Probe
OMI MISR Terra MODIS
Aqua MODIS Earth Probe Correlation
N 1 65 OMI Correlation N a. 0 1 84 MISR Correlation N 0.839** 22 0.819** 72 1 130
Terra MODIS Correlation N 0.654** 22 0.783** 36 0.791** 94 1 94
Aqua MODIS Correlation N a. 0 0.763** 84 0.790** 102 0.963** 66 1 114
The present work is the very first that examines the aerosol variations and trends over Sistan region by means of multiple satellite platforms in the absence of long-term ground-based dataset. Previous studies focusing on this over southwest Asia were conducted by Yoon et al. (2011) for selected AERONET sites in the Arabian Peninsula and the Middle East, by Dey and di Girolamo (2011) and Kaskaoutis et al. (2011) over Indian sub-continent and adjoining oceanic region using MISR and MODIS data, respectively during the last decade. These studies agree to a general increase in aerosol loading over south Asia, which is mainly attributed to significant increase in anthropogenic emissions. In contrast, aerosols over Sistan are mainly composed of soil and dust particles, whereas the anthropogenic component is rather low due to absence of major industries and urban centers. Note also that southeastern Iran, southern Afghanistan and western Pakistan are very sparsely populated areas. Thus, the variability in aerosol emissions and atmospheric lifetime is strongly influenced by natural phenomena (dryness of the Hamoun lakes, land use land cover changes, soil moisture, frequency and intensity of dust storms) and meteorological conditions, such as variability in precipitation, wind speed and direction (Rashki et al., 2013c).
The AI and AOD reveal different trends depending on the time period and sensor. More specifically, Nimbus 7 and Earth Probe AI values show an increasing trend for the periods 1979-1992 and 1997-2001, respectively, which is statistically significant for Earth Probe (+29. 7%). It should be noted that the % variations in AI and AOD have been calculated from
12
the regression analysis using the monthly mean values. In contrast, OMI AI, MISR AOD, Terra-MODIS AOD and Aqua-MODIS AOD reveal a declining trend over Sistan during the 2000s corresponding to -1.7%, -5.8%, -81.0% and -34.3%, respectively, while the trends obtained from MODIS sensors are considered statistically significant at 95% confidence level. These trends are strongly controlled by the large aerosol loading during early 2000s following the extreme droughts over the region causing the dryness of the Hamoun lakes and the increase in dust erosion (Rashki et al., 2013c). The periodic dryness of the Hamoun lakes transforms the basin into a major dust-storm region in south Asia, similar to that observed in Bodélé depression in Chad (Engelstaedter et al., 2006) and in lake Eyre, Australia (Baddock et al., 2009).
Several previous studies quoted by Engelstaedter et al. (2006) have pointed out an association between dust erosion and intensity in dust storms with rainfall amount over the desert areas. Such an association was also examined over Sistan by using the rainfall data from the Zabol
meteorological station during the period 1979-2011
(http://www.irimo.ir/english/province/systan.asp). In general, the results reveal a negativeanti- correlation between aerosol loading and precipitation (Fig. 4), since the periods with enhanced precipitation are associated with lower AOD and AI and vice versa. More specifically, during 1978 – 1982 higher precipitation was associated with lower AI values compared to the following years when AI was relatively high between 1985-1990 due to decrease in precipitation. The most characteristic period is after 1999 when the lowest precipitation amount and the highest AOD and AI values are shown. Especially in 2001, the accumulated rainfall over Zabol was 11 mm against the annual average of 55 mm. This resulted in frequent and intense dust storms in late spring and summer seasons of 2001, increasing the EP-AI to ~2.6, the MISR-AOD to 0.6-0.7 and the Terra-MODIS AOD to above 1.0 in June-July of 2001. On the other hand, the abnormally high precipitation (~150 mm) in 2005 had a direct signal in the low AOD values during this year (Fig. 4). This shows precipitation, soil moisture and coverage of water surface in the Hamoun lakes (Rashki et al., 2013c)However, the water surface in Hamoun lakes depends on several other factors including temperature, number of rainy days, rainfall and snowmelt in Afghanistan mountains from where rivers and tributes bring water to Hamoun basin /lakes (Sharifikia, 2013). In the recent years, due to saving of water in two reservoir dams (Arghandab dam and Kajaki dam), the volume of water to Hamoun lakes has been significantly reduced, while the
13
regression analysis showed a pronounced declining trend in precipitation of ~1 mm/yr or -58.4% during the period 1979-2011 over Zabol.
Figure 4: Inter-annual variability of the annual mean AI and AOD values over Sistan along
with accumulated precipitation from the Zabol meteorological station.
The intra-annual variability of AI and AOD is shown in a common diagram in Fig. 5. All sensors agree to a clear-defined annual pattern of summer maximum and winter minimum values, similar to those found over sites in the Arabian Peninsula and the Persian Gulf (Smirnov et al., 2002; Kambezidis and Kaskaoutis 2008; Kim et al., 2011), due to more frequent and intense dust events, longer aerosol lifetime and absence of precipitation during the summer season. The AODs from MISR and Aqua MODIS seem to be similar during the months September to February, while MISR underestimates MODIS during the rest of the year. On the other hand, Terra-MODIS exhibits significantly higher AODs from May to August due to the extreme AODs in these months during 2001 (Fig. 3). For the same reason, the EP-AI values are much higher than those of Nimbus 7 and OMI during the summer months.
14
Jan Feb Mar Apr May Jan July Aug Sep Oct Nov Dec 0.8 1.2 1.6 2.0 2.4 2.8 Nimbus 7(1979-1993) OMI(2005-2011) EP( 1996-2001) MISR(2000-2010) MODIS Aqua (2002-2011) MODIS Terra (2000-2007) Month AI 0.0 0.2 0.4 0.6 0.8 1.0 AOD
Figure 5: Annual mean variation of AOD and AI for different satellite sensors and time
periods over Sistan region (30-31º N, 61-62º E).
The mean, median and the distribution of AI and AOD values from the different sensors are presented in a box and whisker chart (Fig. 6). Concerning AI, Earth Probe exhibits a higher mean value and standard deviation (1.55±0.54) compared to Nimbus 7 (1.36±0.44) and OMI (1.51±0.38) due to AI peaks in 2001. These AI values are lower than those reported over Sahara (Alpert et al., 2004; Engelstaedter et al., 2006), but similar to those found over the Thar desert (Gautam et al., 2009b). On the other hand, MISR AOD (0.38±0.16) is similar to that of Aqua MODIS (0.39±0.20) despite the different procedures and algorithms used for the aerosol retrievals over land from the two sensors (Hsu et al., 2006; Kahn et al., 2010). However, Terra MODIS exhibits higher AOD over Sistan (0.47±0.32) due to the enhanced 2001 values. The higher mean value is also influenced by the shorter time period of Terra-MODIS Deep Blue retrievals (2000-2007) compared to the other sensors.
15 0.0 0.5 1.0 1.5 2.0 2.5 3.0 3.5
A
O
D
, A
I
Satellite sensor Nimbus 7 EP OMI MISR Terra MODIS Aqua MODISFigure 6: Box charts view of the AI and AOD for different satellite sensors over Sistan
region. Each box contains 50% of the values (25% to 75%). The horizontal line is the median and the smaller squares the mean value. The standard deviations are defined by the vertical bars, while 1% and 99% of the data is donated by the symbol ; the maximum and minimum values are defined by the symbol - .
Since the aerosol loading exhibits a pronounced seasonal variability over Sistan (Fig. 5), the inter-annual variability of AI and AOD was also analyzed on a seasonal basis (Fig. 7). Winter exhibits the lowest values for both AI and AOD without any significant yearly variation, except the declining trend observed by the EP-AI. In spring, the AI and AOD values start to increase, with the Nimbus 7 AI showing an increasing trend. The AOD values during the 2000s exhibit a rather neutral or even slight decreasing trend for all sensors indicating a decrease in dust-aerosol loading over Sistan, as also found over northern India from MISR (Dey and di Girolamo, 2011) and MODIS (Kaskaoutis et al., 2011) observations. Both AOD and AI values increase further in summer, when the multi-year variability and trends are similar to those found in spring, although more intense, i.e. increasing for Nimbus 7 and EP and decreasing for the other sensors. In autumn, the AI and AOD values have been significantly reduced and the pattern seems to be similar to that observed in winter.
16 1.2 1.6 2.0 2.4 2.8 Nimbus 7 EP OMI MODIS Aqua MODIS Terra MISR
A I
0.0 0.2 0.4 0.6 0.8 1.0 1.2 1.4 1.2 1.6 2.0 2.4 2.8 Spring Summer Autumn Winter 0.0 0.2 0.4 0.6 0.8 1.0 1.2 1.4 1.2 1.6 2.0 2.4 2.8 0.0 0.2 0.4 0.6 0.8 1.0 1.2 1.4 1980 1985 1990 1995 2000 2005 2010 0.8 1.2 1.6 2.0 2.4 2.8 0.0 0.2 0.4 0.6 0.8 1.0 1.2 1.4A O D
Figure 7: Multi-year variation of the seasonal AI and AOD values from different sensors
over Sistan region.
4.3. Spatial distribution of aerosols over southwest Asia and Sistan
In this section the spatial distribution of aerosols over southwest Asia, in general, and the Sistan region, in particular, is analyzed on seasonal basis. Figure 8 summarizes the spatial distribution maps of the seasonally-averaged values of AI from Nimbus 7 and OMI and AOD
17
from MISR and Aqua MODIS. Both variables (AI and AOD) present a pronounced seasonal variability over southwest Asia with winter minima and summer maxima similar to that found for the Sistan region (Figs. 5, 7). AI exhibits similar seasonal spatial distribution for Nimbus 7 and OMI over the whole area. More specifically, during spring, the hot-spot AI areas are defined in the Sistan region, eastern Pakistan and in the Arabian Peninsula without influencing significantly the Arabian Sea. During summer, the AI values are higher with the most important increases defined over the major dust source regions (Hamoun basin/lakes, eastern Pakistan and southeastern Arabian Peninsula). In this season, a significant amount of dust originating from the Arabian Peninsula is transported by the westerlies over the Arabian Sea (Fig. 2). By the end of summer the dust activity is significantly reduced as well as the dust-aerosol lifetime due to increased precipitation mainly over the oceanic areas. However, over land, some hot-spot areas of enhanced AI still exist (autumn and winter), such as the Hamoun basin/lakes,southern Afghanistan and some areas in the Arabian Peninsula. The increased AI observed in autumn over northeastern Pakistan is rather associated with biomass burning aerosols, and not with dust, since this is the season of crop-residue burning over Punjab (Badarinath et al., 2009; Sharma et al., 2010).
18
Figure 8: Seasonal maps of the spatial distribution of AI (Nimbus 7 and OMI) and AOD
(MISR and Aqua MODIS) values over southwest Asia.
The results show that, despite the general similarity, Aqua MODIS overestimates the AOD compared to MISR at least over hot-spot areas and dust source regions, i.e. Sistan and eastern Pakistan in spring and summer. This inconsistency is mainly attributed to the different algorithm and procedures used for aerosol retrievals from the two sensors as well as to the fact that MODIS provides nearly daily observations, while MISR one per week, approximately. Thus, some intense dust stormsmay not be detected by MISR leading to the lower AODs over the dust source regions and downwind areas. Note also that the sampling period is different for the two sensors, i.e. 2000 to 2010 for MISR and 2002 to 2011 for Aqua-MODIS. In contrast, MISR exhibits higher values in autumn and winter over the arid regions of Arabian Peninsula, while both sensors highlight the enhanced AOD over northeastern Pakistan during late autumn and winter caused by smoke aerosols from crop residue burning.
19
The spatial distribution of monthly OMI-AI (Fig. 9) reveals a considerable annual variation in dust-aerosol loading. During the winter season (December to February) the AI is generally low, except for some hotspot regions with values of above 1.5, e.g. Hamoun basin/lakes. From March onwards high AI values start to spread over a wider area, covering southern Afghanistan, as well as the Arabian and Thar deserts. The AI continuously increases until May, with the highest increase to be detected over the Thar desert influencing the aerosol load in northern India (Dey and di Girolamo, 2010). During the summer period (June to August), the AI significantly increases over the northern Arabian Sea due to the large influence of dust coming mainly from Arabia and partly from Iran and Pakistan. This is also the period with the highest AI over Sistan (Fig. 5), which is closely associated with a reduction in visibility and stronger winds (Rashki et al., 2012). From September to November the high AI is limited over Sistan, as well as over some hotspots in Arabia and northeastern Pakistan.
20
Figure 9: Monthly-mean spatial distribution of OMI-AI over southwest Asia during the
period 2005 - 2011.
The monthly-mean spatial AOD distribution from MISR (2000-2010) over southwest Asia is shown in Fig. 10, which is similar to that observed for OMI-AI. The AOD values increase considerably in late spring and summer months, especially over Sistan, eastern Pakistan, Arabian Peninsula and Arabian Sea. The high AOD over the oceanic regions may be partly attributed to enhanced emissions of sea-salt aerosols due to intense southwesterlies in this
21
season. On the other hand, during winter high AOD values are observed only over Indus basin in Pakistan and in some areas over the Arabian Peninsula and Sistan. The former is mainly attributed to anthropogenic aerosols. Finally, the AOD spatial distribution from Aqua-MODIS deep blue algorithm over land is shown in Fig. 11. It should be noted that larger uncertainties in the AOD retrievals exist in the coastal areas due to ocean-land sub-pixel contamination. For this reason, there are pockets of very high AODs near to coastal areas, which seem to be unreal taking into account the neighboring pixels.
22
Figure 10: Monthly-mean spatial distribution of MISR AOD555 over southwest Asia during the period 2000 - 2010.
In synopsis, the spatial distribution of AI and AOD identified the Hamoun basin/lakes as one of the most active dust source regions in southwest Asia. In general, the dust sources, regardless of size or wind strength, are usually associated with topographic lows in close proximity to mountains and highlands with annual rainfall of less than 150 to 200 mm (Prospero et al., 2002; Engelstaedter et al., 2006). The topography and meteorological
23
conditions over Hamoun favor such conditions, since the region is associated with drainage features and extensive alluvial deposits. The accumulation of recent and ancient sediments in the area, often with salt that enhances the weathering of sediments, makes it a good source of fine-grained mineral particles (Middleton, 1986), which might be transported thousands of
kilometers downwind.
Figure 11: Monthly-mean spatial distribution of Aqua MODIS AOD550 over southwest Asia during the period 2002 - 2011.
24 4.4. Aerosol trends over southwest Asia and Sistan
Recently, the investigation of the aerosol trends via satellite remote sensing has received significant attention in order to substantiate the trends derived from AERONET. The large spatial coverage of the satellite sensors as well as the up to 10 years data series establish them as a useful tool for the monitoring of the aerosol trends from space (Mishchenko et al., 2009; Zhang and Reid, 2010; Kaskaoutis et al., 2011). However, southwest Asia has not been examined so far either from satellite remote sensing or ground-based measurements. The arid environments over the region are sparsely populated without any significant industrial and anthropogenic activity except in the Indus Basin in Pakistan. Thus, the spatial distribution and trends of aerosols are mainly affected by the variability in dust activity and sea-salt production in the coastal zone.
Figure 12 shows the % variation in AOD obtained from MISR during the period 2000-2010 on monthly basis. The % AOD variation was estimated via the formula ΔAOD=a*N/ ̅̅̅̅̅̅*100, where a is the slope of the linear regression considering the monthly mean values during 2000 - 2010 for each pixel, N the number of months, and ̅̅̅̅̅̅ the monthly-mean AOD for each pixel during 2000 - 2010. The results reveal a considerable spatial distribution of the % AOD variation, with pronounced seasonal and monthly differences. In general, the western part of the study area exhibits AOD increasing trends, while the eastern rather neutral or even negative AOD trends during the months February to October. This declining trend is especially pronounced over the Thar desert and northeastern part of the Arabian Sea during June to August as also found by Dey and Di Girolamo (2011) using MISR and Kaskaoutis et al. (2011) using MODIS observations. A recent study over northern India (Kaskaoutis et al., 2012) has shown that this declining trend is mainly attributed to the extremely large values in 2002 and 2003 (in the beginning of the observation period) favored by absence of precipitation and longer aerosol lifetime. This is strong evidence that the AOD trends over southwest Asia are mainly influenced by the dust annual variability, which in turn, is under the influence of the intensity and onset of the Indian monsoon system (Gautam et al., 2009a, b). On the other hand, an increasing AOD trend is observed over Sistan during the period December to March. However, it should be noted that the calculated trends are strongly influenced by the studied period and the intra-annual variation of AOD over a specific area. Thus, extreme high or low AODs in a specific month may influence the linear regression trend analysis. Furthermore, changes in the wind field over major dust-storm regions and downwind areas may lead to accumulation of aerosols
25
during specific months or years influencing the overall trend (Kishcha et al., 2012). Therefore, the results of Fig. 12 as well as those of Fig. 13 corresponding to Aqua MODIS must be considered rather qualitatively and not quantitatively.
Figure 12: Spatial distribution of the AOD555 % variation obtained from MISR over southwest Asia during the period 2000 - 2010.
26
Figure 13: Spatial distribution of the AOD550 % variation obtained from Aqua-MODIS (deep blue algorithm) over southwest Asia during the period 2002 - 2011.
The above statement is justified by comparing the results of the % AOD variation as obtained from the two sensors. In general, the western part of the study area exhibits variation AOD trends for both Aqua MODIS and MISR, while the eastern part declining trends. However, the AOD % variations as well as the spatial distributions exhibit large differences for the two sensors suggesting that the length of the study period plays a major role in the AOD trend analysis. Table 3 summarizes the results of the slope and AOD % variation values, as obtained from the linear regression analysis over Sistan for both MISR and Aqua-. Despite the large differences, both sensors exhibit a positive trend in AOD during winter, except in
27
December for Aqua-MODIS, and a negative trend during late spring and summer months (May to September). The decreasing AOD during these months may suggest a declining trend in the dust activity over Sistan during the 2000s. Such a decreasing trend on days with visibility below 2 km has been eported in Zabol (Rashki et al., 2012) during recent years. However, the significant differences revealed from the two sensors necessitate the use of ground-based sun photometer measurements for the validation of satellite retrievals over this arid environment.
Table 3: Slope values and % variations of AOD over Sistan as obtained from MISR and
Aqua-MODIS satellite sensors.
Slope MODIS Aqua (2002-2011) Slope MISR (2000-2010) AOD% MODIS Aqua (2002-2011) AOD% MISR (2000-2010) Jan 0.01657 0.00778 62.1 39.2 Feb 0.00265 0.00510 8.8 17.5 Mar -0.00538 0.00907 -10.7 29.3 Apr -0.01153 0.00474 -21.8 14.3 May -0.00352 -0.00698 -5.8 -15.0 Jun -0.01733 -0.00457 -24.3 -9.2 Jul -0.05167 -0.01469 -79.5 -25.8 Aug -0.05561 -0.00770 -118.2 -17.0 Sep -0.02358 -0.00809 -71.0 -21.3 Oct -0.00547 0.00414 -21.0 15.0 Nov 0.00121 0.00290 5.6 14.6 Dec -0.00443 0.00436 -15.9 24.6 Spring -0.00681 -0.00227 -12.8 -3.3 Summer -0.04154 -0.01016 -74.0 -21.4 Autumn -0.00928 0.00380 -28.8 18.1 Winter 0.00866 0.00575 18.3 27.1 Annual -0.01224 -0.00033 -24.3 -5.2 5. Conclusions
Satellite remote sensing provides essential observational constraints for monitoring of dust life cycle and spatio-temporal variability of dust aerosols over the Sistan region in southeastern Iran. In this respect, aerosol patterns and trends were analyzed by means of multiple satellite sensors focusing on determining similarities and differences in dust climatology over the Sistan region and surroundings. AI and AOD were used as proxies of the atmospheric aerosol load. The results showed a marked seasonal cycle with high aerosol loading during summer and lower in winter, while MISR, MODIS Deep Blue and OMI
28
observations agree both in terms of monthly and seasonally mean spatial and temporal aerosol patterns over the region. AI and AOD highlighted the Sistan region as major dust source in southwest Asia, which is active all year long with most intensity from May to September. The higher aerosol concentrations during summer are interpreted as a result of the strong northerly Levar winds and the drying of Hamoun lakes favoring the frequency and intensity of dust outbreaks. Prolonged drought conditions after 1999, which caused the desiccation of the Hamoun lakes, had as a consequence a significant increase of dust over Sistan. The extreme AOD and AI values in the beginning of 2000s seem to control the aerosol trends as obtained from TOMS, OMI, MODIS and MISR sensors. After this severe dusty period (~2000-2003), the dust AOD over Sistan exhibited a declining trend, which was detected from all satellite sensors despite the differences observed in the spatial distribution of the trends over southwest Asia.
Acknowledgments
Analyses and visualizations used in this study were produced with the Giovanni online data system, developed and maintained by the NASA GES DISC. We acknowledge the mission scientists and Principal Investigators who provided the data used in this research effort. Furthermore, the ECMWF re-analysis project for wind field over southwest Asia is gratefully acknowledged. We also thank the meteorologists and technical support teams that maintain and provide the precipitation data in the Zabol meteorological station.
References
Abdi Vishkaee, F., Flamant, C., Cuesta, J., Oolman, L., Flamant, P., Khalesifard, H.R. 2012. Dust transport over Iraq and northwest Iran associated with winter Shamal: A case
study, Journal of Geophysical Research, vol. 117, d03201, 14
pp.,doi:10.1029/2011jd016339
Alam, K., Qureshi, S., Blaschke, T., 2011. Monitoring Spatio-temporal aerosol patterns over Pakistan based on MODIS, TOMS and MISR satellite data and a HYSPLIT model. Atmos. Environ., 45, 4641-4651.
Alpert, P., Kishcha, P., Shtivelman, A., Krichak, S.O., Joseph, J.H., 2004. Vertical distribution of Saharan dust based on 2.5-year model predictions. Atmos. Res. 70, 109– 130.
29
Antón, M., Loyola, D., Clerbaux, C., L´opez, M., Vilaplana, J. M.., Ba˜n´on, M., Hadji-Lazaro, J., Valks, P., Hao, N., Zimmer,W., Coheur, P. F., Hurtmans, D., and Alados-Arboledas, L. 2011. Validation of the Metop-A total ozone data from GOME-2 and IASI using reference ground-based measurements at the Iberian Peninsula, Remote Sens. Environ., 115, 1380–1386,
Badarinath KVS, Kharol SK, Sharma AR. 2009. Long-range transport of aerosols from agriculture crop residue burning in Indo-Gangetic Plains – A study using LIDAR, ground measurements and satellite data. J. Atmos. Solar-Terr. Physics 71: 112-120. Baddock, M.C., Bullard, J.E., Bryant, R.G., 2009. Dust source identification using MODIS:
A comparison of techniques applied to the Lake Eyre Basin, Australia. Rem. Sens. Environ. 113, 1511-1528.
Bollasina, M., Nigam, S., and Lau, K.-M. 2008. Absorbing aerosols and summer monsoon evolution over South Asia: An observational portrayal, J. Climate, 21, 3221–3239. Christopher SA, Gupta P, Johnson B, Brindley H, Haywood J, Hsu C. 2011. Multi-sensor
satellite remote sensing of dust aerosols over North Africa during GERBILS. Q. J. R. Meteorol. Soc. 137: 1168–1178, DOI: 10.1002/qj.863
Curier, R. L., Veefkind, J. P., Braak, R., Veihelmann, B., Torres, O., and de Leeuw, G. 2008. Retrieval of aerosol optical properties from OMI radiances using a multiwavelength algorithm: Application to western Europe, J. Geophys. Res., 113, D17S90, doi:10.1029/2007JD008738, 2008.
De Graaf, M., Stammes, P., Torres, O., Koelemeijer, R.B.A., 2005. Absorbing Aerosol Index: Sensitivity Analysis, application to GOME and comparison with TOMS. J. Geophys. Res. 110, D01201, doi: 10.1029/2004JD005178.
Dee, D. and Coauthors, 2011. The ERA-Interim reanalysis: Configuration and performance of the data assimilation system. Quart. J. Roy. Meteor. Soc., 137, 553-597.
Deepshikha, S., Satheesh, S. K., and Srinivasan, J. 2005. Regional Distribution of Absorbing Efficiency of Dust Aerosols over India and Adjacent Continents inferred using Satellite Remote Sensing, Geophys. Res. Lett., 32 (3), art. no. L03811
Dey, S., and Di Girolamo, L., 2011 A decade of change in aerosol properties over the Indian subcontinent Geophys. Res. Lett. 38 L14811
Diner, D. J., T. P. Ackerman, A. J. Braverman, C. J. Bruegge, M. J. Chopping, E. E. Clothiaux, R. Davies, L. Di Girolamo, R. A. Kahn, Y. Knyazikhin, Y. Liu, R. Marchand, J. V. Martonchik, J-P. Muller, A. W. Nolin, B. Pinty, M. M. Verstraete, D. L. Wu, M. J. Garay, O. V. Kalashnikova, A. B. Davis, E. S. Davis, R. A. Chipman, 2010. Ten years of MISR observations from TERRA: Looking back, ahead and in between, Proceedings of the 2010 IEEE International Geoscience and Remote Sensing Symposium, Honolulu, HI, 2010.
Engelbrecht, J.P., McDonald, E.V., Gillies, J.A., Jayanty RKM, Casuccio, G., Gertler, A.W. 2009, Characterizing mineral dusts and other aerosols from the Middle East—Part 1: Ambient sampling.Inhalation Toxicology 21:297-326
30
Engelstaedter, S., Tegen, I., Washington, R., 2006. North African dust emissions and transport. Earth-Science Reviews 79, 73-100.
Gautam, R., Hsu, N. C., Lau, K.-M., Tsay, S.-C., and Kafatos, M. 2009a. Enhanced pre-monsoon warming over the Himalayan-Gangetic region from 1979 to 2007, Geophys. Res. Lett., 36, L07704, doi:10.1029/2009GL037641, 2009.
Gautam, R., Liu, Z., Singh, R. P., and Hsu, N. C. 2009b. Two contrasting dust-dominant periods over India observed from MODIS and CALIPSO data, Geophys. Res. Lett., 36, L06813, doi:10.1029/2008GL036967, 2009.
Gautam, R.. Hsu, N. C, Tsay, S. C. , Lau, K. M. , Holben, B., Bell, S 2011 Accumulation of aerosols over the Indo-Gangetic plains and southern slopes of the Himalayas: distribution, properties and radiative effects during the 2009 pre-monsoon season Atmos. Chem. Phys. 11 12841–63.
Ginoux P, Prospero JM, Gill TE, Hsu CN, Zhao M. Global-scale attribution of anthropogenic and natural dust sources and their emission rates based on MODIS Deep Blue aerosol products. Rev Geophys 2012; 50: RG3005. doi:10.1029/2012RG000388.
Goudie, A.S., Middleton, N.J., 2006. Desert dust in the global system, Springer. 2006.
Guan, H., Esswein, R., Lopez, J., Bergstrom, R., Warnock, A., Follette-Cook, M., Fromm, M., Iraci, L., 2010. A multi-decadal history of biomass burning plume heights identified using aerosol index measurements. Atmospheric Chemistry and Physics Discussion 10, 1e25.
Gupta, P., F. Patadia, and S. A. Christopher, 2008. Multi-sensor data product fusion for
aerosol research, IEEE Trans. Geosci. Remote Sens., 46, 1407–1415,
doi:10.1109/TGRS.2008.916087.
Hatzianastassiou, N., C. Matsoukas, A. Fotiadi, K. G. Pavlakis, E. Drakakis, D. Hatzidimitriou, and I. Vardavas .2005. Global distribution of Earth’s surface shortwave radiation budget, Atmos. Chem. Phys. Discuss., 5(4), 4545– 4597.
Haywood, J.M., Johnson, B.T., Osborne, S.R., Baran, A.J., Brooks, M., Milton, S.F., Mulcahy, J., Walters, D., Allan, R.P., Klaver, A., Formenti, P., Brindley, H.E., Christopher, S., Gupta, P. 2011. Motivation, rationale and key results from the GERBILS Saharan dust measurement campaign. Q. J. R. Meteorol. Soc. 137: 1106– 1116. DOI:10.1002/qj.797
Hsu, N.C., Herman, J.R., Torres, O., Holben, B.N., Tanre, D., Eck., T.F., Smirnov, A., Chatenet, B., Lavenu, F., 1999. Comparisons of the TOMS aerosol index with sun photometer aerosol optical thickness: results and applications. J. Geophys. Res. 104, 6269-6279.
Hsu, N. C., Tsay, S.-C., King, M. D., and Herman, J. R. 2004: Aerosol properties over bright-reflecting source regions, IEEE Trans. Geosci. Remote Sens., 42, 557–569.
Hsu, N.C., Si-Chee Tsay, M.D. King, J.R. Herman 2006. Deep blue retrievals of Asian aerosol properties during ace-Asia. IEEE Transactions on Geoscience and Remote Sensing, vol. 44, no. 11, 3180-3195.
31
Israelevich, P., Ganor, E., Alpert, P., Kishcha, P., Stupp, A. 2012. Predominant transport paths of Saharan dust over the Mediterranean Sea to Europe, Journal of Geophysical Research, vol. 117, D02205.
Kahn, R. A., Y. Chen, D. L. Nelson, F.-Y. Leung, Q. Li, D. J. Diner, and J. A. Logan. 2008. Wildfire smoke injection heights: Two perspectives from space, Geophys. Res. Lett., 35, L04809, doi:10.1029/2007GL032165.
Kahn, R., Petzold, A., Wendisch, M., Bierwirth, E., Dinter, T., Esselborn, M., Fiebig, M., Heese, B., Knippertz, P., Muller, D., Schladitz, A., Von Hoyningen-Huene, W., 2009. Desert dust aerosol air mass mapping in the western Sahara, using particle properties derived from space-based multi-angle imaging. TellusB, 61, 239-251.
Kahn, R. A., Gaitley, B. J., Garay, M. J., Diner, D. J., Eck, T. F., Smirnov, A., and Holben, B. N., 2010. Multiangle Imaging SpectroRadiometer global aerosol product assessment by comparison with the Aerosol Robotic Network, J. Geophys. Res., 115, D23209, doi:10.1029/2010JD014601.
Kalashnikova, O. V., R. Kahn, I. N. Sokolik, and W.-H. Li 2005, Ability of multiangle remote sensing observations to identify and distinguish mineral dust types: Part 1. Optical models and retrievals of optically thick plumes, J. Geophys. Res., 110, D18S14, doi:10.1029/2004JD004550
Kambezidis, H.D., Kaskaoutis, D.G., 2008. Aerosol climatology over four AERONET sites: An overview. Atmospheric Environment 42, 1892-1906.
Kaskaoutis, D. G., Gautam, R., Singh, P., Houssos, E., Goto, D., Singh, S., Bartzokas, A., Kosmopoulos, P.G., Sharma, M., Hsu, N., Holben, B.N. 2012 Influence of anomalous dry conditions on aerosols over India: transport, distribution and properties. J. Geophys. Res., 117, D09106, doi:10.1029/2011JD017314.
Kaskaoutis, D. G., Kharol, S. K., Sinha, P. R., Singh, R. P., Badarinath, K. V. S., Mehdi, W., and Sharma, M., 2011. Contrasting aerosol trends over South Asia during the last decade based on MODIS observations Atmos. Meas. Tech. Discuss. 4 5275–323
Kaskaoutis, D.G., P.T. Nastos, P.G. Kosmopoulos, H.D. Kambezidis, Shailesh Kumar Kharol, K.V.S. Badarinath, 2010. The Aura-OMI Aerosol Index distribution over Greece. Atmospheric Research, 98, 28-39.
Karimi N, Moridnejad A, Golian S, Samani JMV, Karimi D, Javadi S. Comparison of dust source identification techniques over land in the Middle East region using MODIS data. Can J Rem Sens 2012; 38: 586-599.
Kaufman, Y. J., Tanré, D. Remer, L. Vermote, E. F. Chu, A. and Holben B. N., 1997, Operational remote sensing of tropospheric aerosol over the land from EOS-MODIS, J. Geophys. Res., 102, 17,051– 17,068.
Kim, D., Chin, M., Yu, H., Eck, T.F., Sinyuk, A., Smirnov, A., Holben, B.N., 2011. Dust optical properties over North Africa and Arabian Peninsula derived from the AERONET dataset. Atmos. Chem. Phys. Discuss. 11, 20181–20201.
32
Kishcha, P., B. Starobinets, C. N. Long, P. Alpert, 2012. Unexpected increasing AOT trends over north-west Bay of Bengal in the early post-monsoon season. J. Geophys. Res., 117, D23, doi:10.1029/2012JD018726.
Kiss, P., Janosi, I. M., and Torres, O. 2007: Early calibration problems detected in TOMS
Earth-Probe aerosol signal, Geophys. Res. Lett., 34, L07803,
doi:10.1029/2006GL028108,.
Lemaître, C., Flamant, C., Cuesta, J., Raut, J-C., Chazette, P., Formenti, P., Pelon, J. 2010. Radiative heating rates profiles associated with a springtime case of Bodélé and Sudan dust transport over West Africa. Atmos Chem Phys 10:8131–8150. doi:10.5194/acp-10- 8131
Levy, R.C., Remer, L.A., Dubovik, O. 2007. Global aerosol optical properties and application to Moderate Resolution Imaging spectroradiometer aerosol retrieval over land. J. Geophys. Res. 112, D13210, doi:10.1029/2006JD007815
Liu, Z. Liu, D. Huang, J. 2008: Airborne dust distributions over the Tibetan Plateau and surrounding areas derived from the first year of CALIPSO lidar observations. Atmos. Chem. Phys. Discuss., 8, 5957–5977.
Maghrabi, A., Alharbi, B., Tapper, N., 2011. Impact of the March 2009 dust event in Saudi Arabia on aerosol optical properties, meteorological parameters, sky temperature and emissivity. Atmos. Environ. 45, 2164-2173.
Marey, H. S., Gille, J. C. El-Askary, H. M., Shalaby E. A., and El-Raey M. E. 2011, Aerosol climatology over Nile Delta based on MODIS, MISR and OMI satellite data, Atmos. Chem. Phys., 11, 10637–10648.
Martonchik JV, Diner DJ, Kahn RA, Gaitley BJ, Holben, BN. 2004. Comparison of MISR and AERONET aerosol optical depths over desert sites. Geophys Res Lett., 31: doi:10.1029/2004GL019807.
Middleton, N. J., 1986. Dust storms in the Middle East. J. Arid Environ. 10, 83-96.
Miri, A., Ahmadi, H., Ghanbari, A., Moghaddamnia, A., 2007. Dust Storms Impacts on Air Pollution and Public Health under Hot and Dry Climate. Int. J. Energy and Environ. 2, 1.
Mishchenko M I et al 2009 Toward unified satellite climatology of aerosol properties: what do fully compatible MODIS and MISR aerosol pixels tell us? J. Quant. Spectrosc. Radiat. Transfer 110 402–8
Moghadamnia, A., Ghafari, M.B., Piri, J., Amin.S., Han. D., 2009. Evaporation estimation using artificial neural networks and adaptive neuro-fuzzy inference system techniques. Adv. Water Resources 32, 88–97.
Nastos, P.T., Paliatsos, A.G., Anthracopoulos, M.B., Roma, E.S., Priftis, K.N. 2010. Outdoor particulate matter and childhood asthma admissions in Athens, Greece: a time-series study. Environmental Health , 9:45, 1-9.
33
Patadia, F., Yang, E.-S., Christopher, S.A., 2009. Does dust change the clear sky top of atmosphere shortwave flux over high surface reflectance regions? Geophys. Res. Lett., 36, L15825, doi:10.1029/2009GL039092.
Prasad, A.K., Yang, K.-H.S., El-Askary, H.M., Kafatos, M., 2009. Melting of major glaciers in the western Himalayas: evidence of climatic changes from long term MSU derived tropospheric temperature trend (1979-2008). Ann. Geophys. 27, 4505-4519.
Prospero, J.M., Ginoux, P., Torres, O., Nicholson, S.E., Gill, T.E., 2002. Environmental characterization of global sources of atmospheric soil dust identified with the Nimbus 7 total ozone mapping spectrometer absorbing aerosol product. Reviews of Geophys. 40, 2–31.
Rashki, A., Kaskaoutis, D.G., Rautenbach, C.J.deW., Eriksson, P.G.,Giang, M, Gupta, P., 2012. Dust storms and their horizontal dust loading in the Sistan region, Iran. Aeolian Research, 5, 51-62.
Rashki, A., Rautenbach, C.J.deW., Eriksson, P.G., Kaskaoutis, D.G., Gupta, P., 2013a. Temporal changes of particulate concentration in the ambient air over the city of Zahedan, Iran. Air Quality, Atmosphere & Health. doi: 10.1007/s11869-011-0152-5 Rashki A, Eriksson PG, Rautenbach CJdeW, Kaskaoutis DG, Grote W, Dykstra J. 2013b.
Assessment of chemical and mineralogical characteristics of airborne dust in the Sistan region, Iran. Chemosphere 2013b; 90: 227-236.
Rashki, A., Kaskaoutis, D.G., Goudie, A.S., Kahn, R.A., 2013c. Dryness of ephemeral lakes and consequences for dust activity: the case of the Hamoun drainage basin, southeastern Iran. Sci of the Total Environ., 463–464, 552–564.
Remer, L.A. , et al. 2005. The MODIS aerosol algorithm, products, and validation. J. Atmos. Sci. 62, 947-973.
Rosenfeld, D., Y. Rudich, Lahav . R. 2001. Desert dust suppressing precipitation: A possible desertification feedback loop, Proc. Natl. Acad. Sci. U. S. A., 98(11), 5975– 5980, doi:10.1073/pnas.101122798.
Sharifikia M. 2013. Environmental challenges and drought hazard assessment of Hamoun Desert Lake in Sistan region, Iran, based on the time series of satellite imagery. Nat Hazards, 65, 201-217.
Samoli, E., Kougea, E., Kassomenos, P., Analitis, A., Katsouyanni, K., 2011. Does the presence of desert dust modify the effect of PM10 on mortality in Athens, Greece? Sci. Total Environ. 409, 2049-2054.
Satheesh, S.K., Krishna Moorthy, K. 2005. Radiative effects of natural aerosols: A review. Atmos. Environ. 35, 2089-2110.
Sharma, A. R., Kharol, S. K., Badarinath, K. V. S., and Singh, D. 2010: Impact of agriculture crop residue burning on atmospheric aerosol loading – a study over Punjab State, India, Ann. Geophysicae, 28, 367–379.
Singh, R.P., Prasad, A.K., Kayetha, V.K., Kafatos, M., 2008. Enhancement of oceanic parameters associated with dust storms using satellite data. J. Geophys. Res., 113, C11008, doi:10.1029/2008JC004815.
34
Smirnov, A., Holben, B.N., Dubovic, O., O’Neill, N.T., Eck, T.F., Westphal, D.L., Goroth, A.K., Pietras, C., Slutsker, I., 2002. Atmospheric aerosol optical properties in the Persian Gulf. J. Atmos. Sci. 59, 620-634.
Tanre´, D., Kaufman, Y. J., Herman, M., and Mattoo, S. 1997. Remote sensing of aerosol properties over oceans using the MODIS/EOS spectral radiances., J. Geophys. Res., 102, 16,971– 16,988.
Torres, O., Bhartia, P.K., Herman, J.R., Ahmad, Z., Gleason, J. 1998. Derivation of aerosol properties from satellite measurements of backscattered ultraviolet radiation: Theoretical basis. J. Geophys. Res. 103, 17099–17110.
Torres, O., Bhartia, P.K., Herman, J.R., Sinyuk, A., Ginoux, P., Holben, B. 2002. A long-term record of aerosol optical depth from TOMS observations and comparison to AERONET measurements. J. Atmos. Sci. 59: 398-413
United Nations Environment Programme (UNEP). 2006. History of Environmental Change in the Sistan Basin Based on Satellite Image Analysis: 1976 – 2005. P: 60
Valenzuela, A., Olmo, F. J., Lyamani, H., Ant ´on, M., Quirantes, A. and Alados-Arboledas, L. 2012. Aerosol radiative forcing during African desert dust events (2005–2010) over South-Eastern Spain, Atmos. Chem. Phys. Discuss., 12, 6593–6622.
Washington, R., M. Todd, N. J. Middleton, and A. S. Goudie (2003), Duststorm source areas determined by the Total Ozone Monitoring Spectrometer and surface observations, Ann. Assoc. Am. Geogr., 93(2), 297–313, doi:10.1111/1467-8306.9302003.
Yoon, J. von Hoyningen-Huene, W., Vountas, M., Burrows J. P., 2011. Analysis of linear long-term trend of aerosol optical thickness derived from SeaWiFS using BAER over Europe and South China. Atmos. Chem. Phys., 11, 12149–12167.
Zhang J., J. Reid, D. Westphal, E. Hyer, N. Baker, J. Campbell,. 2010. multi-sensor aerosol data assimilation, Aerosol Observability Workship, Monterey, CA, April, 2010