HAL Id: hal-01695926
https://hal.archives-ouvertes.fr/hal-01695926
Submitted on 18 May 2018HAL is a multi-disciplinary open access archive for the deposit and dissemination of sci-entific research documents, whether they are pub-lished or not. The documents may come from teaching and research institutions in France or abroad, or from public or private research centers.
L’archive ouverte pluridisciplinaire HAL, est destinée au dépôt et à la diffusion de documents scientifiques de niveau recherche, publiés ou non, émanant des établissements d’enseignement et de recherche français ou étrangers, des laboratoires publics ou privés.
Developed for Si Isotopes and ICP-MS Analysis
Camille Delvigne, Abel Guihou, Bernard Angeletti, Isabelle Basile-Doelsch,
Jean-Dominique Meunier
To cite this version:
Camille Delvigne, Abel Guihou, Bernard Angeletti, Isabelle Basile-Doelsch, Jean-Dominique Meunier. Reliable Determination of Ge in Solid Environmental Samples Using a Chemical Preparation Proce-dure Developed for Si Isotopes and ICP-MS Analysis. Geostandards and Geoanalytical Research, Wiley, 2018, 42 (1), pp.139 - 149. �10.1111/ggr.12197�. �hal-01695926�
For Review Only
Reliable determination of Ge using the silicon isotopes chemical preparation and ICP-MS analysis for solid
environmental samples.
Journal: Geostandards and Geoanalytical Research Manuscript ID GGR-0514.R1
Manuscript Type: Original Article Date Submitted by the Author: n/a
Complete List of Authors: Delvigne, Camille; Centre Europeen de Recherche et d'Enseignement des Geosciences de l'Environnement,
Guihou, Abel; Centre Europeen de Recherche et d'Enseignement des Geosciences de l'Environnement
Angeletti, Bernard; Centre Europeen de Recherche et d'Enseignement des Geosciences de l'Environnement
Basile-Doelsch, Isabelle; Centre Europeen de Recherche et d'Enseignement des Geosciences de l'Environnement
Meunier, Jean-Dominique; Centre Europeen de Recherche et d'Enseignement des Geosciences de l'Environnement
Keywords: germanium, ICP-MS, reference materials, soils, plants, sample digestion,
cation exchange purification
For Review Only
Reliable determination of Ge using the silicon isotopes chemical preparation and
1
ICP-MS analysis for solid environmental samples.
2
3
4
Camille Delvigne (1) *, Abel Guihou (1), Bernard Angeletti (1), Isabelle Basile-Doelsch (1), Jean-5
Dominique Meunier (1) 6
(1) Aix-Marseille Univ, CNRS, IRD, Coll. de France, INRA, CEREGE, Europôle Mediterranéen de 7
l’Arbois BP 80 13545 Aix-en-Provence, cedex 4, France 8
9
*Corresponding author. Email : delvigne@cerege.fr
10
11
12
13
Keywords: germanium, ICP-MS, reference materials, soils, plants, sample digestion, cation exchange 14
purification 15
Mots clés: germanium, ICP-MS, matériaux de référence, sols, plantes, digestion d’échantillon, 16
purification cationique par résine échangeuse d’ions 17 18 2 3 4 5 6 7 8 9 10 11 12 13 14 15 16 17 18 19 20 21 22 23 24 25 26 27 28 29 30 31 32 33 34 35 36 37 38 39 40 41 42 43 44 45 46 47 48 49 50 51 52 53 54 55 56 57 58 59
For Review Only
Abstract
19
Germanium (Ge) exists at trace levels in the Earth’s crust and is a powerful geochemical
20
tracer of the silicon (Si) cycle. This study proposes a simple and reliable method for
21
determining Ge contents in environmental samples using ICP-MS. As Si and Ge have very
22
similar chemical properties, we investigated the applicability of the chemical preparation
23
procedure developed for Si isotopes to the analysis of Ge in environmental samples.
24
Advantages of this procedure are: (1) efficient removal of the matrix and main interferences
25
affecting Ge analyses by ICP-MS; (2) a low limit of detection (6 ng l-1); (3) relative
26
repeatability of approximately 3% obtained on 74Ge; and (4) robustness and accuracy based
27
on agreement within errors with the published Ge concentrations for rock standards
(BHVO-28
2, AGV-2 and BCR-2). This procedure allows revising the Ge concentrations for 3 soils
29
standards (1.67±0.09 µg g-1; 2.41±0.18 µg g-1; 1.89±0.10 µg g-1 for GBW 07401, GBW 07404
30
and GBW 07407 respectively) and proposing a value for the ERM-CD281 plant standard
31
(0.06±0.01 µg g-1). This method provides a convenient procedure for determining Ge
32
concentrations in environmental samples and opens the possibility of coupling two tracers of
33
the Si biogeochemical cycle with a single analytical procedure.
34 35 2 3 4 5 6 7 8 9 10 11 12 13 14 15 16 17 18 19 20 21 22 23 24 25 26 27 28 29 30 31 32 33 34 35 36 37 38 39 40 41 42 43 44 45 46 47 48 49 50 51 52 53 54 55 56 57 58 59
For Review Only
Résumé
36
Le germanium (Ge), présent à des teneurs en trace dans la croute terrestre, est un traceur
37
géochimique performant du cycle du silicium (Si). Cette étude propose une méthode simple,
38
rapide et fiable pour déterminer les concentrations en Ge dans les échantillons
39
environnementaux par ICP-MS. Vu les propriétés géochimiques très similaires entre Ge et Si,
40
nous avons investigué la pertinence de la procédure de mise en solution et de purification
41
développée pour les isotopes du silicium à l’analyse du Ge dans des échantillons
42
environnementaux. Les avantages de cette technique sont : (1) une élimination efficace de la
43
matrice et des interférences principales affectant l’analyse du Ge par ICP-MS ; (2) une limite
44
de détection de 6 ng l-1 ; (3) une répétabilité relative de 3% obtenue sur l’isotope 74Ge; (4) une
45
bonne fiabilité et justesse basées sur la concordance entre les valeurs de Ge publiées pour les
46
standards de roche (BHVO-2, AGV-2 et BCR-2) aux incertitudes près. Cette méthode a
47
permis de réévaluer les concentrations en Ge de 3 standards de sol (1.67±0.09 µg g-1;
48
2.41±0.18 µg g-1; 1.89±0.10 µg g-1 pour GBW 07401, GBW 07404 et GBW 07407
49
respectivement) et de proposer une valeur pour le standard de plante ERM-CD281 (0.06±0.01
50
µg g-1). Cette méthode présente aussi le grand avantage de coupler deux traceurs du cycle du
51
silicium (à savoir les isotopes stables du silicium et le rapport Ge/Si), en une préparation
52 chimique unique. 53 2 3 4 5 6 7 8 9 10 11 12 13 14 15 16 17 18 19 20 21 22 23 24 25 26 27 28 29 30 31 32 33 34 35 36 37 38 39 40 41 42 43 44 45 46 47 48 49 50 51 52 53 54 55 56 57 58 59
For Review Only
1. Introduction
54
Germanium (Ge) exists at trace levels in the Earth’s crust and is a powerful geochemical
55
tracer of the silicon (Si) cycle. Like Si, Ge is a Group IV element. Both elements have
56
identical outer electronic configurations and similar covalent radii (Ge: 1.22Å and Si 1.17Å;
57
Höll et al., 2007). The geochemistry of Ge is dominated by its propensity to substitute for Si
58
in silicate minerals, and thus closely follows Si through its biogeochemical cycle.
59
Fundamentals of high and low-temperature geochemistry of Ge are reviewed in Rouxel and
60
Luais (2017). To summarize, the Ge/Si ratio has been employed as a tracer of weathering
61
processes (e.g., Kurtz and Derry, 2004; Scribner et al., 2006; Opfergelt et al., 2010; Lugolobi
62
et al., 2010), hydrothermal and geothermal activity (e.g., Mortlock et al., 1993; Evans and
63
Derry, 2002), biological processes (e.g., Ellwood and Maher, 2003; Derry et al., 2005; Sutton
64
et al., 2010), and flow paths (e.g., Kurtz et al., 2011) in modern environments but also in
65
paleo-environmental studies (e.g., Filippelli et al., 2000; Hammond et al., 2004). The use of
66
Ge/Si has recently been extended to the study of the Archean Si cycle (e.g., Hamade et al.,
67
2003; Frei and Polat, 2007; Delvigne et al., 2012; 2016). Another facet of Ge environmental
68
research focuses on the potential economic resource of Ge in soils and plants as the Ge
69
demand for new technologies is exploding while Ge is rare in natural environments
70
(Rosenberg, 2009; Wiche et al., 2017). However, Ge content is often overlooked in the array
71
of analyzed elements. This arises from the analytical difficulties to obtain reliable data
72
because Ge concentrations in environmental samples are generally below the limit of
73
detection of many modern analytical methods. In addition, Ge suffers from various
74
interferences on its isotopes with ICP-MS techniques (mainly 56Fe16O on 72Ge, 57Fe16O and
75
56
FeH16O on 73Ge, and 74Se and 58Ni16O on 74Ge). Interferences due to iron oxides are
76
particularly problematic because some samples contain a few tenths of a percent of Fe while
77
Ge is present at a µg g-1 level. The 58Ni16O interference is also an issue as it combines the
78 2 3 4 5 6 7 8 9 10 11 12 13 14 15 16 17 18 19 20 21 22 23 24 25 26 27 28 29 30 31 32 33 34 35 36 37 38 39 40 41 42 43 44 45 46 47 48 49 50 51 52 53 54 55 56 57 58 59
For Review Only
most abundant Ni and O isotopes (58Ni=68%; 16O=99%). In addition, Ar-based molecular
79
interferences (40Ar16O2, 36Ar36Ar and 38Ar36Ar on 72Ge, 73Ge and 74Ge, respectively) should
80
also be monitored. Germanium is then often qualified as a “tricky” element to analyze and is
81
not routinely determined in environmental samples.
82
The majority of studies published so far on Ge have been carried out using the
isotope-83
dilution hydride-generation ICP-MS technique (ID-HG-ICP-MS) developed by Mortlock and
84
Froelich (1996) (Fillipelli et al., 2000; Kurtz et al., 2002; Evans and Derry, 2002; Derry et al.,
85
2005; Wheat and McManus, 2005; Ellwood et al., 2006; Scribner et al., 2006; Blecker et al.,
86
2007; Makishima and Nakamura, 2009; Lugolobi et al., 2010; Sutton et al., 2010). This is
87
probably the most reliable and precise technique for Ge determination, although it requires a
88
hydride generation system, which is not widespread in laboratories. Alternative techniques
89
are: (1) graphite furnace atomic absorption spectrometry (GF-AAS) (McMahon et al., 2006);
90
(2) ICP-MS analysis with or without high resolution (Hamade et al., 2003 ; Delvigne et al.,
91
2009; Cornelis et al., 2010; Tribovillard et al., 2011); (3) laser ablation ICP-MS analysis
92
(Hamade et al., 2003; Shen et al., 2011; Belissont et al., 2014; Dong et al., 2015;); and (4)
X-93
ray fluorescence spectrometer analysis (Frei and Polat, 2007). While valid for most geological
94
samples, these techniques are working close to their limits of detection for environmental
95
samples, such as plants that commonly range from 0.07 to 20 ng g-1 (Derry et al., 2005;
96
Blecker et al., 2007; Delvigne et al., 2009; Cornelis et al., 2010; Lugolobi et al., 2010). One
97
option is to preconcentrate samples in order to reach concentrations above the detection
98
limits. This was investigated by Soylak and Yigit (2015), who suggested a
separation-99
preconcentration procedure using a polysulfone membrane filter combined with
100
spectrophotometric measurements. This method has the disadvantage of requiring specific
101
materials. For natural water samples, ID-HG-ICP-MS remains the only reliable technique
102
thanks to its high precision and unequaled low detection limits.
103 2 3 4 5 6 7 8 9 10 11 12 13 14 15 16 17 18 19 20 21 22 23 24 25 26 27 28 29 30 31 32 33 34 35 36 37 38 39 40 41 42 43 44 45 46 47 48 49 50 51 52 53 54 55 56 57 58 59
For Review Only
The objective of this study is to propose a simple and reliable alternative method determining
104
Ge contents in solid environmental samples, with a notable focus on soils and plants using
105
ICP-MS, a common instrument found in geochemistry laboratories. As silicon isotopes and
106
Ge/Si ratios are complementary tracers of the Si biogeochemical cycle, we investigate the
107
applicability of the chemical preparation procedure developed for silicon isotopes (Georg et
108
al., 2006) to the analysis of Ge in solid environmental samples.
109
2. Experimental
110
2.1. Material analyzed
111
Reference materials with the recommended values for Ge concentrations are scarce. Three
112
international geological USGS reference materials have been chosen in this study for
113
intercomparison with previous studies: BHVO-2 (basalt), AGV-2 (andesite), and BCR-2
114
(basalt). Despite certified values not being available for these standards, an increasing number
115
of published data provide constraints on Ge concentrations (Table 1). A considerable
116
compilation effort was undertaken by Jochum et al. (2016), which provides reference values
117
(or informative values) determined following ISO guidelines and IAG Certification Protocol
118
using data published between 1995 and 2015. In addition, to better fit the matrix of targeted
119
samples of soils and plants, we selected three soil standards from the Institute of Geophysical
120
and Geochemical Exploration (IGGE, Langfang, China) (GBW 07401, GBW 07404 and
121
GBW 07407, also known as GSS-1, GSS-4 and GSS-7) and a plant standard from European
122
Reference Material (ERM-CD281). Certified Ge concentrations are available for the soils
123
standards, but with low precision (Table 1), while no Ge data is provided for ERM-CD281.
124
Recently, additional data have been made available for GBW 07401-07408 standards (Liu et
125 al., 2014) (Table 1). 126 2 3 4 5 6 7 8 9 10 11 12 13 14 15 16 17 18 19 20 21 22 23 24 25 26 27 28 29 30 31 32 33 34 35 36 37 38 39 40 41 42 43 44 45 46 47 48 49 50 51 52 53 54 55 56 57 58 59
For Review Only
127
Table 1. Reference materials analyzed in this study with their Ge concentrations and
128
associated uncertainties. Values in bold are certified values while others are informative
129
values. * refers to an uncertainty of 3σ instead of 2σ; n.s.= not specified.
130
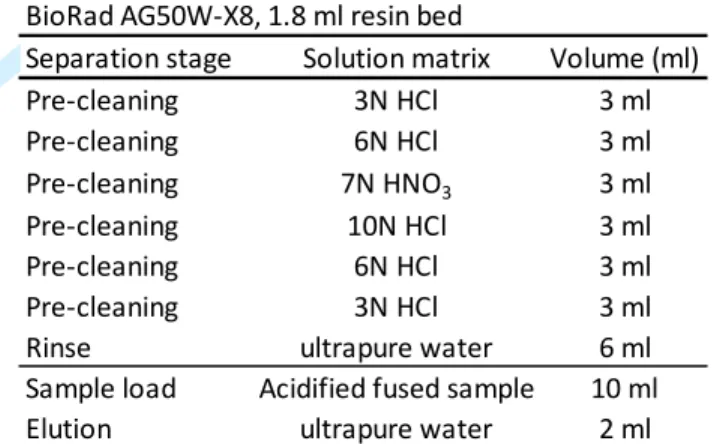
2.2. Sample digestion
131
Samples were digested following the procedure developed for silicon isotopes using a solid
132
sodium hydroxide (NaOH) flux (Georg et al., 2006). Between 10-20 mg (200 mg up to 600
133
mg for ERM-CD281, the plant standard) of powdered samples were weighed directly into
134
silver crucibles after drying for at least 24h at 105°C. Prior to the fusion, calcination steps
135
were carried out to ensure the combustion of organic matter into CO2. Calcinations were
136
performed at 450°C with a 1 h stage at 250°C to ensure slow temperature increase. The 450°C
137
calcination step lasted for at least 1 hour for soils, and 16 h for plants. In the case of plants,
138
the total calcination procedure lasted at least 24 h. Qi et al., (2011) showed that calcination at
139
600°C does not induce Ge loss. Ashes were mixed with approximately 200 mg of NaOH and
140
placed in a furnace at 720°C for 10 minutes. Fusion cakes were then allowed to dissolve
141
overnight in ultrapure water with a brief ultrasonic bath to favor dissolution. Solutions were
142
then quantitatively transferred into pre-cleaned HDPE bottles and acidified to pH ~2 with
143
HNO3. Due to the volatile behavior of Ge in the presence of halogens (HCl, HClO4), only
144
Sample type Provider Published value rsd (2σ) n References
BHVO-2 basalt USGS 1.62±0.04 µg g-1 2% 10 Jochum et al., 2016
1.53 µg g-1 0.2% n.s. Escoube et al., 2012 1.59±0.04 µg g-1 3% 3 Scribner et al., 2006
AGV-2 andesite USGS 1.20±0.08 µg g-1 7% 6 Jochum et al., 2016
BCR-2 basalt USGS 1.46±0.26 µg g-1 18% 6 Jochum et al., 2016
GBW 07401 soil IGGE 1.50±0.04 µg g-1 3% 6 Liu et al., 2014
1.34±0.2 µg g-1 15% * at least 8 Wang et al., 2013
GBW 07404 soil IGGE 2.10±0.02 µg g-1 1% 6 Liu et al., 2014
1.9±0.3 µg g-1 16% * at least 8 Wang et al., 2013
GBW 07407 soil IGGE 1.6±0.3 µg g-1 19% * at least 8 Wang et al., 2013
ERM-CD281 plant ERM no data - -
-2 3 4 5 6 7 8 9 10 11 12 13 14 15 16 17 18 19 20 21 22 23 24 25 26 27 28 29 30 31 32 33 34 35 36 37 38 39 40 41 42 43 44 45 46 47 48 49 50 51 52 53 54 55 56 57 58 59
For Review Only
HNO3 could be used (Luais, 2007; 2012). Acidification to pH~2 was important for Fe-rich
145
samples to ensure a complete dissolution of Fe-oxides as well as ensuring a complete
146
recovery during the following cationic purification (Fitoussi et al., 2009). At this pH, the
147
dominant Ge species is the Ge(OH)40 form (Pokrovski and Schott, 1998).
148
2.3. Sample purification
149
To overcome matrix effects and various interferences, which are complex to correct for,
150
purification of samples appears to be an ideal approach. Perhaps more importantly, the
151
elimination of matrix elements prior to analysis allows a substantial reduction in the dilution
152
factor, which is of great interest for samples with low Ge contents. In addition, performance
153
of ICP-MS can be fully exploited, as the sampling interface and the ion optics are not
154
deteriorated due to salt depositions. A cation-free solution was obtained by passing the
155
solution through a cation exchange column. This allowed for testing of the resin used for
156
germanium isotopes chemical preparation, AG50W-X8 (100-200 mesh in H+ form; Bio-Rad)
157
(Luais, 2007, 2012) using the column chemistry routine of silicon isotopes (Georg et al.,
158
2006). Sample solutions were loaded on a Bio-Rad type column filled with 1.8 ml of
159
AG50W-X8 cation-exchange resin, pre-cleaned with several rinsing with HCl, HNO3 as
160
detailed in the study of Georg et al., (2006) (Table 2). Before loading the sample on the resin,
161
ultrapure water was passed into the resin to remove acids (Georg et al., 2006).The matrix
162
(sodium from fusion and other cations from the sample itself) was retained on the resin, while
163
anionic and neutral species (e.g., Ge(OH)40 and Si(OH)40) passed through. To minimize the
164
dilution due to elution, the sample volume was maximized (here ~ 10 ml of fused solution)
165
while the volume of eluent was kept to a minimum of one resin bed volume (~ 2 ml) (Table
166
2). Since the Si and Ge species do not interact with the resin, the eluent is simply ultrapure
167
water. Ge was collected in a ~ 12 ml cation-free solution. Recovered solutions were weighed
168
to minimize uncertainties inherent to the imprecise volumes recovered. Regarding the
169 2 3 4 5 6 7 8 9 10 11 12 13 14 15 16 17 18 19 20 21 22 23 24 25 26 27 28 29 30 31 32 33 34 35 36 37 38 39 40 41 42 43 44 45 46 47 48 49 50 51 52 53 54 55 56 57 58 59
For Review Only
removal of matrix element, Na is potentially the more difficult element to eliminate as it is the
170
most abundant and resin shows a weak relative selectivity for Na. To warrant a good
171
purification, resin is largely in excess based on expected resin capacity and fused sample
172
concentrations. Indeed, a 10 ml fused solution (typically 0.5 meq) saturates the resin
173
approximately 15% of its exchange capacity. Complete removal of ambient cationic species
174
and especially problematic cations (i.e., Fe, Ni, Zn) and Na was checked with ICP-MS.
175
176
Table 2. Column chemistry routine of the preparation of a solid sample fused with NaOH flux
177
adapted from Georg et al., 2006.
178
2.4.Sample introduction and mass spectrometry
179
Ge concentrations were measured using an ICP-MS Nexion 300X (Perkin Elmer) using a PFA
180
nebulizer, a quartz cyclonic spray chamber and a SC-FAST DX-4 automated introduction
181
system. Operating conditions are detailed in Table 3. A series of five standard solutions with
182
different concentrations (50, 100, 250, 500, 1000 ng l-1) were used to calibrate Ge
183
concentrations. These calibration solutions were made from single element Ge standard 1000
184
mg l-1 solution (Chem Lab, Plasma HIQU, 2-5% HNO3). To correct for instrumental drift,
185
rhodium (Chem Lab, Plasma HIQU, 2-5% HNO3) was introduced to sample solutions through
186
a cross flow line injection resulting in a Rh concentration of 1.58 µg l-1 in the analyzed
187
solution. Ge isotopes 72, 73 and 74 were analyzed and provided consistent values, proving the
188
BioRad AG50W-X8, 1.8 ml resin bed
Separation stage Solution matrix Volume (ml) Pre-cleaning 3N HCl 3 ml Pre-cleaning 6N HCl 3 ml Pre-cleaning 7N HNO3 3 ml Pre-cleaning 10N HCl 3 ml Pre-cleaning 6N HCl 3 ml Pre-cleaning 3N HCl 3 ml Rinse ultrapure water 6 ml Sample load Acidified fused sample 10 ml Elution ultrapure water 2 ml
2 3 4 5 6 7 8 9 10 11 12 13 14 15 16 17 18 19 20 21 22 23 24 25 26 27 28 29 30 31 32 33 34 35 36 37 38 39 40 41 42 43 44 45 46 47 48 49 50 51 52 53 54 55 56 57 58 59
For Review Only
robustness of the method. However, Ge contents were determined using the 74Ge isotope, the
189
most abundant isotopes (36.28%), given higher sensitivity and lower detection limits
190
compared to other isotopes. In the sequence, 400 ng l-1 Ge standard solutions were measured
191
after every 15 samples to check for instrumental drift and evaluate reproducibility.
192
193
Table 3. Instrumental operating conditions for ICP-MS Nexion 300X
194
3. Results and discussion
195
3.1. Assessment of Ge recovery yields during chemical procedure
196
As the dominant Ge species after fusion is the Ge(OH)40, no affinity for cation exchange resin
197
is expected and thus Ge should be quantitatively recovered through the chromatographic
198
procedure.A complete Ge recovery (102±2%; n=6) during sample purification through
199
cationic resin was obtained with single element Ge standard solution at different Ge
200
concentrations (330 to 1100 ng l-1; Fig. 1). To take into account matrix effects, recovery
201
yields for BHVO-2 and GBW 07401 were determined by Ge standard addition to the fused
202
solution before purification (Ge addition from 10 ng l-1 to 100 ng l-1; Fig. 1). The recovery
203
yields for BHVO-2 (99±2%; n=4) indicated a complete recovery for Ge. In the case of GBW
204
07401 (Ge addition from 10 ng l-1 to 1000 ng l-1; Fig. 1), recoveries of approximately 118±5%
205
(n=6) were found when compared to the certified value (Wang et al., 2013). Considering the
206
Plasma power 1600 W
Torch Quartz glass torch
Plasma Ar gas flow rate 15 l min-1
Auxiliary Ar gas flow rate 1.2 l min-1
Nebuliser Ar gas flow rate 0.95 - 1.05 l min-1
(optimized to minimize 140Ce16O+/140Ce+ <0.025 and 70Ce++/140Ce+<0.03)
Nebuliser PFA 0.4 ml min-1
Spray chamber cyclonic (quartz)
Sample uptake rate 0.337 ml min-1
Interfaces cones Nickel
Resolution 700 Typical 74Ge sensitivity ~ 12000 cps µg-1 l Typical 103Rh sensitivity ~ 680000 cps µg-1 l 2 3 4 5 6 7 8 9 10 11 12 13 14 15 16 17 18 19 20 21 22 23 24 25 26 27 28 29 30 31 32 33 34 35 36 37 38 39 40 41 42 43 44 45 46 47 48 49 50 51 52 53 54 55 56 57 58 59
For Review Only
Ge concentrations of Liu et al., (2014), who suggested that the Ge concentration of this
207
standard should be revised, our recovery yield was 109±2% (Fig. 1). As the procedural blanks
208
displayed very low levels of Ge (3±2 ng l-1; n=11) and the given large error range associated
209
with the certified value of this standard (Table 1), we assume our recovery for this standard to
210
be complete. A better agreement would require refining the reference value for the GBW
211
07401 standard (see section 3.2). Based on single element Ge standard solution and BHVO-2,
212
we assume that Ge recovery is complete during cationic purification. The standard addition of
213
BHVO-2 and GBW 07401 show that Si and other neutral, as well as anionic species do not
214
create any matrix effect.
215
216
Fig. 1 Comparison of the Ge concentrations obtained by ICP-MS after cationic purification
217
and expected values for single element Ge standard solution at various Ge concentrations
218
(gray circles) and reference materials (BHVO-2, black squares; GBW 07401, open diamonds)
219
with Ge standard addition (Ge addition from 10 ng l-1 to 1000 ng l-1). The dashed gray line
220
represents a recovery yield of 100%. Expected values for reference materials are calculated
221 0 250 500 750 1000 1250 1500 0 250 500 750 1000 1250 1500 IC P -M S r e su lt s (n g l -1) Expected values (ng l-1) BHVO-2
Ge single element standard GBW 07401 1:1 2 3 4 5 6 7 8 9 10 11 12 13 14 15 16 17 18 19 20 21 22 23 24 25 26 27 28 29 30 31 32 33 34 35 36 37 38 39 40 41 42 43 44 45 46 47 48 49 50 51 52 53 54 55 56 57 58 59
For Review Only
considering Ge data from the literature (Escoube et al., 2012; Scribner et al., 2006 and Liu et
222
al., 2014, see section 3.2). Error bars represent the analytical repeatability (3%).
223
The separation efficiency is demonstrated by the elution curves of two samples (a single
224
element Ge standard solution and a fused BHVO-2) that were loaded onto the pre-cleaned
225
cation exchange resins (Fig. 2). Ge is not retained by the resin and migrates straight through
226
the column and nearly 90% of the loaded Ge is already recovered while the sample load is
227
still infiltrating the resin bed. The last 10% is recovered with 2 ml of ultrapure water (Fig. 2).
228
229
Fig. 2 Elution of germanium during chemical purification of BHVO-2 on AG50W-X8 resin.
230
The black circles corresponds to the cumulated Ge recovered whereas grey bars represent Ge
231
recovered in each volume loaded. Error bars represent the analytical repeatability.
232
Furthermore, ICP-MS screening of the purified solution confirms the absence of major cations
233
and interfering cations after purification (Fig. 3). As demonstrated for Si by Georg et al.,
234
(2006), this shows a complete separation of Ge from the ambient cation matrix. Matrix effects
235
and interferences are then negligible and should not be corrected for, minimizing the errors in
236
Ge contents. In addition, Ar-based molecular interferences are not detectable in the blanks.
237
0
20
40
60
80
100
0
2
4
6
8
9
10
11
12
13
14
G
e
r
e
co
ve
ry
yi
e
ld
(%
)
Volume of eluent (ml)
Sample loading
Ultrapure water
2 3 4 5 6 7 8 9 10 11 12 13 14 15 16 17 18 19 20 21 22 23 24 25 26 27 28 29 30 31 32 33 34 35 36 37 38 39 40 41 42 43 44 45 46 47 48 49 50 51 52 53 54 55 56 57 58 59
For Review Only
238
239
Fig. 3. Recovery yields of the main matrix elements and interfering elements of NaOH fused
240
BHVO-2 after purification with AG50W-X8 resin.
241
Besides overcoming matrix effects and interferences, cationic purification has the advantage
242
to minimize the dilution for analysis, as samples are salt-free. Indeed, the above described
243
sample purification resulted in a dilution of the sample by a factor of 1.2. This is far less than
244
the dilution necessary to reduce total dissolved salt to the maximum of 0.1% accepted for
245
ICP-MS analysis (a dilution by a factor 2 being the minimum). However, some samples with
246
low Ge content might still be close to the detection limit. To overcome this issue, a
247
preconcentration step is helpful. A preconcentration step through low temperature evaporation
248
was feasible, as solutions were free of major elements, limiting the risk of precipitation. For
249
samples that might be close to detection limits, typically plants, an evaporation step at 60°C
250
on a hotplate was performed to increase Ge concentrations. In this study, a maximal
251
preconcentration factor of 2 was achieved without any modification of Ge recoveries. Indeed,
252
aliquots of purified solutions of geostandards BHVO-2, AGV-2 and BCR-2, with or without
253
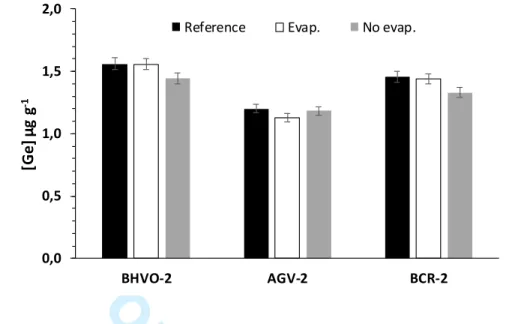
evaporation, displayed similar Ge contents (Fig. 4).
254 2 3 4 5 6 7 8 9 10 11 12 13 14 15 16 17 18 19 20 21 22 23 24 25 26 27 28 29 30 31 32 33 34 35 36 37 38 39 40 41 42 43 44 45 46 47 48 49 50 51 52 53 54 55 56 57 58 59
For Review Only
255
Fig. 4 Ge contents in reference materials (black; Escoube et al., 2012; Scribner et al., 2006;
256
Jochum et al., 2016) compared to ICP-MS Ge contents obtained using our preparation
257
protocol, with (white) or without a final evaporation step (gray). Error bars on our results
258
represent an uncertainty of 3%, the ICP-MS analytical repeatability.
259
3.2. Detection limits, repeatability and accuracy
260
The contribution of Ge from the whole procedural chemistry blank was measured on 11
261
procedural blanks and has been found to be 3±2 ng l-1 and indistinguishable from the
262
instrumental blank. According to the IUPAC definition (IUPAC, 1997), method detection
263
limits were calculated as the mean concentration of 11 procedural blanks plus three standard
264
deviations of these 11 procedural blanks (Table 4). The lowest detection limit was obtained
265
for 74Ge (6 ng l-1), the most abundant Ge isotope. For comparison, the detection limit for 72Ge
266
is 5 times higher, approximately 30 ng l-1 most likely due to the ArO2 interference.
267
Considering that 20 mg of powdered sample was dissolved in 100 ml, this corresponds to a
268
detection limit of approximately 0.03 µg g-1 in the solid sample (Table 4). For the plant
269
standard (200-600 mg dissolved in 100 ml), the detection limit is approximately 0.001 µg g-1
270
in the solid sample. Additionally, the linearity limit was demonstrated over the entire
271 0,0 0,5 1,0 1,5 2,0 BHVO-2 AGV-2 BCR-2 [G e ] µ g g -1
Reference Evap. No evap.
2 3 4 5 6 7 8 9 10 11 12 13 14 15 16 17 18 19 20 21 22 23 24 25 26 27 28 29 30 31 32 33 34 35 36 37 38 39 40 41 42 43 44 45 46 47 48 49 50 51 52 53 54 55 56 57 58 59
For Review Only
calibration range. The linearity limit was above 1000 ng l-1, the highest standard in the
272
calibration curve, as the coefficient correlation of the calibration curve is above 0.995.
273
274
Table 4. Comparison of metrological characteristics of different techniques used for Ge
275
determination. n.s. = not specified. DL = detection limit.
276
The relative repeatability of ICP-MS analysis based on a Ge single element standard solution
277
(400 ng l-1) and analyzed six times on a single day is 3% (n=6, confidence level 95%).
278
Similarly, four aliquots of one fused solution (BHVO-2) passed through four different
279
columns and analyzed twice on the same day gives a relative repeatability of 2%.
280
Reference materials of different composition (BHVO-2; AGV-2; BCR-2; GBW 07401; GBW
281
07404; GBW 07407) were analyzed to evaluate the accuracy of results (Supplementary Table
282
1). However, the absence of properly certified Ge values complicated the exercise. As shown
283
in Fig. 5, our BHVO-2 data agree within 10% with the published value from the compilation
284
of Jochum et al. (2016) (Table 5). However, a careful sorting of compiled data reveals that
285
most of the dissolution protocols are not adapted to Ge, except for that of Scribner et al.
286
(2006). Indeed, all but one of the studies employed acid attacks using HCl, HClO4 or HF (at
287
temperature above 60°C) or a combination of these, which induce loss of Ge (Luais et al.,
288
2012). Tests performed by Luais (2012) demonstrated that Ge loss is at 85% when HClO4 is
289
employed in the acid dissolution mixture. In addition, it is unclear if ICP-MS analysis were
290
corrected for spectroscopic interferences and selected Ge isotopes were not specified. Thus,
291
ID-HG-ICP-MS acid ID 0.5 ng l-1 a
- <3% n.s. natural waters Evans and Derry, 2002
HR-ICP-MS fusion - 10 ng l-1
n.s. 4% n.s. plants and soils Delvigne et al., 2009
ICP-MS fusion - 2 ng l-1
0.05 µg g-1
15% n.s. plants and soils Cornelis et al., 2010
LA-ICP-MS - - - < 1 µg g-1
8% b
n.s. rocks Belissont et al., 2011; Shen et al., 2011
X-ray fluorescence - - - 1.5 µg g-1 c
1% 15% rocks Frei and Polat, 2007
Spectrophotometry acid Polysulfone
membrane filter 2 ng l -1
n.s. 5% n.s. waters and soils Soylak and Yigit, 2015
ICP-MS fusion Cationic
purification 6 ng l -1
0.03 µg g-1 3% 6% plants, soils, rocks This study a
blank level b
valid for Ge/Si ratio as detailed in Shen et al., 2011 c
minimum Ge concentration analyzed (no limit of detection provided)
References Dissolution Preliminary steps
Method DL in solution DL in solid samples Reproducibility Difference with previously published values Samples 2 3 4 5 6 7 8 9 10 11 12 13 14 15 16 17 18 19 20 21 22 23 24 25 26 27 28 29 30 31 32 33 34 35 36 37 38 39 40 41 42 43 44 45 46 47 48 49 50 51 52 53 54 55 56 57 58 59
For Review Only
Ge might be underestimated due to potential Ge volatilization during dissolution, while
292
uncorrected interferences would overestimate Ge content. In the literature, Ge contents
293
estimated using specific techniques devoted to Ge analysis (ID-HG-ICP-MS or double-spike
294
MC-ICP-MS) appear to be systematically lower than Ge contents estimated with ICP-MS
295
techniques. In the case of BHVO-2, ID-HG-ICP-MS and double spike MC-ICP-MS
296
techniques provided a compiled value of 1.56±0.07 µg g-1 (Table 5; Scribner et al., 2006;
297
Escoube et al., 2012), while ICP-MS techniques (acid attacks and interferences corrections
298
not specified) averaged approximately 1.62±0.04 µg g-1 (Table 5; Jochum et al., 2016).
299
Similarly, BHVO-1 data show a comparable shift between the two techniques (1.46±0.12 µg
300
g-1, n=2 for ID-HG-ICP-MS and double spike MC-ICP-MS; 1.64±0.06 µg g-1, n=3 for
ICP-301
MS; Jochum et al., 2016). An intermediate Ge content (1.58 µg g-1) is obtained by Luais
302
(2012) using dedicated acid attack removing 80% of matrix analyzed by ICP-MS suggesting
303
that discrepancy between techniques is likely induced by matrix and interferences. Despite
304
being more limited in number, data acquired using isotope dilution techniques are the most
305
robust (Escoube et al., 2012; Scribner et al., 2006). Considering the compiled values from
306
these two studies, our BHVO-2 results agree within 6% (Fig. 5, Table 5).
307 2 3 4 5 6 7 8 9 10 11 12 13 14 15 16 17 18 19 20 21 22 23 24 25 26 27 28 29 30 31 32 33 34 35 36 37 38 39 40 41 42 43 44 45 46 47 48 49 50 51 52 53 54 55 56 57 58 59
For Review Only
308
Fig. 5 Ge content in BHVO-2 from our study (open diamonds), high quality data (gray
309
symbols) from Escoube et al. (2012) (gray circle; double spike MC-ICP-MS), and Scribner et
310
al. 2006 (gray triangle; ID-HG-ICP-MS), compiled data from Jochum et al. 2016 (filled
311
circles; ICP-MS and one ID-HG-ICP-MS from Scribner et al., 2006). Bold and dashed lines
312
represent the mean and uncertainties (95% confidence level) of each subgroup, respectively.
313
Errors bars represent the analytical precision when provided (i.e., the 3% repeatability in this
314
study).
315
Regarding the other rock standards (AGV-2 and BCR-2), there is a better agreement between
316
our data and the compiled data from Jochum et al., (2016) (Table 5). Considering these three
317
rock standards, our data agree within ~5% with published values.
318
Regarding soil standards (GBW 07401, 07404, 07407), our results are systematically 20 to
319
30% higher than certified values provided in Wang et al. (2013). However, a better agreement
320
is noted when compared to data from Liu et al. (2014), suggesting that certified values should
321 1,2 1,3 1,4 1,5 1,6 1,7 1,8 1,9 2,0 [G e ] µ g g -1 ICP-MS data (this study) HG-ID-ICP-MS and double spike MC-ICP-MS
ICP-MS and HG-ID-ICP-MS data
2 3 4 5 6 7 8 9 10 11 12 13 14 15 16 17 18 19 20 21 22 23 24 25 26 27 28 29 30 31 32 33 34 35 36 37 38 39 40 41 42 43 44 45 46 47 48 49 50 51 52 53 54 55 56 57 58 59
For Review Only
be revised. The use of HClO4 in the sample decomposition procedure calls into question the
322
accuracy of these data and may explain our systematically higher Ge contents.
323
324
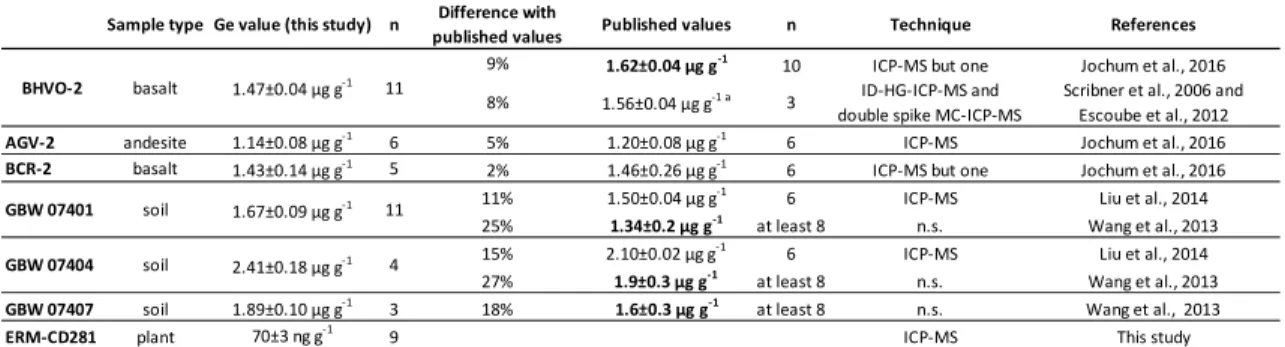
Table 5. Comparison of Ge contents in different reference materials between this study and
325
data from the literature. n.s. = not specified. Uncertainties are provided with 95% confidence
326
level.
327
To provide the first Ge data on a plant standard, the standard ERM-CD281 was analyzed. Its
328
Ge content is estimated to be approximately 70±3 ng g-1 (n=9; Supplementary Table 1).
329
3.3. Perspectives
330
This method provides a convenient procedure for determining accurate and precise Ge
331
concentrations in rocks, soils and plants. Additionally, the combination of Ge concentrations
332
with δ30Si analyses is the great advantage of this method, as both Si cycle tracers can be
333
analyzed from a single procedure allowing a better understanding of the continental Si cycle.
334
As emphasized in Cornelis et al. (2011), the combination of Ge/Si ratios and silicon isotopes
335
turned out to be a great asset for tracing the sources and fate of Si in the critical zone, where
336
numerous co-occurring processes are difficult to decipher.
337
The method can likely be expanded to water samples under the condition of respecting the
338
detection limits. The purification step of this procedure would then be suitable for
339
hydrothermal fluids (12±13 µg l-1 up to 50 µg l-1; Evans and Derry, 2002) and soil solutions
340
Sample type Ge value (this study) n Difference with
published values Published values n Technique References
9% 1.62±0.04 µg g-1
10 ICP-MS but one Jochum et al., 2016 8% 1.56±0.04 µg g-1 a 3 ID-HG-ICP-MS and
double spike MC-ICP-MS
Scribner et al., 2006 and Escoube et al., 2012
AGV-2 andesite 1.14±0.08 µg g-1 6 5% 1.20±0.08 µg g-1 6 ICP-MS Jochum et al., 2016
BCR-2 basalt 1.43±0.14 µg g-1 5 2% 1.46±0.26 µg g-1 6 ICP-MS but one Jochum et al., 2016
11% 1.50±0.04 µg g-1 6 ICP-MS Liu et al., 2014
25% 1.34±0.2 µg g-1
at least 8 n.s. Wang et al., 2013 15% 2.10±0.02 µg g-1 6 ICP-MS Liu et al., 2014
27% 1.9±0.3 µg g-1 at least 8 n.s. Wang et al., 2013
GBW 07407 soil 1.89±0.10 µg g-1 3 18%
1.6±0.3 µg g-1 at least 8 n.s. Wang et al., 2013
ERM-CD281 plant 70±3 ng g-1 9 ICP-MS This study
a
Compiled value of average values of each study and uncertainty values (95% confidence limit) 1.47±0.04 µg g-1 11 11 1.67±0.09 µg g-1 4 2.41±0.18 µg g-1 basalt soil soil BHVO-2 GBW 07401 GBW 07404 2 3 4 5 6 7 8 9 10 11 12 13 14 15 16 17 18 19 20 21 22 23 24 25 26 27 28 29 30 31 32 33 34 35 36 37 38 39 40 41 42 43 44 45 46 47 48 49 50 51 52 53 54 55 56 57 58 59
For Review Only
(7.1±1.4 µg l-1; Cornelis et al., 2010). However, the analysis of silicon isotopes on the same
341
chemical preparation may not be straightforward because of DOC and anions responsible for
342
isotopic bias (Hughes et al., 2011). Water samples with lower Ge contents, such as freshwater
343
and seawater, might be pre-concentrated using Mg-coprecipation (Escoube, 2008). As many
344
other elements are scavenged by this method, the Mg-coprecipitation should be followed by
345
the cationic purification step. As both Ge and Si recoveries are complete during
Mg-346
coprecipitation (Escoube, 2008; Cardinal et al., 2005), the analysis of silicon isotopes and Ge
347
concentrations could again be performed on the same preparation. However, as anionic
348
species will not be removed completely, care should be taken to control the bias induced by
349
anionic species on δ30Si analysis (Hughes et al., 2011).
350
In addition to silicon isotopes analysis, this method paves the way towards a new approach to
351
perform Ge isotopes is soils and plants, which has never been done before. Combining silicon
352
isotopes, germanium isotopes and Ge/Si ratios would be a powerful multi-proxy approach to
353
tackle continental Si biogeochemical cycle.
354
4. Conclusions
355
The fusion and purification technique based on the Si isotopes preparation protocol (Georg et
356
al., 2006) allows precise determination of Ge concentrations in environmental samples down
357
to a detection limit of approximately 6 ng l-1. Analyses performed on 74Ge, the most abundant
358
isotope, show the best precision of approximately 3%. Accuracy, difficult to assess given the
359
scarcity of reliable data available for comparison, was assessed with an error of approximately
360
5%. This method provides data with equivalent or better metrological characteristics than
361
other published procedures and analytical techniques except for ID-HG-ICP-MS, which
362
shows the best precision and lowest detection limit (Table 4) but is much more time
363
consuming. In addition to the reliability of generated data, this technique has two major
364 2 3 4 5 6 7 8 9 10 11 12 13 14 15 16 17 18 19 20 21 22 23 24 25 26 27 28 29 30 31 32 33 34 35 36 37 38 39 40 41 42 43 44 45 46 47 48 49 50 51 52 53 54 55 56 57 58 59
For Review Only
advantages: (1) it does not require peculiar instruments such a hydride generation system, not
365
found in most laboratories unless specific needs, and (2) Ge concentrations and Si isotopic
366
analysis can be performed on the same solution. This last point represents a precious gain of
367
time in terms of sample preparation as one procedure serves to perform both analyses. A
368
systematic coupling of Ge/Si ratios and δ30Si compositions is a great asset in the interpretation
369
of the Si cycle, as both tracers are very complementary.
370
Acknowledgments
371
This study has been funded by the ANR project BIOSiSOL (ANR-14-CE01-002). The French
372
Agence Nationale de la Recherche supported the study through the Project EQUIPEX
373
ASTER-CEREGE. Authors thank Hélène Mariot for her management of the clean laboratory.
374 375
References
376
Blecker S.W., King S. L., Derry L.A., Chadwick O.A., Ippolito J.A. and Kelly E.F. (2007)
377
The ratio of germanium to silicon in plant phytoliths: quantification of biological
378
discrimination under controlled experimental conditions. Biogeochemistry, 86,189-199.
379
Belissont R., Boiron M.-C., Luais B. and Cathelineau M. (2014) LA-ICP-MS analyses of
380
minor and trace elements and bulk Ge isotopes in zoned Ge-rich sphalerites from the
381
Noailhac – Saint-Salvy deposit (France): Insights into incorporation mechanisms and ore
382
deposition processes. Geochimica et Cosmochimica Acta 126, 518–540.
383
Cardinal D., Alleman L. Y., Dehairs F. , Savoye N., Trull T.W., André L. (2005) Relevance
384
of silicon isotopes to Si-nutrient utilization and Si-source assessment in Antarctic waters.
385
Global Biogeochemical cycles, 19, GB2007, doi:10.1029/2004GB002364.
386 2 3 4 5 6 7 8 9 10 11 12 13 14 15 16 17 18 19 20 21 22 23 24 25 26 27 28 29 30 31 32 33 34 35 36 37 38 39 40 41 42 43 44 45 46 47 48 49 50 51 52 53 54 55 56 57 58 59
For Review Only
Cornelis J.-T., Delvaux B., Cardinal D., André L., Ranger J., Opfergelt S. (2010). Tracing
387
mechanisms controlling the release of dissolved silicon in forest soil solutions using Si
388
isotopes and Ge/Si ratios. Geochimica et Cosmochimica Acta 74 (2010) 3913–3924.
389
Cornelis J.-T., Delvaux B., Georg R. B., Lucas Y., Ranger J., Opfergelt S. (2011) Tracing the
390
origin of dissolved silicon transferred from various soil-plant systems towards rivers: a
391
review.Biogeosciences, 8, 89–112.
392
Delvigne C., Opfergelt S. , Cardinal D., Delvaux B. and André L. (2009) Distinct silicon and
393
germanium pathways in the soil-plant system: Evidence from banana and horsetail.
394
Journal of Geophysical Research, 114, G02013, doi:10.1029/2008JG000899.
395
Delvigne, C., Cardinal, D., Hofmann, A., André, L., (2012) Stratigraphic changes of Ge/Si,
396
REE+Y and silicon isotopes as insights into the deposition of a Mesoarchaean banded
397
iron formation. Earth and Planetary Science Letters, 355-356, 109–118.
398
Delvigne C., Opfergelt S., Cardinal D., Hofmann A. and André, L., (2016) Desilication in
399
Archean weathering processes traced by silicon isotopes and Ge/Si ratios. Chemical
400
Geology, 420, 139–147.
401
Derry L.A., Kurtz A. C., Ziegler K., and Chadwick O. A. (2005) Biological control of
402
terrestrial silica cycling and export fluxes to watersheds. Nature, 433, 728-731.
403
Dong L., Shen B., Lee C.-T. A., Shu X.-J., Peng Y., Sun Y., Tang Z., Rong H., Lang X., Ma
404
H., Yang F. and Guo W. (2015) Germanium/silicon of the Ediacaran-Cambrian Laobao
405
cherts: Implications for the bedded chert formation and paleoenvironment interpretations.
406
Geochemistry, Geophysics, Geosystems, 16, 751–763, doi:10.1002/2014GC005595.
407
Ellwood M.J., Kelly M., Maher W. A. and De Deckker P. (2006)Germanium incorporation
408
into sponge spicules: Development of a proxy for reconstructing inorganic germanium
409 2 3 4 5 6 7 8 9 10 11 12 13 14 15 16 17 18 19 20 21 22 23 24 25 26 27 28 29 30 31 32 33 34 35 36 37 38 39 40 41 42 43 44 45 46 47 48 49 50 51 52 53 54 55 56 57 58 59
For Review Only
and silicon concentrations in seawater. Earth and Planetary Science Letters, 243, 749–
410
759.
411
Ellwood M.J. and Maher W.A. (2003) Germanium cycling in the waters across a frontal zone:
412
the Chatham Rise. New Zealand,Marine Chemistry 80, 145– 159.
413
Evans M. J. and Derry L.A. (2002) Quartz control of high germanium/silicon ratios in
414
geothermal waters. Geology, 30, 1019-1022.
415
Escoube R. (2008) Iron and germanium isotope geochemistry in river and hydrothermal
416
systems. PhD Thesis, Université de Pau et des pays de l’Adour, 275 pages.
417
Escoube R., Rouxel O. J., Luais B., Ponzevera E. and Donard O. F.X. (2012)An
418
Intercomparison Study of the Germanium Isotope Composition of Geological Reference
419
Materials. Geostandards and Geoanalytical Research, 36, 149-159.
420
Filippelli G.M., Carnahan J.W., Derry L.A., and Kurtz A. (2000) Terrestrial paleorecords of
421
Ge/Si cycling derived from lake diatoms.Chemical Geology, 168, 9–26.
422
Frei R. and Polat A. (2007)Source heterogeneity for the major components of ∼3.7 Ga
423
Banded Iron Formations (Isua Greenstone Belt, Western Greenland): Tracing the nature
424
of interacting water masses in BIF formation. Earth and Planetary Science Letters, 253,
425
266–281.
426
Fitoussi C., Bourdon B., Kleine T., Oberli F. and Reynolds B. C. (2009) Si isotope
427
systematics of meteorites and terrestrial peridotites: implications for Mg/Si fractionation
428
in the solar nebula and for Si in the Earth’s core. Earth and Planetary Science Letters,
429 287, 77–85. 430 2 3 4 5 6 7 8 9 10 11 12 13 14 15 16 17 18 19 20 21 22 23 24 25 26 27 28 29 30 31 32 33 34 35 36 37 38 39 40 41 42 43 44 45 46 47 48 49 50 51 52 53 54 55 56 57 58 59
For Review Only
Georg R.B., Reynolds B.C., Frank M. and Halliday A.N. (2006)New sample preparation
431
techniques for the determination of Si isotopic compositions using MC-ICPMS. Chemical
432
Geology, 235, 95–104.
433
Hamade T., Konhauser K., Raiswell R., Goldsmith S. and Morris R. (2003) Using Ge/Si
434
ratios to decouple iron and silica fluxes in Precambrian banded iron formations. Geology,
435
31, 35- 38.
436
Hammond D. E., McManus J. and Berelson W. M. (2004) Oceanic germanium/silicon ratios:
437
Evaluation of the potential overprint of temperature on weathering signals.
438
Paleoceanograpy, 19, doi/10.1029/2003PA000940.
439
Hughes H.H., Delvigne C., Korntheuer M., de Jong J., André L. and Cardinal D. (2011)
440
Controlling the mass bias introduced by anionic and organic matrices in silicon isotopic
441
measurements by MC-ICP-MS. Journal of Analytical Atomic Spectrometry, 26,
1892-442
1896.
443
Höll R., Kling M. and Schroll E. (2007) Metallogenesis of germanium—A review. Ore
444
Geology Reviews, 30, 145–180.
445
IUPAC (1997). Compendium of Chemical Terminology, 2nd ed. (the "Gold Book").
446
Compiled by A. D. McNaught and A. Wilkinson. Blackwell Scientific Publications,
447
Oxford.
448
Jochum K.P., Weis U., Schwager B., Stoll B., Wilson S.A., Haug G.H., Andreae M.O. and
449
Enzweiler J. (2016)Reference Values Following ISO Guidelines for Frequently
450
Requested Rock Reference Materials. Geostandards and Geoanalytical Research, 40,
451 333-350. 452 2 3 4 5 6 7 8 9 10 11 12 13 14 15 16 17 18 19 20 21 22 23 24 25 26 27 28 29 30 31 32 33 34 35 36 37 38 39 40 41 42 43 44 45 46 47 48 49 50 51 52 53 54 55 56 57 58 59
For Review Only
Kurtz A.C., Lugolobi F., and Salvucci G. (2011) Germanium‐silicon as a flow path tracer:
453
Application to the Rio Icacos watershed. Water Resources Research, 47, W06516,
454
doi:10.1029/2010WR009853, 2011
455
Kurtz A. C., Derry L. A., and Chadwick O. A. (2002) Germanium-silicon fractionation in the
456
weathering environment. Geochimica et Cosmochimica Acta, 66,1525-1537.
457
Kurtz A. C. and Derry L. A. (2004) Tracing silicate weathering and terrestrial silica cycling
458
with Ge/Si ratios. In Wanty, R. B. and Seal, R. R., editors, Proc. 11th Int. Symp. on
459
Water Rock Interaction, 833-836, The Netherlands.Balkema Pubs.
460
Luais B. (2007) Isotopic fractionation of germanium in iron meteorites: Significance for
461
nebular condensation, core formation and impact processes. Earth and Planetary Science
462
Letters, 262, 21-36.
463
Luais B. (2012) Germanium chemistry and MC-ICPMS isotopic measurements of Fe–Ni, Zn
464
alloys and silicate matrices: Insights into deep Earth processes. Chemical Geology, 334,
465
295–311.
466
Liu Y., Diwu C., Zhao Y., Liu X., Yuan H., and Wang J. (2014)Determination of trace and
467
rare-earth elements in Chinese soil and clay reference materials by ICP-MS. Chinese
468
Journal of Geochemistry,33, 095–102.
469
Lugolobi F., Kurtz A.C. and Derry L.A. (2010) Germanium–silicon fractionation in a tropical,
470
granitic weathering environment. Geochimica et Cosmochimica Acta, 74, 1294–1308.
471
Makishima A. and Nakamura E. (2009) Determination of Ge, As, Se and Te in Silicate
472
Samples Using Isotope Dilution-Internal Standardisation Octopole Reaction Cell
ICP-473
QMS by Normal Sample Nebulisation. Geostandards and Geoanalytical Research, 33,
474 369-384. 475 2 3 4 5 6 7 8 9 10 11 12 13 14 15 16 17 18 19 20 21 22 23 24 25 26 27 28 29 30 31 32 33 34 35 36 37 38 39 40 41 42 43 44 45 46 47 48 49 50 51 52 53 54 55 56 57 58 59
For Review Only
Mc Mahon M., Regan F. and Hughes H. (2006) The determination of total germanium in real
476
food samples including Chinese herbal remedies using graphite furnace atomic
477
absorption spectroscopy. Food Chemistry, 97, 411-417.
478
Mortlock R.A. and Froelich P.N. (1996) Determination of germanium by isotope
dilution-479
hydride generation inductively coupled plasma mass spectrometry. Analytica Chimica
480
Acta, 332, 277-284.
481
Mortlock R. A., Froelich P. N., Feely R. A., Massoth G. J., Butterfield D. A., and Lupton J. E.
482
(1993) Silica and germanium in Pacific-ocean hydrothermal vents and plumes. Earth and
483
Planetary Science Letters, 119, 365-378.
484
Opfergelt S., Cardinal D., André L., Delvigne C., Bremond L. and Delvaux B. (2010)
485
Variations of δ30Si and Ge/Si with weathering and biogenic input in tropical basaltic ash
486
soils under monoculture. Geochimica et Cosmochimica Acta, 74, 225-240.
487
Pokrovski G.S., and Schott J. (1998) Thermodynamic properties of aqueous Ge (IV)
488
hydroxide complexes from 25 to 350°C: Implications for the behavior of germanium and
489
the Ge/Si ratio in hydrothermal fluids. Geochimica et Cosmochimica Acta, 62,
1631-490
1642.
491
Qi H.-W., Rouxel O., Hu R.-Z., Bi X.-W., Wen H.-J. (2011) Germanium isotopic systematics
492
in Ge-rich coal from the Lincang Ge deposit, Yunnan, Southwestern China. Chemical
493
Geology, 286, 252-265.
494
Rouxel O., and Luais B. (2017) Germanium isotope geochemistry. Reviews in Mineralogy
495
and Geochemistry, 82, 601-656.
496
Rosenberg E. (2009) Germanium: environmental occurrence, importance and speciation.
497
Reviews in Environmental Science Bio/Technology, 8, 29-57.
498 2 3 4 5 6 7 8 9 10 11 12 13 14 15 16 17 18 19 20 21 22 23 24 25 26 27 28 29 30 31 32 33 34 35 36 37 38 39 40 41 42 43 44 45 46 47 48 49 50 51 52 53 54 55 56 57 58 59
For Review Only
Scribner A. M., Kurtz A. C., and Chadwick O. A. (2006) Germanium sequestration by soil:
499
Targeting the roles of secondary clays and Fe-oxyhydroxides. Earth and Planetary
500
Science Letters, 243, 760-770.
501
Shen B., Lee C.-T. A., Xiao S. (2011) Germanium/silica ratios in diagenetic chert nodules
502
from the Ediacaran Doushantuo Formation, South China. Chemical Geology, 280,
323-503
335.
504
Soylak M. and Yigit S. (2015) Preconcentration-separation of germanium at ultra trace levels
505
on polysulfone membrane filter and its determination by spectrophotometry. Journal of
506
Industrial and Engineering Chemistry, 24, 322-325.
507
Sutton J., Ellwood M.J., Maher W.A., and Croot P.L. (2010)Oceanic distribution of inorganic
508
germanium relative to silicon: Germanium discrimination by diatoms. Global
509
Biogeochemical Cycles, 24, GB2017, doi:10.1029/2009GB003689.
510
Tribovillard N., Bout-Roumazeilles V., Riboulleau A., Baudin F., Danelian T. and Riquier L.
511
(2011) Transfer of germanium to marine sediments: Insights from its accumulation in
512
radiolarites and authigenic capture under reducing conditions. Some examples through
513
geological ages. Chemical Geology, 282,120–130.
514
Wang Y., Gu T., Wang X., Gao Y.-S., Jochum K.P., Müller W.E.G. (2013) Practical
515
handbook of reference materials for geoanalysis, second, Geological Publishing House,
516
Beijing.
517
Wiche O., Zertani V., Hentschel W., Achtzige R. and Midula P. (2017) Germanium and rare
518
earth elements in topsoil and soil-grown plants on different land use types in the mining
519
area of Freiberg (Germany). Journal Geochemical Exploration, 175, 120-129.
520 2 3 4 5 6 7 8 9 10 11 12 13 14 15 16 17 18 19 20 21 22 23 24 25 26 27 28 29 30 31 32 33 34 35 36 37 38 39 40 41 42 43 44 45 46 47 48 49 50 51 52 53 54 55 56 57 58 59
For Review Only
Wheat C.G. and McManus J. (2005) The potential role of ridge-flank hydrothermal systems
521
on oceanic germanium and silicon balances. Geochimica et Cosmochimica Acta, 69,
522 2021–2029. 523 524 2 3 4 5 6 7 8 9 10 11 12 13 14 15 16 17 18 19 20 21 22 23 24 25 26 27 28 29 30 31 32 33 34 35 36 37 38 39 40 41 42 43 44 45 46 47 48 49 50 51 52 53 54 55 56 57 58 59