THE APPLICATION OF PHOTOVOLTAICS FOR
BUILDINGS
BY
NICHOLAS F. GIANFERANTE
BACHELOR OF SCIENCE IN CIVIL ENGINEERING DECEMBER 1997
UNIVERSITY OF MASSACHUSETTS AT DARTMOUTH
SUBMITTED TO THE DEPARTMENT OF CIVIL AND ENVIRONMENTAL ENGINEERING IN PARTIAL FULFILLMENT OF THE REQUIREMENTS FOR THE DEGREE OF
MASTER OF ENGINEERING IN CIVIL AND ENVIRONMENTAL ENGINEERING AT THE
MASSACHUSETTS INSTITUTE OF TECHNOLOGY JUNE 1999
© 1999 Nicholas Gianferante
The author hereby grants to MIT permission to reproduce and to distribute publicly paper and electronic copies of this thesis document in whole or in part.
SIGNATURE OF AUTHOR - -NICHOLAS F. GIANFERANTE May 10, 1999 CERTIFIED BY JEROME J. CONNOR Professor, Department of Civil and Environmental Engineering Thesis Supervisor
APPROVED
BY
L#..,
V WIANDREW J. WHITTLE =al Cm mittee on Graduate Studies ACAHUSETTS IT
THE APPLICATION OF PHOTOVOLTAICS FOR
BUILDINGS
BY
NICHOLAS F. GIANFERANTE
SUBMITTED TO THE DEPARTMENT OF CIVIL AND ENVIRONMENTAL ENGINEERING ON MAY 12, 1999
IN PARTIAL FULFILLMENT OF THE REQUIREMENTS FOR THE DEGREE OF MASTER OF ENGINEERING IN CIVIL AND ENVIRONMENTAL ENGINEERING
ABSTRACT
The concept of converting the sun's energy into useful power is not a new one. Basic principles governing the photovoltaic(PV) effect were documented in 1839 by Edmond Becquerel, have been refined and applied to the construction of clean and sustainable energy producing systems. NASA first developed early PV systems for use as a reliable source of energy in satellites. Soon after, the technology was applied to the building industry. Because PV cells produce electricity directly, with no harmful emissions, large-scale use of PV systems is an environmentally friendly alternative to the burning of fossil fuel. To be economically feasible, for
large-scale use the scientific and engineering community must find ways to reduce the cost of the technology.
Three primary cost reducing measures are to increase the efficiency of the PV cell, develop large markets that take advantage of economies of scale, and design dual purpose PV panels into the building envelope. The dual-purpose panels serve first as a structural cladding or roofing elements, and second as a power generator. To accomplish this, the structural engineer must design the building fagade to orient the PV panels to take maximum advantage of solar availability.
The information contained herein is intended to provide structural engineers with a basic understanding of solar availability, the basic components of a PV system, and the design issues associated with PV building envelopes. This discussion focuses primarily on grid connected systems and building design in urban environments and is intended to encourage engineers to incorporate innovative integrated PV systems in their designs.
THESIS SUPERVISOR: JEROME J. CONNOR
Acknowledgements
I would like to thank Professor Jerome Connor and Charles Helliwell for their guidance throughout the Masters of Engineering program and my father Robert Gianferante for his assistance in editing this thesis.
I would like to give a special thanks to my children, Danielle, Robert and Mark for their understanding and support during my time at MIT.
Table of Contents
CHAPTER 1
BA CKGRO UND ...
11
1.1 A BRIEF H ISTORY ... 12
1.2 THE A DVANTAGES OF PV POW ER SYSTEM S ... 13
1.3 THE N EED FOR CLEAN, SUSTAINABLE ENERGY ... 15
1.4 PHOTOVOLTAIC PRINCIPLES AND FUNDAMENTALS... 15
1.4.1 Cell Structure ...
15
1.5
TYPES OF PV CELLS ...18
1.5.1 Thick Crystalline Solar Cells...
18
1.5.2 Thin Film Solar Cells ...
19
1.6 TYPES OF PHOTOVOLTAIC SYSTEMS... 20
1.6.1 Stand Alone System ...
20
1.6.2 G rid-Connected System s...
21
CHAPTER 2
TH E A VAILABILITY OF SOLA R ENERG Y...
22
2.1 THE SUN ... 23
2.2 THE N ATURE OF SOLAR ENERGY ... 25
2.3 FACTORS AFFECTING SOLAR ENERGY AVAILABILITY ...
26
2.4 CALCULATIONS FOR SOLAR AVAILABILITY ... 28
2.4.1 G eneral Calculations...
28
2.4.2 Intensity Calculations ...
32
CHAPTER 3
PV SYSTEM COM PONEN TS...
35
3.0
INTRODUCTION ...36
3.1
PHOTOVOLTAIC GENERATOR ...36
3.1.1 PV M odules...
36
3.1.2 Issues affecting PV Generators ...
39
3.1.3 PV G enerator Connectivity...
41
3.2 BALANCE OF THE SYSTEM (BOS)... 42
3.2.1 Energy Storage ...
42
CHAPTER 4
PHOTO VOLTAIC ADVOCATES ...
45
INTRODUCTION ...-.- ...
46
4.1 U.S. GOVERNMENT PV PROGRAMS ...
46
4.1.1 DOE Photovoltaic Program ...
46
4.1.2 American Solar Energy Society (ASES) ...
47
4.2 U.S. INITIATIVES...
47
4.2.1 The M illion Solar Roof Initiative...
47
4.2.2 Solar Buildings Program...
48
4.3 PROPOSED GOVERNMENT INCENTIVES...
48
4.3.1 $2000 Solar Tax Credit ...
48
4.3.2 The Comprehensive Electricity Competition Plan ...
49
4.4 PV BUILDINGS OUTSIDE THE U.S. ... 49
4.4.1 International Energy Agency (IEA)...
49
4.4.2 Government Incentives Outside the U.S ...
52
CHAPTER 5
DESIGN OPTIONS & CONSIDERATIONS ...
54
INTRODUCTION ...
55
5.1
DESIGN CONSIDERATIONS...55
5.2
SIZING THE SYSTEM ...56
5.2.1 PV Generator Sample Calculation ...
57
5.3
DESIGN CONSIDERATIONS...61
5.4
PANEL DEGRADATION FOR AMORPHOUS SILICON (A-SI) ...64
CHAPTER 6
FA(ADE EXAM PLES ...
65
INTRODUCTION ... ...
66
6.1
BASIC CONFIGURATIONS...66
6.2
INNOVATIVE M OUNTING TECHNIQUES...68
CHAPTER 7
ROOF EXAM PLES...71
INTRODUCTION ...
72
6.1
EXAMPLES OF GEOMETRIC CONFIGURATIONS... 73CHAPTER 8
COST ...
77
INTRODUCTION ...78
8.1 M ICRO V I W ... 78 8.2 M ACRO V I W ... 79APPENDIX 1
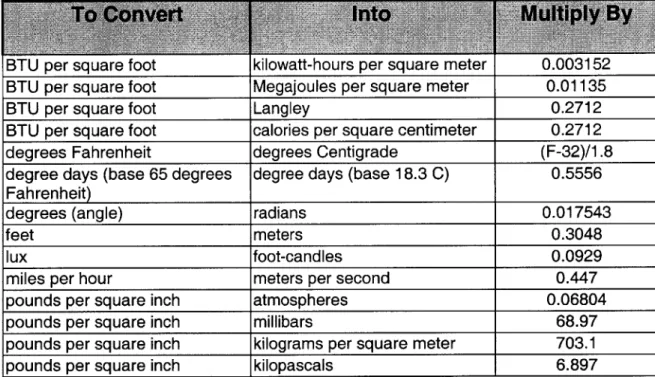
U N IT CO N V ER SIO N TA BLE ...
82
REFEREN CES...83
List of Figures
CHAPTER 1
FIGURE 1.1 TYPICAL PHOTOVOLTAIC POWERED SATELLITE ...
12
FIGURE 1.2 PV ARRAY FOR POWER GENERATION IN REMOTE
L O C A T IO N ...
14
FIGURE 1.3. EMISSIONS STACK FROM FOSSIL FUEL BURNING POWER
F A C IL IT Y ...
15
FIGURE 1.4 BASIC STRUCTURE OF A PV CELL ...
16
FIGURE 1.5 PHOTOVOLTAIC CELL...
17
CHAPTER 2
FIGURE 2.1 SOLAR RADIATION ...
23
FIGURE 2.2 U.S. SOLAR ZONES ...
25
FIGURE 2.3 SOLAR RADIATION SPECTRUM...
26
FIGURE 2.4 EFFECT OF TILT ANGLE AND ORIENTATION...27
FIGURE 2.5 EXAMPLE OF SOLAR RADIATION AVAILABILITY MAP ...
29
EXAMPLE 2.6 WEIGHTED AVERAGE DIAGRAM...
29
CHAPTER 3
FIGURE 3.1 CURRENT V. VOLTAGE DIAGRAM...
37
CHAPTER 5
FIGURE 5.2 3-D PROJECTION OF CEE FACILITY...58
FIGURE
5.4
PRESSURE CAP SYSTEM SECTION ...
63
CHAPTER 6
FIGURE 6.1 VERTICAL WALL ...
67
FIGURE 6.3 VERTICAL SLOPE / FIGURE 6.4 VERTICAL SAWTOOTH ...
67
FIGURE
6.5
A SHINGLED FAQADE WITH AN ALUMINUM
SUB-C O N STR U SUB-C T IO N ...
68
FIGURE 6.6 SUSPENDED ADAPTER FAQADE SYSTEM ...
69
FIGURE 6.7 "RUTIHOF" SYSTEM...69
FIGURE 6.8 "FLAGSOL" SYSTEM ...
69
FIGURE 6.9 "FASSADE 2000" ...
69
CHAPTER 7
FIGURE 7.1
FIGURE 7.2
FIGURE 7.4
FIGURE 7.6
FIGURE 7.7
FIGURE 7.8
CHAPTER 8
FIGURE 8.1
AUSTRIAN PV ROOF TILE...
72
PV ROOF PANELS / FIGURE 7.3 PV ROOFTOP ARRAY...73
PV SKYLIGHTS / FIGURE 7.5 FLEXIBLE METAL SUBSTRATE ... 74
PV ATRIUM PANELS...75
SCHWEIZER SYSTEM ...
76
STANDARD ROOF TILE ...
76
List of Tables
CHAPTER 2
TABLE 2.1 CLEARNESS INDEX...
24
TABLE_2.2
IEXT---...33T A B L E 2.3 M o [4]...
33
T A B L E 2 .4 W [4] ...
33
CHAPTER 3
TABLE 3.1 M ODULE SPECIFICATIONS ...
39
CHAPTER 4
TABLE 4.1 SOLAR HEATING AND COOLING MEMBER COUNTRIES...49
TABLE 4.2 SOLAR HEATING AND COOLING COMPLETED TASKS...51
TABLE 4.3 SOLAR HEATING AND COOLING CURRENT TASKS ...
51
CHAPTER 5
TABLE 5.1 AVERAGE DAILY SOLAR AVAILABILITY ON SOUTH-FACING
W ALL FOR BOSTON AREA ...
57
TABLE 5.2 POWER EAST FACING WALL 60 DEG. ANGLE...58
TABLE 5.3 POWER EAST FACING WALL 90 DEG. ANGLE...59
TABLE 5.4 POWER SOUTH FACING WALL 60 DEG. ANGLE...59
TABLE 5.5 POWER SOUTH FACING WALL 90 DEG. ANGLE...59
TABLE
5.7
PHYSICAL CHARACTERISTICS FOR PANELS ...
61
CHAPTER 8
TABLE 8.1 DOE LONG TERM GOALS ...
79
Chapter 1
Background
Building Shaded PV Integrated System
Handelshaus A. Wild, Innsbruck
[22]
1.1 A Brief History
Photovoltaic systems convert light into electricity. "Photo" is a stem from the Greek word "phos" meaning light and "Volt" is named for Alexandra Volta, a pioneer in the study of electricity. A French physicist, Edmond Becquerel, first described the Photovoltaic (or PV) effect in 1839. Becquerel observed that certain materials would produce a small amount of electric current when exposed to light. The next step toward the development of PV cells occurred in 1873 when Willoughby Smith discovered the photoconductivity of selenium, paving the way for Charles Fritts, an American inventor, who described the first solar cells made from selenium. PV theory
gained widespread acclaim in 1921 when Albert Einstein won the Nobel Prize for his theories explaining the photoelectric effect.
Einstein's theories made it possible for later scientists to develop photovoltaic cells, which utilized materials other than selenium. This next generation of PV cells was more efficient. By 1955 silicone cells were being developed to provide power supplies for the first US earth satellites. The first PV powered satellite was Vanguard I, launched March 17 1958. Other examples of early satellites, which were equipped with photovoltaic panels, include Explorer III-VII, Vanguard II and Sputnick-3. The first commercially available PV cells were produced in the in the 1950's. These PV cells were approximately 2% efficient and cost $1785 per Watt. By the early 1960's the efficiency of the cells had been increased to 14% and the cost had
correspondingly decreased.
Figure 1.1 [14]
Typical Photovoltaic Powered Satellite
_7
Throughout the sixties PV technology continued playing a prominent role for space programs in the US as well as Japan. PV technology was also finding applications outside of the space program and in1963 Japan installed a 242-W PV array on a lighthouse. At that time it was the worlds largest PV array. By 1966 an orbiting Astronomical Observatory was launched by the US, which utilized a PV array of 1 kW.
The 1970's saw PV systems become more diverse. In 1973 the University of Delaware built 'Solar One', one of the worlds first PV residences. The system was a PV-Thermal hybrid. The roof-integrated arrays fed surplus power through a special meter to the utility during the day and purchased power from the utility at night. PV power supplies were being used for a large variety of applications including vaccine refrigeration, room lighting, telecommunications, water
pumping, grain milling, and classroom television. By 1977 total PV manufacturing production in the US exceeded 500kW and was increasing. In 1980 ARCO Solar Co. became the first company to produce more than 1 MW of PV panels in one year, and within 3 years worldwide PV
production exceeded 21.3 MW with sales in excess of $250million.
Throughout the 1980's the world developed PV systems which were capable of producing larger amounts of power and were more easily integrated into modem structures. In 1983 ARCO Solar dedicated a 6-MW PV station in central California. This unmanned facility supplied the local utility grid with enough power for 2000-2500 homes. PV power stations were constructed worldwide, bringing clean sustainable power supplies to areas like Kenya, Zimbabwe, and the Marshall Islands. ARCO Solar released the first commercially available thin film "power module" in 1986. The advent of commercially available thin film PV panels made it feasible to incorporate PV panels as an element of building facades. PV systems costs have been reduced 300% since 1982 in a market growing at a rate of 20% per year. The present cost of electricity from PV systems is 25-50 cents per kilowatt hour. The end of the 80's and 90's have seen many countries incorporating national initiatives encouraging the use of PV power systems. PV systems installed since 1988 provide enough electricity to power 150,000 homes in the US or 8 million homes in the developing world. PV systems generated more than 800 million kilowatt-hours of electricity in 1995[14].
1.2 The Advantages of PV Power Systems
There are many advantages to using PV power. The primary advantage of photovoltaic power generation is electricity is produced without pollutants, detectable emissions, or odors. It is a clean sustainable source of power requiring no fossil fuel. PV fuel comes directly from the sun and is abundant and free. Also, PV systems do not require any extra land area , have no moving parts and produce electricity silently making it possible to use photovoltaics in heavily populated areas. They also have a large degree of flexibility. They can be operated as free standing systems
or combined with other power sources to form hybrid systems. PV systems are ideal for power generation in remote locations because they do not require connection to existing power supply or fuel source and can operate unattended for long periods of time.
Figure 1.2 [12]
PV Array for Power Generation In Remote Location
Their successful use on space shuttles is a testament to their free standing reliability and ability to withstand severe conditions including freezing temperatures and ice. However, if a power grid is available, the PV systems can be tied into the utility and extra electricity can be sold back to the local power company. The modularity of PV systems also enhances the flexibility of
photovoltaic technology. As energy requirements for a particular operation increase, additional PV modules can easily be added to the system.
The large power requirements and corresponding large surface area of commercial and industrial buildings make them good candidates for PV power systems. These types of structures commonly require a hybrid system working in conjunction with the local utility. The advent of "thin" PV panels is the key to large facility PV utilization. Using modem glazing techniques, thin panels can be incorporated into a buildings curtain wall system as easily as conventional glass panels. Roof tiles have also been developed as PV panels. PV panels in both cases serve dual purpose providing shelter as well as power. The current emphasis in PV research and development is to provide more cost efficient methods of incorporating the technology into structures as dual purpose building elements. As the cost of PV power systems continues to decline, and the earth's pollution related atmospheric problems continue to expand, the role of PV power systems for large scale building projects can be expected to increase.
1.3 The Need for Clean, Sustainable Energy
Currently, the world depends mostly on fossil fuels as its primary source for power generation with petroleum providing 40%, coal 27% and natural gas 22% of the worlds electrical energy. The world now consumes the equivalent of 175 million barrels of oil each day. Buildings
continue to play a significant role in the global energy balance, accounting for 20-30% of the total primary energy requirements of industrialized countries. Environmental problems, which are a direct result of the worlds addiction to fossil fuels, include, acid rain, urban smog and global warming[12].
Figure 1.3. [12]
Emissions Stack From Fossil Fuel Burning Power Facility
Global warming is the result of greenhouse gasses settling in the earth's lower atmosphere. The carbon dioxide which is a byproduct of fossil fuel combustion is the primary greenhouse gas. As carbon dioxide lingers in increasing quantities in the lower atmosphere, long wave solar radiation originating from the sun is allowed to reach the surface of the planet and the reflected short wave radiation is trapped in the lower atmosphere by the greenhouse gasses increasing overall global temperature. Many scientists predict devastating global effects if this trend is allowed to continue.
1.4 Photovoltaic Principles and Fundamentals
1.4.1 Cell Structure
The basic element of a photovoltaic system is the solar cell. The solar cell absorbs sunlight and converts it directly into electricity as a result of separate semiconductors being sandwiched together. A semiconductor is an element, whose electrical properties lie between those of conductors and insulators and for the purpose of this discussion, we will use silicon. Silicon was the semiconductor material used in the earliest successful PV devices and is still the most commonly used PV material. Although other materials may be used to exploit the PV effect,
understanding how the property works in silicon will give a basic understanding of how the PV effect is exploited in all devices. Through a process called 'doping', impurities are introduced into the semiconductors, creating p-type and n-type layers. The "p" and "n" correspond to positive and negative and is related to the amount of excess electrons or holes in the material. Although both materials are electrically neutral, n-type silicon has excess electrons and p-type has vacancies of electrons or holes. Silicone doped with phosphorus is used for the n-type layer and silicone doped with Boron makes the p-type layer. Sandwiching them together creates a p/n junction at the interface[2].
Figure 1.4
Basic Structure of a PV Cell
SOLAR RADIATION LOAD Contact Grid n-type, Si p-type, Si Metal Base CONTACT GRID
SECTION LIF A SILICONE SOLAR CELL SCHEMATIC OF A CELL
At the P/N interface , the excess electrons in the n-type material flow to the p-type, and the holes thereby vacated in this process flow to the n-type. Through this electron and hole flow, an electric field is created at the P/N junction. It's this field that causes the electrons to jump from the semiconductor out toward the surface and make them available for the electrical circuit. Now the holes move in the opposite direction, toward the positive surface, where they await incoming electrons. As sunlight passes throughout the thin window layer of silicon, the major part of the light is absorbed in the absorber layer where it creates the free electrons that can flow through a wire connected to both sides of the cell. It is important to note, that in this process, the current produced by the cell is proportional to the amount of incident light absorbed. Current increases with light intensity as well as surface area of the cell and unlike current, the voltage increases to some assumtotic value that is dependent upon the material used and independent of the cell area. Silicon cells of any size, produce approximately 0.5V. Higher voltages are obtained by
Figure 1.5 [13]
Photovoltaic Cell
The average amount of power generated by a typical PV cell is approximately 1 watt with output increasing by connecting cells in series to form larger units known as modules. The modules are most often encapsulated and sealed with a tempered glass cover and a soft plastic backing sheet. This encapsulation process protects the electrical circuits from the weather and provides for a long circuit life span. Modules can be connected together to form arrays. The modules are connected in series to obtain higher voltages or in parallel to obtain higher amperage. The arrays are in turn connected together to form larger arrays. The total size of the PV system is
determined by the amount of electricity that the designer wishes to produce. The modular nature of the system facilitates the installation of just the amount of power required, as well as the flexibility for adding arrays if the future electrical demand should increase. When considering large buildings, the engineer may wish to design the PV modules directly into the building skin as facade elements where the surface area for the arrays is limited to the surface area of the building exterior. At the current state of PV system efficiency, the built in facade PV system cannot
produce the total amount of power required by a large facility in most cases and is therefore supplemental to the main power grid. The system efficiency or conversion efficiency refers to the proportion of solar radiation that the cell can convert into electrical energy. The early PV cells were 1-2% efficient with today's commercially available PV cells being 7-20% efficient. The main focus in PV research is devoted to developing more efficient cells more
economically [2].
1.5 Types of PV Cells
The most commonly used material for commercial PV cells today is silicon. Because of its high degree of distribution, second only to oxygen. It must be refined 99.9999% pure in order to be useful. The two categories suitable for PV cells are Thick Crystalline solar cells and Thin-Film solar cells[5].
1.5.1 Thick Crystalline Solar Cells
Single Crystalline Materials
Single-crystal silicon or monocrystalline cells are sliced from single-crystal boules of silicon grown from a single crystal with uniform molecular structure. These silicon cells referred to as wafers are cut as thin as 200 microns making them ideal for transferring electrons through the material. Laboratory cells demonstrate close to 29% efficiency which is the theoretical limit of
silicon. There are available on the commercial market today monocrystalline cells with an efficiency of 20%[9].
Polycrystalline Materials
Polycrystalline silicon wafers are produced from blocks of cast silicon. Efficiency is slightly less than that of single-crystal wafers because these types of cells are cut from several small crystals or "grains" which introduce boundaries. The boundaries impede the flow of electrons. Research cells approach 18%, whereas commercial modules are approximately 14% efficient. However, polycrystalline wafers are more widely used in industry because the production cost for this type of cell is more economical than that of the single-crystal cell and researchers are working on ways to minimize the effect of grain boundaries.
Gallium Arsenide (GaAs)
Gallium Arsenide (GaAs) is another type of Thick Crystalline material which is often used in high efficiency space ststems. It is a III-V semiconductor material. Multijunction cells based on GaAs have exceeded 30% efficiency[9]. But, they are very expensive to produce and at this time are not now a practical option for commercial buildings.
1.5.2 Thin Film Solar Cells
Thin film solar cells are being developed for the commercial market which use less material and are more economical to produce than the thick crystalline materials. However, the thin films are not as efficient at the present time.
Amorphous Silicon (a-Si)
The major work in thin film technology since 1974 has been with Amorphous Silicon (a-Si). A-Si cells accounted for more than 15% of the worldwide PV production in 1996. These cells are produced with a p-i-n design in which an intrinsic layer is placed between a p and n type layer. Amorphous silicon has unique properties which allow the cells to be designed with an ultrathin p-type top layer (0.008 micron) bonded to a thicker intrinsic layer generally ranging from .5-1 micron and a thin n-type bottom layer approximately 0.02 micron is added. The top layer is made so thin and transparent that most incident light is allowed to pass through where it generates free electrons in the intrinsic layer. The cell n type layers create an electric field across the entire intrinsic region to induce electron movement in that region. Experimental efficiencies with thin film have yielded efficiencies over 10% but in actuality this initial value is reduced approximately 30% by a light induced instability known as the Stabler-Wronski effect which occurs over the first 6 weeks of life. Commercial modules being used in the field have efficiencies in the range of 5-7 percent. Amorphous Silicon technology shows great promise for use in building integrated systems. Thin film semi-transparent a-Si panels can replace tinted glass glazed into the building facade giving the additional advantage of being a weather shield as well producing electricity that reduces the break-even point for the system[8].
Cadium-Telluride (CdTe)
Advanced manufacturing techniques show promise for low cost PV cells using CdTe with laboratory efficiencies in the order of 15 percent and commercially produced cells in the range of 7-8%[9].
Copper-Indium-Diselenide (CuInSe2 or CIS)
The research efficiency for this type of thin film polycrystalline material in 1996 was 17.7 percent with a prototype module boasting an efficiency of more than 10%. But, difficulties in production must be surmounted before these types of panels can be commercially viable.
1.6 Types Of Photovoltaic Systems
There are basically 2 types of PV systems, free standing and grid connected. The main difference being how the electricity is stored and how the system is guarded against fluctuating power. A grid connected system is tied into the local power grid and which becomes the storage medium. Free standing systems require storage batteries and frequently a backup generator is installed to insure continuos power. Building integrated systems have an economic advantage over non integrated systems by becoming an element in the building envelope, replacing conventional facade or roof materials. A high end building facade will often cost as much or more than PV modules. This reduces the break-even point to an immediate or short term pay back for the system and a PV facade can be designed to provide passive solar control through shading which further reduces the break-even point by reducing the facilities cooling costs.
1.6.1 Stand Alone System
Free Standing systems are the most prevalent today. Their high reliability and low maintenance make them ideal for unattended sites. Applications include power for remote homes and cabins, telecommunication stations, water pumping navigational aids and satellite power. It is often more economical to install a PV free standing system than to extend the Power grid to the site. Over 25 MW of free standing PV systems have been installed in the US. It is estimated that the cost of extending power lines in nonurban areas ranges from $20,000-$80,000. Considering the cost advantage of free standing systems versus power grid extension for the average single-family home requiring a 1-2 (kW) PV system costing approximately $12,000/kW installed. Once the system is paid for there are no further utility bills[5].
PV systems have become the power system of choice for telecommunication repeater stations on mountaintops and other remote locations worldwide, often replacing unreliable, high maintenance diesel generators.
The largest disadvantage to the PV free standing systems is caused by the variable nature of the PV fuel supply, the sun. In order for the system to be reliable for worst case situations the system needs to exercise one of 2 options. First, an oversized array with extensive battery storage banks
can be installed, an expensive option. The second option being to design a hybrid system. This system may include a backup generator, or some other type of sustainable energy source. Often PV systems are combined with wind turbines because often the available wind energy is high at the times when solar radiation is low.
1.6.2 Grid-Connected Systems
A PV system may be connected to the public grid through the use of a power inverter. The power inverter is necessary to convert the direct current electricity produced by PV modules into
alternating current electricity at the voltage level as is used in utility power grids. The electricity fed back into the grid is bought back by the local power company. Forming a partnership of sorts . Some utilities, in an effort to promote PV use buy back the power at a higher price than their prevailing rate. In other locations a one to one ratio where the price per kWh is the same in both directions of flow is used. An example of a progressive partnership between a local utility and PV users can be found in Southern California. The Sacramento Municipal Utility District (SMUD), has implemented grid-connected PV programs to capture distributed generation
benefits, testing new business opportunities and increasing grid-connected PV commercialization. As of spring of 1997 the SMUD has placed over 5 MW of distributed PV generation on its system expecting to add in excess of 11 MW from 1997 to 2002[5].
To truly gain widespread use, grid connected systems must be able to compete on an economic level with the cost of conventional power. Efficiencies must rise, costs for the systems must decrease and the systems must be utilized in the most productive manner. PV systems are most cost effective when the utility load and solar resource profiles are well matched. This would be the case where the cooling loads peak and of peak solar radiation coincide.
Chapter 2
The Availability of Solar Energy
Large PVpanel Developed for integration
2.1 The Sun
The sun is the origen of all energy on Earth, providing all the energy required by natural global systems and cycles. The diameter of the sun is 1.39x10⁹ and is 1.5 xlO'1m from earth or about 12 times the earth's diameter away. The earth revolves around the sun in a slight elliptical orbit with the sun being located at one focus of the ellipse. The elliptical shape is nearly round with a major axis of 1.4968x10⁸km, a semi-minor axis of 1.4966x10⁸ and an eccentricity of 0.0167. This means that the epogee as opposed to the apogee of the earth as compared to the sun, varies by 1.7%. The sun is basically a sphere comprised of intensely hot gaseous matter with a black body temperature of 5777K that emanates huge amounts of radiation into space[2].
A constant amount of fixed intensity radiation envelopes the outer atmosphere of the earth and is known as extraterrestrial radiation. The World Radiation Center determines' that the level of extraterrestrial radiation at the outer edge of the earth's atmosphere is equal to 1367 W/m2 with an uncertainty of 1%. Solar radiation entering the earth's atmosphere is subjected to two phenomenon, atmospheric scattering by air molecules and dust, and atmospheric absorption by 03, H20, and C0 2, which reduce the amount of radiation penetrating to the surface (incident
radiation). These 2 phenomenon also serve to absorb and reflect most x-rays and ultraviolet rays. The total amount of incident radiation at the earth's surface can be divided into 2 distinct parts, direct and diffuse. The direct radiation results from direct sunlight, whereas the diffuse radiation is always available. Diffuse radiation in some instances contributes significantly to the total incident radiation. Figure 2.1 [6] Solar Radiation 1000 Global 1400 Direct 1200 E 1000 800 40( 6 00 Diffuse o 400 04 0.8 1.2 18 2,0 2 4 Wavelength (prm)
Diffuse radiation contributes as much as 40% of the total during the summer months and 80% during the winter, in the US, and the seasonal changes are a result of the tilt of the earth on its axis[4]. These changes have larger effects on available radiation in areas at higher latitudes (degrees north or south from the equator). Therefore annually available global radiation may vary by a factor of 2.5 from year to year. The clearness index is the ratio of total incident radiation as compared to the extraterrestrial radiation. Figure 2.2 demonstrates the clearness index, and percent of diffuse radiation for variable weather conditions.
Table 2.1 [2] Clearness Index
Weather Conditions
Clearness Index
Diffuse part of Radiation
(incident/1 367) x 100%
Very Clear Day
44%
-73%
10%
-20%
Misty...
partial Sun
14%
-29%
20%
-80%
Cloudy Day
3%-11%
80%-100%
The amount of energy that comes into contact with the surface of the earth each minute is greater than the amount of energy that the entire population uses in one year. When the sunlight reaches the Earth's surface it is not evenly distributed with the areas near the equator receiving more radiation than those towards the poles. The quantity of solar radiation striking the earth varies by region, season, time of day and other factors. Figure 2.3 shows the variation of energy, in kWh/m2, striking the US on an average June day.
Solar energy incident on our planet is the only continuous source of exergy. Exergy is the valuable part of energy and is irreversibly transformed into anergy, the less useful portion of energy, during each transformation process. The use of solar radiation instead of fossil fuel combustion means saving exergy that was stored over a time period of thousands of years instead of consuming it within a couple of hundred years.
Figure 2.2 [26]
U.S. Solar Zones
2.2 The Nature of Solar Energy
Over 95% of the suns energy is released as visible light. These light waves are generated in a wavelength spectrum ranging from 2x10-' - 4x10~6m[6]. Each wavelength corresponds to a particular frequency and energy level. The shorter the wavelength, the higher the frequency and the energy level, correspondingly the longer the wavelength the lower the frequency and energy level. Red light, for example, has a long wavelength and low energy level, whereas violet light has a short wavelength and corresponding high energy level. Figure 2.4 shows the relationship between wavelength, frequency, and energy and shows where in the spectrum solar energy exists.
Figure 2.3 [13]
Solar Radiation Spectrum
VISIBL E
Wav-length (mz)
10 i IQ1tp04, 10-1
10
G
Photon e nergy (.eV)
2.3 Factors Affecting Solar Energy Availability
There are 7 primary factors affecting the amount of energy available to the designer of a PV building system.
1. Geographic Location- more radiation is available nearer to 0 latitude. Generally, there is more solar energy available in sunny regions as opposed to cloudy or rainy areas and the available solar energy increases slightly with increase in altitude.
2. Site Location of the Collector- Collectors should be placed in direct sun light as opposed to areas shaded by building or trees.
3. Time of Day- More radiation is available during sunlight hours especially during the part of the day when the solar angle is greatest.
4. Time of Year- More radiation is available in summer as opposed to winter due to the inclination of the earth's axis.
5. Atmospheric Conditions- More Solar radiation is available on sunny days
6. Collector Design- Solar collectors such as PV panels that are able to utilize both direct and diffuse radiation are more efficient than focused concentrating collectors.
7. Collector Orientation- In order to take maximum advantage of solar energy the orientation of the PV modules is an extremely important consideration. The intensity of solar radiation is maximum when a flat surface is tilted normal to the suns rays. Therefore the intensity that a
PV panel receives is a function of both its slope or tilt angle, measured from the horizontal, in relationship to the solar incident angle, and the azimuth from due South. The earth sun vector
moves in an ecliptic plane and the solar incident angle is the angle formed between the horizontal and the PV panel. The azimuth measured from due south can be expressed as follows: due south = 0', due east=-90', due west=90', North=180'or -180'.
Figure 2.5 demonstrates how solar intensity is related to slope and azimuth. There is a large range of inclinations that will allow flat panels that are oriented in a southerly direction allowing absorption of over 90% of the available incident radiation. Designers of PV systems for buildings have a large degree of flexibility in the design of the building skin.
Figure 2.4
Effect of Tilt Angle and Orientation
Effect of slope (tilt angle) and
azimuth (orlentation) on the
an-nual Incident energy in Central Europe (C Ecofys)
2.4 Calculations for Solar Availability
2.4.1 General Calculations
Solar energy is a variable energy source but can vary dramatically from one year to the next.. The amount of energy that any PV system can generate is directly dependent upon the amount of solar radiation available. To calculate the amount of solar radiation that a particular PV module will be exposed to is by utilizing data that has been accumulated for the nearest locations at which the system is to be installed. Starting with a value for total incident radiation and adjust these values to compensate for less than ideal slope and azimuth configuration. The primary source of data for areas inside the US is the Solar Radiation Data Manual for Buildings published by the US Department of Energy (Available free of charge online at
(http://rredc.nrel.gov/solar/pubs/bluebook/). This manual uses data collected over a 30 year period, from 1961-1990, at 239 stations located in the US and its territories, giving solar radiation and illumination values to enable quick estimates of the incident solar energy for common
window orientations. The solar radiation and illuminance values were computed using models and National Solar Radiation Data Base hourly values for direct beam, global horizontal and diffuse horizontal solar radiation and dew point temperature.
Figure 2.5 [15]
Example of Solar Radiation Availability Map
Incident Global Solar Radiation on a South-Facing Surface
Monthly Averages (BTUllt /ddy) JULY * a + *.7 - Haa aawa ,2/$5.s
The dots on lhe map re preseint lhe 239 sites of to NSRDB, based ontoh
NEL SCIr Raileto Daft MNXAaf Aklg Maps ere not drawn t Smae.
Inddent global Soier radiaton is le Diel radiaton received by the window and is eefstn of tie direct beam radiain coponent, sky radiatin, and
More accurate estimates of solar availability, which account for variable azimuth and slope of PV arrays, can be calculated by estimating the total available incident radiation, IT , at the location of the PV system and applying a weighted average to the values obtained from the three closest observation stations. Three stations should be sufficient due to the large distances between stations. Designers must also take into account altitude at the target area. Since solar radiation increases as distance above sea level increases, a designer should be careful not to include values from observation stations in the analysis that vary significantly in altitude from the site of the proposed PV system. One weighting average approach is the inverse distance squared technique, which assigns more weight to the closer observation stations[7].
IT =
(Wl XIT)+
(W2XIT2)+
(W3XIT3)where: Wi = weighting factor
2
i / \ 2
j=1 ( ri
Example 2.6
Weighted Average Diagram
1Station 2
where: r = the distance from the PV system to the observation station r1=300 km, r2=200km, r3=100km IT1 .OkWh/m2, IT 2=0.7kWh/m2, T3=0.9kWh/m2 W, = 2 302 = 0.138 W3 - 2_ 2 -0.552 1 1 2 +(jJ1 3k 003 200+ 150 Check: 0.138 +0.310 +0.552 =1 OK. W2 = 3 2 200'C 2 + 1 2
=0.310
kW h
Answer:
Ir =(0.138)(1.0)+ (0.310)(0.7)+ (0.552)(0.9)= 0.752
2The following quantities will be necessary for the purposes of estimating the solar availability:
Solar Declination Angle:
The plane containing the earth's elliptical orbit is called the "ecliptic plane. The equatorial plane contains the earth's equator. The angle between the earth-sun vector and the equatorial plane is the solar declination angle, 8, which is positive when the earth-sun vector points northward relative to the equatorial plane.
S
=
sin-' [0.39795cos(.98563(N -173))]
where: N = number of the day from 1 to 365
Solar Altitude Angle, c = angle of the suns rays measured from horizontal
a
=
sin-
1[cos
L cos
Scosh, + sin L sin
]
where: L = latitude, taken positive north of the equatorh, = hour angle (unit of angular measurement of time) positive before solar noon and negative after solar noon h, = (hours away from solar noon) x h
24h=360' h=15'/hour
example: hsisam = (12-4)X 15 = +600 hs|9pm = -(9) x 15 = -135' Solar Azimuth, A, = number of degrees a panel is rotated from due south
cos
osih
tan Ssin- sinh for cos h >
cos a ' tan L
coosin h, tan___
180 -sin for cos h <tan
cosa ) tan L
Solar Time
Since a solar day is 3.95 minutes longer than 1 complete rotation of the earth about its axis, it is necessary to use solar time when calculating incident radiation.
SolarTime = LST - EoT - LA
LST=Local Standard Time Eot=Equation of Time
LA=Longitude Adjustment = [(Local Longitude-(Longitude of Local Time Meridian)]/15
Eot = 12+ (0.1236 sin x - 0.0043cos x + 0.153 8 sin 2x + 0.0608 cos 2x)h
360(N -1)
365.2420Sunrise and Sunset
Sunrise and sunset occur when the solar altitude angle = 0 hr = cos-'(- tan L tan
6)
Sunrise in Solar Time =--r 15 Sunset in Solar Time = -Sunrise
Maximum solar altitude angle occurs at the median time between sunrise and sunset
2.4.2 Intensity Calculations
The total intensity of incident solar radiation on a surface perpendicular to the solar altitude angle , IT, can be broken into Intensity from direct radiation, IB, and intensity from diffuse radiation, ID-The example values given for ext, w, and m0 in the following table are for the Boston MA area.
Note: The following intensity calculations are for instantaneous intensity. To calculate average daily values, these intensity calculations must be integrated from sunrise to sunset.
IT=IB+D
For direct radiation under clear skies, IB is equal to:
IB = EXT eXp 0.1457K10 00 0.1617(wm)J where: IEXT= extraterrestrial Solar Radiation
p= local atmospheric pressure in millibars n= sea level air mass
w=atmospheric water vapor content in centimeters
Table_2.2
IEXT [4]The Intensity of Extraterrestrial Solar Radiation on the 21st Day of Each Month (kWh/mA2)
Date 21-Jan 21-FebI21-Mar 21-Apr 21-May 21-Jun 21-Jul 121-Aug 21-Sep 21-Oct 21-Nov 21-Dec
Intensity 1.41 1.40 1.38 1.36 1.34 1.33 1.33 1.34 1.36 1.38 1.40 1.14
Table 2.3 m
0[4]
Optical Air Mass zenith angl z
at Sea Level
0 30 601 85 86 87 88 891 90
air mass, m 1 1.15 2 2.92 5.63 10.69 12.87 16.04 20.87 28.35 29.94
Table 2.4 w [4]
Mean Monthly Values of Total Precipitable Water for Clear Sky Conditions (centimeters)
I Jan IFebI Marl Apr
I May
I
Jun
I Jul
I
Aug
I SepI
Oct NovI Dec
Boston
MA 0.74 0.7 0.84 1.16 1.63 2.23 2.60 2.51 2.14 1.53 1.16 0.84For a tilted surface, the intensity, IBT and 'DT must be adjusted for.
IBT = 1B COS i
where i= cosacosAssin(surface tilt angle) + sinacos(surface tilt angle)
IDT= -.5(1+cosp)ID+ -.5(1-cosB)pIT
where: 0.5(1-cosB)pIT account for reflective qualities of the ground Typical values for p:
0.1-0.2 terrain clear of snow cover 0.7 complete snow cover surface tilt angle
Chapter 3
PV System Components
Roof and Fagade Integration of 2 Office
Buildings in the Hague [25]
3.0 Introduction
A complete photovoltaic system is comprised of 3 subsystems, the PV generator, the Balance of the System (BOS) and the intended load. The PV generator consists of the modules and arrays which produce the electricity. The BOS are the installed devices which allow the electricity produced by the PV generator to be applied to the load, including mounting structures for the PV arrays, which will be discussed in a later section, energy storage components and
power-conditioning equipment.
3.1 Photovoltaic Generator
The PV generator is the portion of the PV system which converts solar energy into electricity. This portion of the system includes strings(modules connected together in series) of PV modules and arrays as well as the components necessary to connect them.
3.1.1 PV Modules
PV modules are the components of the system that actually convert the energy from the sun into usable electric energy. The current of the plant is determined by the number of modules that are connected in parallel, whereas the voltage is determined by the number of modules connected in series. A typical silicon solar cell, in full sunshine, with a surface area of 100cm2 provides a current of 3amps and 0.5V. PV systems that were designed to charge 12V batteries would commonly be designed with a maximum capacity of 13-15V. This system would require 30 to 36 cells connected in series providing a peak power output of approximately 50W. Grid systems for buildings have been constructed with power capacities as high as several thousand kW. The maximum voltages for these systems may be as high as 500-1000V. These building integrated systems have been constructed using specialized large area modules with surface areas up to several m2 and peak power output of several hundred watts [2].
Standard PV modules are normally installed within structural aluminum frames which allows them to be easily mounted on the side or roof of a building. Special laminate modules have been developed for integration into the building fagade and have been designed free of the structural aluminum frame and can be mounted into the fagade using the exact same glazing procedures that are used for mounting glass panels. PV tiles have been constructed for roof integration using a
combination of old and new technology and have been designed to visually represent conventional roof types.
To compare PV modules standard test conditions (STC) have been established and are as follows: * Irradiance = 1000W/m2
* Air Mass = AM1.5
* Cell Junction Temperature = 250 C
PV panels are generally compared on the basis of Open circuit voltage, Vc, short circuit current, Isc, nominal power P, and the maximum power point, MPP. Figure 3.1.1 shows the relationship between these quantities.
Figure 3.1 [2]
Current v. Voltage Diagram
3
V0
Open Circuit Voltage, Voc
Open circuit voltage Voc is temperature dependent, decreasing with increasing temperature. A standard devaluation formula is to decrease Vc by 0.0022V/K for every degree change above STC. The opposite condition also exists. One can expect the Vc to increase at a corresponding rate when the temperature falls below STC.
Short Circuit Current, Isc
A unique characteristic of PV cells is that the short circuit current is only slightly higher than the operational current. As the temperature increases there is a small increase in short circuit current, 0.07%/K.
Nominal Power, P.
Nominal power is commonly referred to as peak power, Wp, having corresponding voltage V., and current, I,.
The nominal power that a module can produce is required to be written on each module and the manufacturers specification plate is usually mounted on the back side of the module.
Maximum Power Point, MPP
The MPP is the operating point on a current-voltage curve where the maximum power is
produced, with silicon cells producing approximately 0.45V. Since free standing systems will not always be operating at peak efficiency due to overcast weather conditions, dirty cells, etc., it is important to design the systems with Vmr, exceeding the battery requirements by 1.5V.
Note:
As of yet there is no standardized form or method to report the PV module specifications. Figure 3.1.2 shows a sample data sheet.
Table 3.1
[16]
Module Specifications
Module Specifications for XYZMOD
Electrical Specifications Short Circuit Current, Isc
Open Circuit Voltage, Voc Current at Peak Power, Impp
Voltage at Peak Power, Vmpp
Maximum Power Oupput at 1 000W/m62 and 25degrees C
Variation(spread) +-10%
Voltage decrease with temperature increase
3.3A 21.3V 3.OA 16.7V 48.6W 0.0022V/K/cell Mechanical Specifications Front Cover Encapsulant Backing Solar Cells Edge Sealant Frame Termination Electrical Isolation Weight
Low Iron tempered glass
Ethylene Vinyl Acetate (EVA) White Tedlar
100mmX100mm square cells 36 in series Butyl rubber
Silver anodized structural aluminum Waterproof junction box
300 VDC 10 microamps (TYP) 6.2 kg Environmental Conditions Ambient Temperature Wind Loading Reletive Humidity (-)40degC to 90degC mav. 80km/h 0 to 100%
3.1.2 Issues affecting PV Generators
As seen in chapter 2 , there is a wide range of orientations which can be used on southerly facing modules that will utilize upwards of 90% of the available solar radiation. Factors independent of orientation that reduce the power output of PV generators including, module temperature, shading of cells, mismatch of string modules and module soiling.
Shading
Even small shadows can severely decrease the power output. The cell in the module with the lowest degree of exposure to solar radiation determines the operating current for the entire string. If one thinks of electrical flow as water flowing through a hose, a shaded cell is analogous to a restrictive kink in the hose. The volume of water flowing from the far end cannot exceed the volume of water flowing through the restricted area. Cells, which are partially shaded, will have current reductions proportional to the shaded area. Adding bypass diodes that provide an alternate path for the current to flow can reduce the problems caused by shading.
Module Mismatch
In cases where modules with different I-V curves are connected in series, the module with the least ability to generate current will determine the current for the entire string.
Temperature Control
To avoid module heat up and a corresponding reduction in efficiency, modules should be freely vented. This normally can be accomplished by leaving a 10cm air space at the front and back faces of the panels.
Module Soiling
Dust that accumulates on the face of PV panels can be responsible for significant power reduction, in some cases exceeding 10%. Panels that are inclined at angles greater that 15degrees from horizontal, reach a steady state between dust accumulation and self cleaning within a few weeks after installation.
Safety Concern
It is worth noting that unlike other electrical generators, PV modules can not be turned off. As long as a module is illuminated it will produce electric current. When working on PV systems appropriate safety measures must be used.
3.1.3 PV Generator Connectivity
The electrical components necessary to regulate the electricity produced by the PV panels include, bypass and blocking diodes, fuses, cables, connections, circuit breakers and overvoltage protection devices.
Bypass Diodes -These are usually installed in PV strings with open circuit voltages exceeding 30V. They provide alternate paths for current to travel in strings that have been blocked or restricted by shaded or defective cells.
Blocking Diodes -In the event of ground faults or short circuits, blocking diodes prevent the destruction of cables and modules by preventing current from flowing backwards in a string.
Fuses -These are used if a large number of strings are connected in parallel. Thereby protecting cables from over-current.
Cables - Cable size is determined by the allowable voltage drop along the string at nominal current. The cables must be double insulated and UV protected.
Connections -There are a large number of module connections in any building PV system. Improper connections can render individual modules ineffective and significantly reduce the efficiency of the entire system. Union connectors have been developed which make module installation and subsequent replacement easy and efficient.
Overvoltage Protection Devices - Surge arrestors with a minimum of 5kA peak ratings should be incorporated into the system to protect inverters and bypass or blocking diodes.
Circuit Breakers - Circuit Breakers should be installed between the PV generator and the inverter or charge controller. They must be rated for the system nominal short circuit current and open circuit voltage and for direct current.
A PV system designer must provide locations for connective components in the formof junction boxes. The junction boxes should be weather resistant and located so as to be easily accessed for inspection and maintenance.
3.2 Balance of the System (BOS)
The BOS are the devices that allow the electricity produced by the PV generator to be applied to the load. They include mounting structures for the PV arrays, which will be discussed in a later section, energy storage components and power-conditioning equipment.
3.2.1 Energy Storage
The need for energy storage is due to a temporal discrepancy between electrical production and electrical load demand. Therefore, a medium is required for storing the energy produced until it is needed. For a freestanding system this is accomplished by banks of batteries. Either, Lead-acid (Pb-Lead-acid) or Nickel/Cadmium (Ni/Cd) batteries are used. The limitations inherent in these batteries in the areas of energy density, cycle life temperature of operation and their high level of toxicity have caused researchers to try to develop more efficient energy storage systems.
Typically, the "weak link" in a free standing system is the energy storage component. However, the scope of this discussion is limited to large scale structures which have access to a local utility grid. For grid connected systems, electricity produced in excess of the instantaneous load requirement is diverted by means of an inverter into the local utility grid.
3.2.2 DC Power Conditioning
PV generators produce DC currents and voltages which can be used in several different ways, directly by DC devices, stored in batteries or converted to Ac power and fed into the local electric utility grid. Power-conditioning units are needed for each of these options. The various types of power conditioning units include DC to AC converters (inverters), matching DC/DC converters or charge controllers. For grid systems only inverters are required.
Inverter
PV systems that are tied into the local electrical utility grid by a utility interactive (also called a line-tied) inverter becomes part of the utility system. The inverter is the interface between the PV generator and the utility grid with its primary function to convert the DC electricity produced from the PV generator to AC electricity which integrates smoothly with the voltage and
frequency characteristics of the utility generated power present on the distribution line. The inverter serves as the system control. The utility prevailing line frequency is used as the control parameter and the operating voltage of the PV generator is synchronized accordingly. The control algorithm should be designed to protect against earth fault on the DC side and abnormal utility conditions on the grid side. The inverter should switch itself off in the event of
overheating and at night.
Line-tied inverters equipped with Maximum Power Point Tracker units(MPPT units) that allow the inverter to adjust for solar array variances due to module temperature, shadowing, etc., and extract the maximum power from the PV generator. The MPPT unit varies the input voltage until the maximum power point on the module I-V curve is found. This process is repeated at a minimum of once every 1 to 3 minutes and overall conversion efficiency for the converter should be greater that 92%[2].
Before specifying a specific inverter for a PV system the local power utility should be consulted for specific power conditioning requirements.
Information to be obtained from the inverter manufacturer: e Cost
* Array Compatibility -number of modules per string power tracking capability e Utility compatibility -power quality, harmonics, power factor, etc.
e Energy Performance -weighted average efficiency e Warranty provisions
e Maintenance and repair specifications
Site Information Needed:
e PV system size -kWpea
* Electrical Environment -DC voltage, local safety code requirements, phase * Physical environment -humidity, dust, temp, noise
* Utility connection requirements
Recommended inverter specifications:
e Low start-up and shut-down thresholds e Power Factor > 0.85
* Low total harmonic distortion of output current * Maximum power point operation
* No shut-down if the array power exceeds rated power: ->current limiting function * Low power consumption at night
* Automatic disconnect at utility fault conditions e Automatic restart after fault is cleared
e AC-ripple of array voltage < 3% e Low level of audible noise
* Low level of RF-emissions measured on AC and DC side, VDE 871B(1.1.1996) * Fan cooled
* Electric isolation between AC and DC side * Overvoltage protection on both sides
Chapter 4
Photovoltaic Advocates
Research Center Outer Wall-Integrated PV System
Located in St. Gallen, Switzerland [22]
Introduction
PV technology must have the support of institutions that are in a position to fund development and public interest in the technology if it is to survive and flourish and eventually compete effectively with conventional power generation methods it. Practically speaking, this will have to be undertaken by the governments of countries interested in clean sustainable energy. This section will introduce the primary agencies and incentives within the U.S. which champion PV technology in buildings and will also discuss the primary international organization funding the development of PV in buildings as well as point out several PV programs incorporated in various other countries.
4.1 U.S. Government PV Programs
Responding to the oil embargo in 1973 -74 the U.S. Department of Energy funded the Federal Photovoltaic Utilization Program. Nine federal agencies participated in the installation of over 3100 PV systems. Many of these systems are still in operation and stand as a testament to the reliability of PV systems in practical field applications. As the oil embargo ended and the price of oil dropped federal funding for alternate sources of energy began to flounder. As the end of the 1980's came around and the general population started to understand the detrimental affects of green house gasses, that are caused by burning fossil fuel on global climate change a renewed vigor for clean energy began to emerge.
4.1.1 DOE Photovoltaic Program
Today the Department of Energy(DOE) has a very active Photovoltaic Program. Their stated mission is to make photovoltaics a significant part of the domestic economy as an industry and an energy source. The Photovoltaic Program activities include supporting basic research projects and R&D collaborations in order to refine PV technology and assist the industry in becoming self-sustaining. The program will be successful when photovoltaics are able to meet a significant portion of the U.S. energy requirements. More information about the DOE Photovoltaic Program is available on the internet at http://www.eren.doe.gov/pv/program.
The DOE also operates a facility known as the National Center for Photovoltaic Research where they perform world class research focused on increasing PV efficiencies and developing PV components that are more economical to produce.

![Figure 5.1 [2] PV Envelope Configurations sd000*~a r 0 hr I I I Shed roof .$We roof](https://thumb-eu.123doks.com/thumbv2/123doknet/14040090.458922/55.918.118.462.211.1088/figure-pv-envelope-configurations-sd-shed-roof-roof.webp)
![Figure 6.4 Vertical Sawtooth [2]](https://thumb-eu.123doks.com/thumbv2/123doknet/14040090.458922/67.918.146.774.207.1105/figure-vertical-sawtooth.webp)