Assessing Business Models Arising from the Integration of
Distributed Energy Systems in the Chilean Electric Power System
by
Jorge I. Le Dantec
Master in Finance, Universidad de los Andes, Chile (2011)
Bachelor of Science in Industrial Engineering, Universidad de los Andes, Chile (2005)
SUBMITTED TO THE SYSTEM DESIGN AND MANAGEMENT PROGRAM IN PARTIAL FULFILLMENT OF THE REQUIREMENTS FOR THE DEGREE OF
Master of Science in Engineering and Management A____ r__IS
at the
Massachusetts Institute of Technology
@ 2014 Massachusetts
January 2014
Institute of Technqjogy. All rights reserve
MASSACHUSETTr WNS IUTE. OF TECHNOLOGY
JUN 2 6 2014
LIBRARIES
d.Signature redacted
Signature of AuthorS
Certified by Accepted byy (emYesign and Management Program January 16, 2014
ignature redacted
Sign~
Professor Jose Ignhcio Perez Arriaga Thesis Supervisor Engineering Sys ivir Vising Professor
3ture redacted,
Assessing Business Models Arising from the Integration of
Distributed Energy Systems in the Chilean Electric Power System
by
Jorge 1. Le Dantec
Abstract
Electric power systems are more than just networks of generation,
transmission and distribution assets. They are socio-technical systems, involving regulation, markets and technology availability. Presently, the dynamic relation among these aspects is creating new consumer needs in many power systems around the world, which incumbent electricity utilities do not seem well suited to meet at the required pace. In this context, the integration of Distributed Energy Systems (DESs) and their related business models appears as a flexible and often more affordable option to deliver value, by fulfilling the unmet needs of both consumers and utilities.
To advice Chilean electric power system's stakeholders about the adequacy of a set of DES-related business models to Chilean needs, this document presents a systematic analysis, which focuses on the interrelation between business model attributes, involved DES technologies, and stakeholder needs. Specifically, an analytic framework is developed and applied to some business models currently operative in other markets, measuring their adequacy to meet stakeholders' needs in a set of envisioned scenarios of Chile's power system.
This work provides a systematic tool for decision-making processes in selecting business models, when the decision must be made with qualitative data. Moreover, the evaluation in the Chilean system of actual business models shows results that should be valuable for consumers, utilities, and regulators.
Thesis Supervisor: Professor Jose Ignacio P6rez Arriaga Title: Visiting Professor, Engineering Systems Division
(Page intentionally left blank)
Acknowledgments
As this thesis marks the end of an incredibly enriching experience at MIT, I would like to show my gratitude to some of the people that made this possible.
I want to deeply thank Professor Pat Hale and the SDM staff, for their trust and
support in academic guidance, extracurricular activities and personal matters. This support network was also formed by my SDM fellows, an amazing group of people that were always willing to help. Special thanks to Jorge Moreno, who was always willing to share his knowledge in Systems and Energy, the main focus of my studies at MIT.
I am also greatly indebted to my advisor, Professor Ignacio P6rez Arriaga, and the
working team of the "Utility of the Future" project at the MIT Energy Initiative: Dr. Richard Tabors, Professor Carlos Batlle, and my teammates Ashwini Bharatkumar and Jesse Jenkins. The great experience that I had at the "Utility of the Future" project, which gave context to this thesis, was forged by the discussions and learning acquired by working with this astounding team of professionals and academics.
My heartfelt gratitude to my parents, for their generous support whenever it was
needed. This endeavor would not have been possible without their help.
Finally, I want to express my deepest gratitude to my wife, Maria Isabel. It is not easy to find words to thank such an unconditional commitment, shown everyday by taking care of our children and myself, becoming the cornerstone of our family during these years at MIT.
(Page intentionally left blank)
Table of Contents
LIST OF FIGURES 9
LIST OF TABLES 10
CHAPTER 1- INTRODUCTION 11
1.1 Context & Motivations 11
The role of energy challengesfor Chilean development 11
Real concerns of utilities 13
The "Utility of the Fu ture" project 14
1.2 Research Approach and Thesis Scope 15
1.3 Objectives and Thesis Roadmap 16
1.4 Acronyms and Definitions 19
CHAPTER 2 - SYSTEMIC APPROACH TO DISTRIBUTED ENERGY SYSTEMS 20
2.1 Distributed Energy Systems (DESs) 20
What is a Distributed Energy System? 20
Distributed Energy Systems' Components 21
Distributed Energy Systems in the Grid 22
2.2 The Expected Role of DESs in Electric Power Systems' Dynamics 23
2.3 DES Business Models Analytic Framework [BMAF] 25
"Matrix 1 ": Business Model Attributes vs. DES Technology Components 26
"Matrix 2": Business Model Attributes vs. Consumer and Utility Needs 27
CHAPTER 3 - DESS IN THE CHILEAN ELECTRIC POWER SECTOR 28
3.1 Chile: Geography and Economics 28
The Northern Region 28
The Central and Southern Regions 29
Patagonia & Austral Regions 30
3.2 Chilean Electric Power Sector 31
Electric Power Systems in Chile 31
Structure of the Electric Power Sector 33
3.3 Distribution-End of the Chilean Electric Power Sector
3.4 Integration of DESs under the Current Scenario 37
Effects Involving Technology-Related Factors 39
Effects Involving Regulatoiy Factors 40
Effects Involving Socio-Economic Factors 42
3.5 Integration of DESs under Foreseeable Scenarios 43
Change Drivers and Future Scenario Projection 43
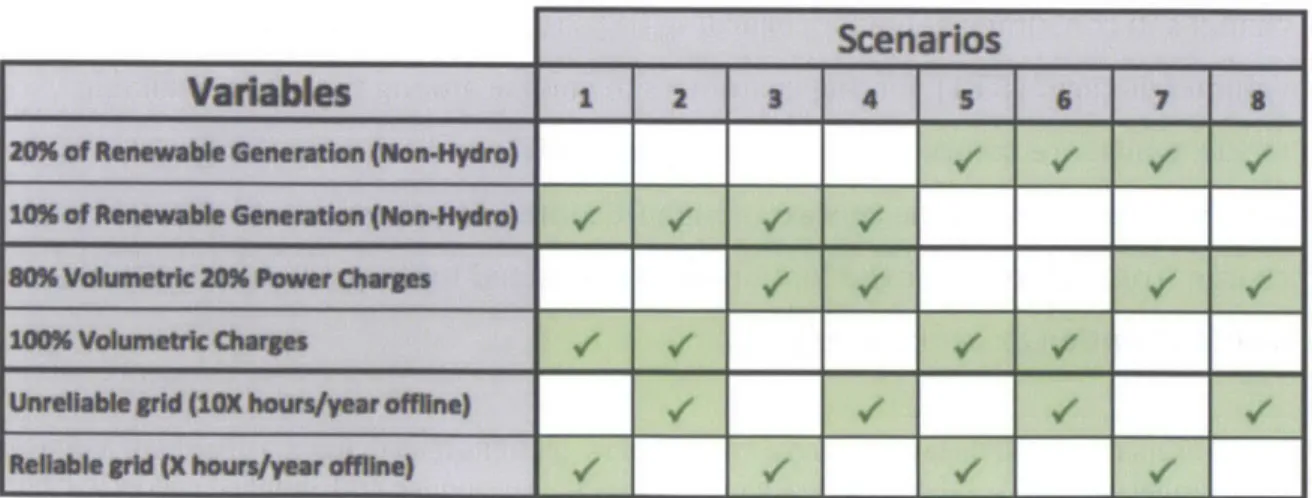
Future Scenarios for DES In teg ration 44
CHAPTER 4 - BUSINESS MODELS FOR DISTRIBUTED ENERGY SYSTEMS 45
4.1 Business Model Analysis 45
Energy Suppliers 46
Energy Demand Managers 50
DES Enablers 52
4.2 Overall Analysis 57
CHAPTER 5 - BUSINESS MODELS EVALUATION 61
5.1 Quantitative Evaluation of Qualitative Data 61
Relative Need's Weights and Business Model's Need Fulfillment Scores 62
Feasibility and Challenges of the Business Models in the Chilean Context 67
5.2 Pugh's Method Output 70
CHAPTER 6 - CONCLUSIONS AND RECOMMENDATIONS 73
6.1 Conclusions 73
6.2 Recommendations 76
Recommendations To Consumers, DES Administrators, or DES Entrepreneurs 76
Recommendations To Incumbent Utilities 77
Reconnendations To Regulators 80
6.3 Further Work 82
REFERENCES 83
APPENDICES 85
Appendix A: DNV KEMA's Microgrid Optimizer Tool for Valuation of DESs' Impact 85
Appendix B: Calculation Tablesfor Business Model's Need Fulfillment Scores 87
8 36
List of
Figures
Figure 2-1: Figure 2-2: Figure 3-1: Figure 3-2: Figure 3-3: Figure 4-1: Figure 5-1:Different DES Topologies... 20
Layers of DES Technologies... 21
Map of Chilean Electric Power Systems ... 32
Current Chilean Electric Power System's Stakeholders Diagram...35
Distribution Value Added (Rudnick, 2009) ... 37
Aggregation of Business Models Over a "Matrix 1" Table ... 57
List of Tables
T able 1-1: A cronym s...19
T able 2-1: B M A F's "M atrix 1"... 26
Table 2-2: BMAF's "Matrix 2"... 27
Table 3-1: Eight Scenarios for the Chilean Electric Power Sector ... 44
T able 4-1: T IL's "M atrix 1"... 46
T able 4-2: T IL's "M atrix 2"... 46
Table 4-3: Solar City's "Matrix 1" ... 48
Table 4-4: Solar City's "Matrix 2" ... 48
Table 4-5: Konterra's "Matrix 1" ... 49
Table 4-6: Konterra's "Matrix 2" ... 49
Table 4-7: EnerNOC's "Matrix 1"...50
Table 4-8: EnerNOC's "Matrix 2"... 51
Table 4-9: Opower's "Matrix 1"... 51
Table 4-10: Opower's "Matrix 2" ... 52
Table 4-11:WeatherBug's "Matrix 1"... 53
Table 4-12: WeatherBug's "Matrix 2"... 53
Table 4-13: Energy Aware's "Matrix 1" ... 54
Table 4-14: Energy Aware's "Matrix 2" ... 54
Table 4-15: Sequentric's "Matrix 1" ... 56
Table 4-16: Sequentric's "Matrix 2" ... 56
Table 4-17: 8 Business Models' Aggregated "Matrix 2"... 59
Table 5-1: Base Scenario's Ranking of Needs' Relevance... 63
Table 5-2: Base Scenario Needs' Weights... 63
Table 5-3: 8 Scenarios' Consumer Needs' Weights ... 64
Table 5-4: Consumer Needs' Fulfillment Scores of the 8 Business Models ... 65
Table 5-5: Utilities Needs' Fulfillment Scores of the 8 Business Models ... 65
Table 5-6: Rationale of Consumer Needs' Fulfillment Scores... 66
Table 5-7: Rationale of Utilities Needs' Fulfillment Scores... 66
Table 5-8: Feasibility Scores of the 8 Business Models...69
Table 5-9: Scenario 1 Consumers Needs' Weighting Table ... 70
Table 5-10: Scenario 1 Needs' Weighted Fulfillment Scores ... 70
Table 5-11: Need Fulfillment Scores for the 8 Business Models in the 8 Scenarios.. 71
Table 5-12: Need Fulfillment Scores Considered "Good" (>= 1.50 points)... 71
Table 5-13: Feasible Business Models that Fulfill Stakeholder's Needs ... 72
Table 6-1: Regulated Distribution Utility's Opportunities and Challenges in DESs' B u sin ess M od els ... 79
Chapter 1 - Introduction
1.1 Context & Motivations
The role of energy challenges for Chilean development
Throughout my life -and particularly during my working years- I have experienced the crucial role of electricity in nearly all of the activities required for the
development of Chile, my country. I witnessed the blackouts due to droughts in the late 90's, I realized the relevance of electric power in the cold chain of Chilean exports (like fruits or salmon that are a relevant part of them) while working in the Port of Valparaiso, and I observed the fleeing of foreign investment due to its uncompetitive costs when analyzing new manufacturing plant locations while working in finance for a consumer goods company.
Nowadays, the scenario has become even more complicated. Though there has been some progress in regulation, penetration of renewables and short-term security of supply', there are still many issues related to long-term security of supply2 and transmission lines' deployment. These issues have primarily a socio-technical nature, as they derive from the constant increase of electricity demand in Chile (5% aggregate rate according to Comisi6n Nacional de Energia [CNE] (2013), requiring doubling the supply every fourteen years), and from the enhanced environmental consciousness that has many generation projects -hydroelectric, thermoelectric, eolic, etc.- stuck in environmental impact evaluations and in the judicial system.
The effect of the scenario described above is highly harmful to Chile's development. The lack of new hydro buffers increases the risks of energy scarcity due to droughts. As Chile imports practically all its gas, coal, and oil supplies for power generation,
1 "[S]hort-term energy security focuses on the ability of the energy system to react promptly to
sudden changes in the supply-demand balance(IEA, 2014).
2 "[L]ong-term energy security is mainly linked to timely investments to supply energy in line with
fossil fueled alternative to hydropower is much more expensive (not even
mentioning its environmental effects). This combination has a direct effect on the cost at which electricity is traded, and on its retail price.
This high cost of electricity has a strong impact on the Chilean economy's
competitiveness. Its immediate effect can be seen in the present competitiveness of the manufacturing industry, whose expensive outputs affect not only exports but also import-substitution activities. The effects of this competitive issue could range from the discouragement of investment in electric machinery that could increase productivity in small businesses, to a lack of development of added-value
manufacturing industry. An additional effect produced by high costs of electricity is the reduction of the Net Present Value of electricity-based projects in diverse industrial sectors like Transport, Agriculture, Manufacturing, or Services. This means that alternative solutions, which may not be as adequate, could be chosen just because of electricity's high price.
What is interesting about the Chilean case is that it has a huge potential for hydro and solar power, as well as great opportunities for wind and geothermal power too. This shows that Chile faces a problem much more complex than sitting supply and demand on the same table and making them talk. The solution requires a systemic approach considering all involved stakeholders in a holistic view, which generates a comprehensive value proposition based on needs, motivations, and capabilities.
The interest to develop that systemic view -applied to complex socio-technical problems- as well as the possibility of having access MIT's experience in Energy, were my main motivations to apply to MIT's Systems Design and Management Program3 for my Master's studies. My goal is to apply the combined knowledge of Energy and Systems to address some of the challenges of the Chilean power system.
12
Real concerns of utilities
The changes currently taking place in the electric power sector are unprecedented and might be the most disruptive changes in the last 50 years or so. New
developments in Distributed Energy Resources [DERs] and in Information and Communication Technologies [ICT], have led to the proliferation of Distributed Energy Systems [DESs] mixing the best of both technological fields. These new DESs are being utilized by innovative businesses, which articulate a series of value
propositions addressing previously unmet needs.
So, change is here, and traditional utilities acknowledge that they are standing on the "wrong side of the road" when talking about value creation and new profit opportunities. Even further, utilities understand that sticking to their upstream-of-the-meter business model, might cause a value migration to innovative business models, and that sales volume reduction might affect their revenues to a point where they may not be able to pay for their stranded assets' loans.
Faced with this unfavorable scenario, utilities -as ROI-maximizing companies4 -have been focused on three tasks: increasing incomes, decreasing expenses, and reducing risk. To increase incomes, they have been lobbying with regulators to get a fair (or sometimes "more than fair") regulation and remuneration, which is more suitable for new trends like penetration of residential distributed generation [DG]. To decrease expenses, they have been looking for cheaper energy sources. Finally, to reduce risk, some of them have been evaluating portfolio diversification by getting involved in new businesses emerging as result of the changing environment.
This thesis aims to understand the changing system's environment and to advise stakeholders of electric power systems [EPSs] on potential business models that might arise in the scenario of a large penetration of DESs in Chile.
The "Utility of the Future" project
A relevant factor for this thesis, which was vital for its development, was my
appointment as Research Assistant for the "Utility of the Future" project. Between the months of May of 2013 and January of 2014, I worked for this project of MIT Energy Initiative, in partnership with the Institute for Research in Technology (1IT) of Pontifical University of Comillas, and sponsored by ENEL5. This research gave me
the opportunity to share knowledge, points of view and resources with a select team of professors, researchers and professionals from the United States, Spain, and Italy.
The outcome of this experience was not only interesting insights into the specifics of my thesis research. It also provided me a broad view of different approaches used to address power systems' issues in different countries. This helped me comprehend the complexity of the electric power sector as a sociotechnical system whose long-term evolution is strongly driven, not only by technologies, regulation and business models, but also by consumers' needs and their not-always rational behavior.
The variety of ways in which the previously mentioned drivers can be combined in a particular power system, results in having optimal system's structures that are unique for each one of them. This means that technological solutions, innovative business models or regulatory best practices should not be exported from one geography to another without a sound analysis, as any singularity of a system might change drastically the objective function to be optimized.
Based on that last premise, I decided to analyze electric power systems from a scope broader than the usual technical approach, aiming to understand the social and technical systems involved in EPSs, their interaction and evolution. Then, after identifying the factors to be considered when introducing DESs into other systems or countries, I performed an assessment of the suitability of 8 businesses in the context of the Chilean EPSs' future envisioned needs.
5 ENEL: largest Italian electric utility (www.enel.com).
1.2 Research Approach and Thesis Scope
This thesis' research is based and inspired on what might be the most distinctive characteristics of the System Design and Management (SDM) program: holistic approach and systems thinking. Consequently, the applied research approach highlights the relevance of understanding the salient factors and stakeholders on the analyzed system as well as their interaction and dynamics. This also means going beyond the usual fields of engineering, acknowledging that the most
challenging systems usually are not just technical systems, but socio-technical ones. In practical terms, this approach tells us that, even when EPSs might have been historically analyzed through the lens of electrical engineers, they are in fact socio-technical systems. It can be seen that much of the complexity in electric power systems is not an effect of advanced technical or technological structures, but a result of the interaction with social systems, which involve users, regulators and markets. In such context, the relation with individuals, organizations and technical systems has to be addressed in the solution search process, no matter whether this interaction takes place inside the system boundaries or across them.
The paragraph above presents what should be the main drivers for the scope of this thesis, in order to be aligned with the research approach: focus on the Chilean electric distribution system's consumers and utilities, as its most salient
stakeholders upstream and downstream the meter, to whom DESs' integration may add more or less value by fulfilling their unmet needs.
Most of the theoretical background of the different parts of this research was acquired by the author during his graduate studies at MIT. Maybe the most relevant ones come form the "Utility of the Future" project, and from the following courses of the Engineering Systems Division: "Systems Architecture", "Systems Dynamics", and "Engineering, Economics and Regulation of the Electric Power Sector".
1.3 Objectives and Thesis Roadmap
As stated in the previous pages, the general objective of this thesis is to develop a systematic analysis of the socio-technical dimensions of electric power systems. This in order to assess Chilean EPS' stakeholders on the adequacy of different DES-related business models in a set of envisioned future scenarios.
The following paragraphs present each of this document's chapters and their particular objectives, serving as a roadmap of the thesis work.
Chapter 1 - Introduction
The objective of Chapter 1 -as it could be expected from an introductory chapter- is to present the author's motivations to develop this thesis, plus the basic information about the work's scope, research approach, structure and objectives. This chapter also aims to introduce some key concepts that are recurrently used in the electric distribution sector and in DESs.
Chapter 2 - Systems Approach to Distributed Energy Systems
Being EPSs complex socio-technical systems, System Thinking theories and tools must be part of the analysis, in order to generate a holistic
understanding of EPSs. Chapter 2 approaches this complexity presenting DESs, their different parts, the interactions between these parts, and
potential effects of DESs' introduction in the change dynamics of the EPSs as a whole. The objective pursued is to present a clear idea of the challenges and opportunities of DESs in the evolutionary process of EPSs. Besides presenting
DESs, this chapter aims to state their relevance in future power systems as entities that create value (and generate value migration) by addressing unmet need of consumers and other power systems' stakeholders. In that same direction, this chapter will present a framework to analyze DES-related business models and their value propositions.
Chapter 3 - Distributed Energy Systems in the Chilean Electric Power Sector Chapter 3's objective is to present an overview of Chile, its electric power sector, and in particular, the distribution-end of Chilean EPS. This
information will set the context for the theoretical analysis of the
introduction dynamics of DESs in the Chilean context. Based on a Causal-Loop diagram6 presenting the Chilean context of the DER/DES Consumer Adoption dynamics, the goal will be centered in identifying the factors and particularities that could affect the implementation and adoption of DESs, given the current trends in consumer needs, technology development, and regulatory innovation, etc. Once the factors that more likely affect DES implementation are identified, a set of foreseeable scenarios will be generated in order to evaluate the different DES-related business models, which will be presented in Chapter 4 and evaluated in Chapter 5.
Chapter 4 - Business Modelsfor Distributed Energy Systems
As a combined outcome of Chapter 2 and Chapter 3, this chapter identifies those systemic characteristics that should be drivers of change in the future Chilean context. Then it envisions how different evolutions of those drivers could generate different scenarios and needs. The goal then for Chapter 4, is to present and analyze 8 DES-related business models, trying to assess their suitability to fulfill the needs of the envisioned scenarios presented in
Chapter 3. The analyses will be based in the framework introduced at the end of Chapter 2. Chapter 4 will also present the trends and commonalities that could be identified among the 8 business models, as well as an overview of the challenges or constraints that they must overcome in order to be successful.
Chapter 5 - Business Models Evaluation
Based on the scenarios derived from Chapter 3, this chapter will perform a qualitative/quantitative analysis of the business models' list presented in Chapter 4. This analysis will be based on the Pugh Method, a decision-making method commonly used in Systems Architecture and Systems Engineering as concept selection tool to manage qualitative data. The objective is to assess their viability and adequacy to the Chilean context, ranking their comparative performance in each of the needs required by the envisioned scenarios. The outcome of the analysis would be the identification of the business models that seem more likely to succeed in the envisioned future of the Chilean electricity distribution system.
Chapter 6 - Conclusions and Recommendations
The final task of this thesis is to generate a set of conclusions and
recommendations regarding the integration of DESs, which could be helpful to maximize the value added by DESs' integration to the system as a whole. The conclusions may not be limited to the context of the Chilean EPS, as they should refer to the interaction between technology, business models,
regulation and customers needs in dynamic socio-technical systems like electric power distribution systems. Recommendations will be centered in advising consumers, DES administrators, DES entrepreneurs, utilities and regulators regarding best practices in DES and DES-related business models' implementation in the Chilean EPS.
1.4 Acronyms and Definitions
Throughout this document a list of acronyms and concepts will be recurrently utilized. As these may be related to electric power systems, distributed energy
systems, Chilean entities, etc. that the reader might not be familiar with, this section presents most of them. Table 1-1 below present this list of concepts, along with their acronyms and either examples or very short definitions.
Chapter 2 - Systemic Approach to Distributed Energy Systems
2.1 Distributed Energy Systems (DESs)
What is a Distributed Energy System?
A necessary definition for developing a systemic approach to DESs, is to deeply
understand what a DES is, how it is configured, and how it interacts with its stakeholders and neighboring systems.
A DES, as defined in "The MIT Utility of the Future -Phase I Report" (Bharatkumar et al., 2014), is a system "combining one or more distributed energy resources (DERs), including distributed generation, distributed storage, and/or demand response, with information and communication technologies (ICTs) to enable a business
model that provides valuable services to energy end users or upstream electricity market actors." Figure 2-1 presents 4 different topologies for DESs.
Figure 2-1: Different DES Topologies
Depending on the function to be performed, the design of the DES should define not only the topology, but also what combination of technologies will be present in that configuration. The next subsection presents the different layers of DES technologies and their function in the DES.
Distributed Energy Systems' Components
Depending on their function in the system's output, DES technology components can be grouped in three layers. A graphical representation of this organizing scheme, from the UoF research (Bharatkumar et al., 2014), can be seen in the Figure 2-2.
Input delflned by Business Model B !
Systems Environment inssewaft L ow..
Layer 3: D~ii~~k,, I
Intelligence0 )I
Layer 2: nioigad Dt oet-U
Communications aign.'n 10,(M .W
Layer 1: Physical
Parts of Distributed Energy Systems (DES) Parts of Traditional Power and Telecom Systems
Figure 2-2: Layers of DES Technologies
Layer 1 involves most of the physical components and the infrastructure of
incumbent electricity and telecommunications networks, plus DERs. This layer is an aggregation of loads, wires7 and DERs, and doesn't require other layers to deliver value. However, its value is significantly increased when adding layers 2 and 3. Layer 2 and layer 3 include all the ICTs added up to DERs in order to enable DESs. Layer 2, Communications layer, considers sensing, collecting and managing data, as well as the capability to remotely control DERs. Layer 3, the Intelligence layer, adds the brain to the system, analyzing internal and external (to the system) data in order to generate control decisions to be sent to DERs.
As it can be inferred from Figure 2-2, most of the value creation of DESs -above that of DERs- is based on the synergy achieved by involving ICT capabilities of remote sensing, data management and remote control. These new capabilities will show an even higher relevance in the future, as they provide tools to address the new needs and requirements imposed by the system's environment.
Distributed Energy Systems in the Grid
Now that DESs and its components have been defined and identified, a good question to make should be "Why do we need DESs?" or, in other words, "What value do DESs add in the electric power system?"
The answer to this question is strongly related with the concept of value, as value is delivered or created when an unmet need is fulfilled8. As would be explained in the
following section, electricity end-users needs' evolution is affected by the EPS's dynamics and system's environment. This dynamic relation has been creating new consumer needs that EPS's current structure does not seem well suited to meet at the required pace. In this context, DESs present a flexible and often more affordable way to fulfill those needs. To clarify which are those needs, Figure 2-3 shows a scheme for these basic needs, some of which are shared by consumers and utilities.
ELECTRICITY RELATED NEEDS
* Consumy's Needs a
Figure 2-3: Electricity Related Needs
Different configuration of DESs can certainly add value to consumers and utilities by addressing the needs listed in the previous images. For instance, DG could provide energy availability to consumers and (in some cases) frequency balance to utilities. DR could also help utilities to provide availability to consumers. Finally, DS and EVs could provide variable cost stability, resilience and recovery.
22
2.2 The Expected Role of DESs in Electric Power Systems' Dynamics
The 3-Layers' diagram of Section 2.1 showed a relevant feature that was not commented in that section. This is the input of business models and other factors that determine the systems' environment -like regulation, market structure, etc.
-on the decisi-on making process of the Intelligence Layer. This input, and particularly its dynamic nature, should be a crucial consideration when trying to determine the evolution of the system and the future context of DESs when integrating to the grid.
To better understand this interrelation, a Causal-Loop diagram -based on the concepts of Systems Dynamics theory- is presented in Figure 2-4. The analysis of such diagram tells us -as it was stated in the introductory chapter- that change is already here. As social systems evolve, incumbent firms in the power sector -for many years ignorant of disruptive changes- find themselves in an uncomfortable position where they seem forced to change in order to survive in the new
environment. Sociotechnical systems -like power systems- have always been dynamic, but new change drivers have increased their evolution rate to a point where simple adaptations of the existing business models and regulation are not enough to keep the pace.
One might argue that the nature of the relationship between technologies, regulations, business models, etc. has always been dynamic. However, today the main change driver is the "social" part of this sociotechnical system. Factors historically considered exogenous to the system, like environmental awareness or connectivity, are rapidly transforming end-user needs, and as an effect, increasing the change rates at which the system evolves.
A takeaway from the previous paragraphs is that different rates of change or
adaption to change present in this dynamic system should be addressed differently, as the traditional business models and regulatory frameworks might not be able to change at a rate adequate enough to keep the pace of consumer needs' evolution.
Businen Tdo Bmsi Bu*"l"e EB tm D ka Moe by FNamFUlMwM by radiional Busmmues vby Coswn.Lo ooam o Lop- Tchlugy Loop noae U~nfblfilod More unfulfilled needs create more business opportunities, which can be executed in the traditional way or through business model innovation. The traditional execution might fulfill some needs, and develop new technology. When people get used to technology, it creates even more unfulfilled needs. If the business opportunities were tacIded through business model innovation, it will require an adequate regulatory framework to be able to be executed. Its execution will also fulfill some needs and develop technology, which will also create some more needs. The difference is that the rate in which innovative business models meet unfulfilled needs is much faster than that of traditional business models. The goal then might be add agility to the Regulatory Innovation Loop, so that an adequate regulatory framework levels the field for innovative business models to add value by meeting needs that the current business models are not being able to fulfill.
2.3 DES Business Models Analytic Framework [BMAF]
The previous section presented the importance of the role of business model
innovation on the fulfillment of new stakeholders' needs. In order to have an idea of what do DES-related business models look like, this section will introduce a
framework to analyze these business models, characterizing them by the need they aim to fulfill, the technology mix they apply, and their "business model attributes" (a concept that will be explained in Figure 2-5).
Business Model Attributes
Definition from the MIT Utility of the Future Phase I Report (Bharatkumar et al., 2014)
"... based on the economic activities that exist in electric power systems, we have defined five core "attributes" of business models that represent, at the highest level, the principal configuration of business models within this industry.
An attribute represents a combination of characteristics of the business models incorporating both the level of financial commitment and the future focus of the stakeholder..."
"At the highest level, attributes of the business model are that a stakeholder may:
* Own assets;
* Operate assets and/or systems of assets; * Fund the acquisition or the operation of assets; * Provide Information to asset owners or operators; or * Build or manufacture assets."
Figure 2-5: Business Model Attributes
The Causal Loop diagram of Section 2.2 (Figure 2-4) -and particularly the three loops at the left- depict the strong and direct relation between needs, technology and business models. The BMAF is based on that relation, and characterizes
business models based on their representation in two matrices: a first one relating business model attributes and DES technology components, and a second one relating business model attributes and the needs that the business model aims to address.
"Matrix 1": Business Model Attributes vs. DES Technology Components The first matrix -relating business model attributes and DES technology
components- indicates the suitability of each of the DES technologies to be used by each of the business model attributes. In greenfield projects, this matrix can be used to decide what DES technologies to develop given the business model attributes that best fit the organization, or to decide what segments of the value chain should be developed if developing a given DES technology. In the case of brownfield projects, the matrix is mostly used to assess the positioning of the project, and look for synergies that can generate expansion opportunities for the project or its competitors. A version of this "Matrix 1" can be seen in Table 2-1 below.
Table 2-1: BMAF's "Matrix 1"
Owiulot" DWgWbuW Desuad aid
Gaft"WVdiM %1k nON "al
0"gadi X ?b 0PW / I/ Vap Fmid // v 1 X X FWi P O~Nn*m / - / / t C Pw*k6nte td V/ / 7 V/ saw V
In the main section of the matrix, a checkmark means that the technology is a good fit for that business model attribute; a cross means that it is not a good fit; and a question mark states that the fit is unclear. For instance, owning electric vehicle infrastructure seems to be a good opportunity, owning demand response equipment doesn't, and the opportunity of business models based on owning ITC is not clear. The triangle at the right of the matrix shows the potential synergy that attributes might have when being combined. It uses a check mark on synergy options, a dash on no-synergy options, and a cross if there is contradiction between the business model attributes. In this case, there are synergies between owning and operating, no synergies between funding and providing information, and contradiction between funding and owning (as it is not logic to profit from funding your own acquisitions).
"Matrix 2": Business Model Attributes vs. Consumer and Utility Needs
The second matrix used in the BMAF relates business model attributes to the basic electricity-related needs (presented in Section 2.1) that they aim to fulfill. Working with this representation can help to understand where, if somewhere, a business
model can add value by fulfilling the potential unmet needs of a stakeholder. The example of this "Matrix 2" shown in Table 2-2 below could be showing the value of a business model where a company builds ICT devices like Home Energy Management
Systems, enhanced with information services to utilities. The ICT devices save energy and money, but they also handle data that could be used to provide utilities with information to optimize their hourly generation mix, allowing a better use of renewables. Consumers might be willing to share this information as they could receive a payment, while knowing it helps the penetration of large-scale renewables.
Table 2-2: BMAF's "Matrix 2"
Mcu .ec -esnyLmsattsam 3wkrmuir haw
Accenn EmrbarmavaW anoumn
MAqmwy RfuU~IY tow Upfwf to&SWft Afbordabt Csnsu*6s.
fpquw Vbb Cot__kdaf
These two matrices, when aggregating on it all industry competitors, could be used too to visualize, among others, what technologies is the market using to provide services, and how different services can fulfill different or similar needs.
Having presented the basics of the systemic approach used in this assessment and a framework to analyze business models on DESs, the next step is to understand the particularities of the Chilean context, in which the DESs performance will be evaluated. This will allow us to generate scenarios that will determine how to measure the performance of each business model.
Chapter 3 - DESs in the Chilean Electric Power Sector
3.1 Chile: Geography and Economics
Chile is a 17-million-people country located in South America's south cone. Its particular long and narrow shape going 2650 miles from north to south between the Andes Mountains and the Pacific Ocean provides the country many different
landscapes that are both a blessing and a challenge for Chilean people. Besides having an exceptional potential for tourism, the variety of climates and the natural configuration that are present in Chile provide a rich source of mineral, hydro and forestry resources. However, its extreme geography, its high levels of seismicity and its lack of hydrocarbons, bring considerable economic challenges that are a burden in Chile's path to economic development.
Regarding its economic policies, Chile has a market-oriented economy characterized
by a high level of foreign trade and a reputation for strong financial institutions and
sound policy that have given it the strongest sovereign bond rating in South America (Central Intelligence Agency, 2013). The government's role in the economy is mostly limited to regulation (U.S Department of State, 2013).
Having Chile such diverse landscapes, it is really difficult to describe it
geographically and economically as a whole. Consequently, the paragraphs below will analyze it using the following discretional subdivisions: northern region, central and southern regions and Patagonia & austral regions.
The Northern Region
The 500 northern miles of the country is a zone known as the location of one of the world's driest deserts: Atacama. This region, which limits north with Peru and East with Bolivia and northern Argentina, hosts most of the mining operations in the country. The Chilean copper industry controls more than one third of the world's
market (Comisi6n Chilena del Cobre [Cochilco], 2013), having reserves of 190 million tons (USGS, 2013), which is 28 percent of known copper reserves in
existence. Chile also shows similar figures in lithium mining, generating 30 percent of the profits on lithium sales, while having 23 percent of the world reserves (2nd
place worldwide, after Bolivia). But not only mineral resources can be found in the north, as it is also known to have one of the best settings for solar energy, with daily solar global horizontal irradiance [GHI] of 7 kWh/m2 in the Antofagasta Region
(OECD, 2013).
The challenges for northern Chile and its mining-related economy are mostly related with water and energy management. Mining industry is a large consumer of power, accounting approximately for 90% (CNE, 2013b) of the total consumption from northern Chile (over 17 TWh). Despite the huge potential for solar energy, and due to the low costs of thermal, nearly 99% of the demand is being supplied by thermal units (CDEC-SING, 2013).
Water management is also a relevant issue, as water is also needed for mining processes and cooling of thermal units. Then, two water related processes increase energy demand: energy required for desalination, and energy required for pumping water to the mountain areas were most of the mines are located.
The Central and Southern Regions
The next 1300 miles of the Chilean territory are the central and southern regions. With a temperate climate having sharp regional contrasts, it is the home of about
15.5 of the 17 million habitants of the country (about 6 million of them in Santiago,
Chile's capital city) (INE, 2013). Consequently, this region concentrates most of Chile's commerce, agriculture, forestry, fishery, livestock and services activities. These regions also have most of the operating hydroelectric plants and some relevant geothermal resources (especially in the southern region).
From an economic standpoint, the challenges for the central and southern regions are the ones that represent the Chilean society as a whole, and are mostly related to growth management. In the last thirty years the Chilean economy has grown
significantly and its benefits have started to reach common people. With an enhanced access to education, credit, goods and services, people have began to increase their consumption and productivity, reinforcing the economy growth loop. The flip side of this accelerated growth is that it may lead -as it did in Chile- to high rates of social inequality, where people started demanding their stake on the profits: free access to higher education, improved healthcare, higher salaries, etc.
Additionally, higher consumption -combined with an at least sub-optimal capacity expansion process- led to increased energy prices, which are among the highest in Latin America. In this context -where government increases public expending, workforce gets more expensive, and electricity price for industry is extremely high9- the country's competitiveness is harmed, as most other countries in the markets where Chile competes have lower operational costs.
Patagonia & Austral Regions
The southern 850 miles of the country is a particularly beautiful and cold land, known to host the western section of Patagonia. Due to the harsh climate and extreme geography present in these regions, its aggregated population does not exceed 0.3 million people, some of whom are widely dispersed in areas with a difficult access. These regions' economy is based on tourism, livestock farming and forestry. They are also rich in energy related natural resources, like coal, biomass, some oil & gas and large hydro resources. This scenario provides what are
sometimes conflicting opportunities -like tourism and forestry- and defines the challenges for this zone, mainly in keeping an adequate balance between economic development and respect for the ecosystem.
9 The electricity marginal cost for the period Dec 2012 - Nov 2013 in Chilean main power system (Alto Jahuel 110 kV) had an average and a median of 163 US$/MWh, having 34% of the daily averages above 200 US$/MWh (Source: www.cdecsic.cl)
3.2 Chilean Electric Power Sector
Electric Power Systems in Chile
The subdivisions of the Chilean territory utilized in the previous section were not randomly chosen. They correspond to the four main power systems of the country, called "Interconnected Systems" as they are formed by the interconnection of a group of smaller grids, but these "Interconnected Systems" are not actually connected among them (see Figure 3-1 on next page).
The power system that serves northern Chile is the SING, which is an acronym for Sistema Interconectado del Norte Grande, Spanish translation for Northern
Interconnected System. The Chilean National Energy Commission informed that by the end of 2012 the SING had over 4.1 GW of installed capacity and over 4,000 miles of transmission lines (>23kV) to serve yearly electricity sales of nearly 14.8 TWh, with generation production peaks of up to 2.1 GW.
The central and southern zones of Chile are served by the SIC, acronym for Sistema Interconectado Central, Spanish translation for Central Interconnected System. This is the largest power system in Chile and by the end of 2012 it had over 13.3 GW of installed capacity and nearly 12,000 miles of transmission lines (>23kV). In 2012 the SIC served yearly electricity sales of about 46.2 TWh, with generation peaks of up to 7 GW.
The Patagonia region is served by the Aysen Interconnected System that, by the end of 2012, had 46.7 MW of installed capacity to serve yearly electricity sales of 148.3 GWh, with generation peaks of 25,5 MW. The austral region is served by the Magallanes Power System -composed by 3 medium size non-connected grids: Puerto Natales, Punta Arenas and Porvenir- that, by the end of 2012, had 103.4 MW of installed capacity to serve yearly electricity sales of 277.8 GWh, and generation peaks of 50,6 MW (CNE, 2013b).
Four
Main
Chilean
Electric
Pow
Systems
and
Geographic
Distribution
of
Generation,
Consumption
and
Population
SING tNrchern System) Gx: >4.1 GW of installed capacity, producton ceqksof 2 1GW Tx: > 4,0 miles of transm ission lines 2>23kV) Ox: nearly 14 8 TWh of soles SIC (Cer tra Sys tem Gx> 1 3.3 GW of insta e capacit y, produciun peaKs of 7 GW Tx: nearly 12,0 miles of transmission lines (>23kVj Ox: about 46 2 TWhof soles Ayskn System Gx: 46.7 MW of installed capacity. producton peaks of 25 5 MW Ox: 143 GWh of sales Magallanes Systerr Gx: 103.4 MW of installed capacity. rp n mpca ofs 5. 6 MW Dx 277 8 G of sales Arica yParinacata Tarac Aitofagastm Atac-ama
-- -Valparalso Metwoltans de Sarmago Sloso a Araucania Los Rios LOs LACMs AysEn Masallanes v Anthrfta
{
-I --U--
--
I
ji
xG
Map by Google* Data from NE anc CNE o~. -I 0 ~1 0Structure of the Electric Power Sector
Chile is known for being, after the reforms that took place in 1982, a pioneer in electricity market's deregulation. The current structure of the Chilean electric power sector is primarily defined by the regulatory changes performed in 1982,
plus some additional regulatory changes that took place starting in 2005 ("Ley Corta" or Short Law and other decrees). In general terms, the Chilean electric power sector is characterized by its 100% private, vertically and horizontally unbundled players, who take part in three0 segments of the value chain: Generation,
Transmission and Distribution.
The Generation segment is characterized for being a competitive market -with no central planning for capacity expansion- that has clear scale economies on its operational costs and where prices tend to reflect the marginal production cost. Generators are remunerated by their energy output (MWh) and by the capacity (MW) they provide for the systems adequacy. Energy can be sold to distributors (regulated price), to large consumers (unregulated wholesale price), and to other generators (spot price set by marginal cost of transfer).
The Transmission segment in Chile involves every line and substation having a voltage over 23 kV. Transmission is open to access by generators, meaning that they can impose their right to use the available capacity of a line through the payment of tolls.
Generators and consumers share the toll payments for Transmission.
The Distribution segment operates under a public service concession regime, with an obligation to provide service on geographic concessions. Distributors buy energy from generators though public bidding processes and get remunerated by consumers' VAD (Distribution Added Value) (CNE, 2013b).
10 Sub-Transmission will be considered as a special case of Transmission. These systems are formed
by substations and lines that are connected to the grid and their sole purpose is to supply exclusively
Regulatory Entities and System Operators
The three previously mentioned segments interact following the market rules indicated in the Law of Electric Services (DFL1). In order to keep this system relatively free of market frictions and complying with Chilean laws, the Chilean government developed a framework involving different entities like the Ministry of
Energy, the National Energy Commission (both governmental agencies), and the Economic Load Dispatch Centers (independent entities, one for the SING and one for the SIC).
The role of the Ministry of Energy is to elaborate, coordinate and enforce the plans, policies and norms for the correct operation and development of the electric power sector. It is also the role of this Ministry to advise the government in all those subjects related to energy (Ministerio de Energia, 2013).
The National Commission of Energy (CNE) is a technical entity whose role is to analyze prices, tariffs and technical norms to whom the electric utilities should stick in order to assure a sufficient, safe and high quality service, compatible with the most economic operation (CNE, 2013).
The main function of the Economic Load Dispatch Centers -known as CDECs, from the Spanish term Centro de Despacho Econ6mico de Carga- is to dispatch
generators minimizing operational costs in pursue of the highest economic
efficiency for the system (AES, 2008). As previously mentioned, both the SIC and the
SING -who added represent more than the 99% of the system's generation-,
dispatch their generators through their own CDECs.
CDECs also provide valuable information for the financial transactions in three cases: between generators for energy balances (those that had to honor power supply contracts but were not dispatched have to pay at spot price to those who actually were dispatched), between generators for capacity balances (related to
capacity payments for contributing to the systems sufficiency), and between line owners and toll payers (for the use of the lines).
A representation of the structure of the Chilean electric power sector, displaying its
main direct stakeholders and the way they interact, can be seen in the diagram below.
Current Chilean Electric Power System
Customers Utilities Regulators and System
Operators
T9 P11r'te r1r:c/IPA
su-pansmaMo wad deizewatetv ound from the e",rar as for thpupo5 uc m1 et de a a caeof transmisucft
f ftl cu t where subk rarnsm siw s amned bytne Rataw r/D5O, the Rtaier/D5G recetwed the paymetw aft then pay the wresponnamg tak.
3.3 Distribution-End of the Chilean Electric Power Sector
Power distribution grids are formed by a network of lines and substations that transport electricity from the primary substations that act as coupling points with the transmission grid, to consumers. In these primary substations voltage is reduced to 23, 13.2, or 12 kV depending if the end user is industrial or residential. In this latter case, a secondary substation will again lower the voltage, now to low-tension standards, which in Chile are 220 V and 380 V, monophasic and triphasic
respectively (CNE, 2013c).
The infrastructure related investments for power distribution shows a certain level of indivisibility and density economies, particularly when referring to the capacity of electric equipment like wires and transformers, the supporting structures, and the rights-of-way that have to be obtained in order to access demand. With that in mind, optimal design implies considering an adequate level of slack when investing in equipment, particularly in those assets having long service life (CNE, 2013c).
In this context, where a standard distribution utility has a very long position on long-life fixed assets, usually financed by long-term debt, the sufficiency of the remuneration is vital for the company financial survival. This remuneration to the distributor is paid by consumers in the VAD (acronym of Valor Agregado de Distribuci6n) or Distribution Added Value. As was indirectly mentioned along the text, regulated clients pay the VAD in their monthly bill, along with their energy consumption (kWh), their share of the Transmission Toll, and other distribution services like metering, reconnections, etc.
The funds provided by the VAD have to be enough to cover the expenses related to the system operation (follow up and control, damage correction, and incidents), system maintenance (of lines, substations and protection equipment), and business management (measurement, meter reading, billing, contracts, etc.). A broader vision
of the uses of the VAD can be seen in Figure 3-3 taken from a presentation by Professor Hugh Rudnick (2009).
Distribution Value Added
Fixed costs " Meter readng -Bing " Distribution of biNs * AccoWitng related to cient -Bll oOW up " Cient relation
" Other fixed costs related to cient
lwestnent costs, Operation & Maintenance
Catal Ted
costs costs
-stoag *Worksas
HV LV 4.b
High Voltage Low Voltage *Trn
-Feeders -Distibuion *TSeuq
- Conbol Secti
" Control substations
ERent, I
equipnent -LOW volag *Netwo
.P on networks meratK
ege t-: *Protetion APateAt
equorent
Figure 3-3: Distribution Value Added (Rudnick, 2009)
istribton losses Inical te e hops ndkM~ oniengineel"n Ly nsurance rk inaktenance and
sand property taxe
3.4 Integration of DESs under the Current Scenario
Now that the current scenario that Chile presents for the integration of DESs has been described, the purpose of this section is to identify the factors that might positively or negatively affect this integration process. In order to do that, we must understand the dynamics of this integration process, particularly the causality
interrelation between the involved factors.
Probably the simpler way to develop a systemic view of the DES integration in Chile is through a Causal-Loop diagram, taken from System Dynamics' theory, like the one presented on Figure 3-4.
j
(
IP
M
+IS
111
+Jj
+
f ! 3a+
+ +~I
ii
rj
Li.
IJ~
Figure 3-4: DER/DES Consumer Adoption Dynamics for the Chilean Context
I
I
is
I.
I
6
a
38The diagram of Figure 3-4 represents the dynamic effects in the system through 7 loops and 4 non-loop variables, which affect DES consumer adoption. In order to characterize these dynamic effects, they were grouped depending whether they involve technology-related factors, regulatory factors or socio-economical factors.
Effects Involving Technology-Related Factors
Technology Improvement Loop:
The increase of DER-DES adoption will produce a maturation process in technologies (learning by doing). It will also encourage R&D investments, as
its costs will be shared by a larger number of units. Maturation and R&D will lead to Performance Improvements, which will make products more valuable
for end-users. The more valuable to end-users the products become, the more their adoption increases, generating then a reinforcing loop.
Technology Cost Loop:
Similar to the previous Loop, the technology cost loop increases consumer adoption by increasing DER-DES valuation. The difference here is that the valuation is increased because of the scale economies' lower costs achieved
by larger DER-DES consumer adoption. This is also a reinforcing loop.
Valuation of Unfulfilled Needs Met by DERs-DESs:
This factor brings to the system a relevant issue: In a scenario of higher penetration of intermittent generation at a grid level, which also has more frequent outages due to imbalances or climate/weather causes, DES could provide islanding capabilities, power supply reliability or even ancillary services. Then the consumer adoption of DER-DES will increase if the value of the provided services is considered by the end user higher than its required investment and operational costs.
Effects Involving Regulatory Factors
Distribution Utility Revenue Effect on Tariffs Loop:
As DER-DES Consumer Adoption increases -all other variables remaining constant-, the total power purchased from the grid decreases. Then the collection of the volumetric toll for distribution will be lower, harming the Distribution Utility Revenues. This is more relevant in those tariffs where most of the charges are volumetric (as the low tension BT1 tariff for
residential customers in Chile). Sooner or later, if there are no modifications to the tariff structure, the lower revenues for distribution utilities will make the per-unit Cost of Grid Electricity to Consumers to increase, incentivizing DER-DES Consumer Adoption, as their relative cost will be lower than before. This is a reinforcing loop.
Transmission Utility Revenue Effect on Tariffs Loop:
This is also a reinforcing loop, which follows the same logic of the
Distribution Utility Revenue Effect on Tariffs Loop, but in this case the effect is related to the collection of volumetric tolls by Transmission instead of Distribution utilities. Then, the less power is bought from the grid, the lower the collection and revenue for transmission companies and the higher the tolls will turn (to recover the investment). Then, as the final cost of grid electricity will be higher, consumers will have more incentives to adopt DER/DES technologies.
Wholesale Electricity Prices Loop:
The fall in Power Purchased from the Grid due to DER-DES Consumer Adoption increases will cause a fall in Wholesale Generation Volume,
meaning lower revenues. These lower revenues will translate into a negative financial outlook for the generator (from the standpoint of banks and
creditors), which will increase the generator's cost of capital. This higher cost 40
of capital will be reflected, with some delay, in Wholesale Electricity Prices. Higher wholesale prices imply that sooner or later (depending on the
contracts or if referring to regulated consumers that face prices set on 5 year period bids) there will be higher Cost of Grid Electricity to Consumers, which will then mean higher DER-DES Consumer Adoption. This is also a
reinforcing Loop.
Marginal Generation Cost Loop:
Highly related with the Wholesale Electricity Prices Loop, this is a balancing
loop that reflects the fact that a lower Wholesale Generation Volume will mean a lower Marginal Generator's Production Cost, and lower Wholesale Electricity Prices. Lower wholesale prices imply (with the same delay explained in the Wholesale Electricity Prices Loop) lower Cost of Grid
Electricity to Consumers. A lower cost of electricity to consumers connected to the grid will discourage the adoption of DER-DES. This is the only relevant balancing loop present in the system.
Regulatory Adequacy for DES-DER:
As explained in Chapter 2 of this thesis, in order for Innovative Business Models (like the ones involving DES-DER technologies) to be able to fulfill unmet stakeholders' needs, it is imperative to have an adequate regulatory framework. This variable reflects the fact that inadequate regulatory frameworks can slow down or completely stop DER-DES adoption, if it
doesn't react in time to allow the technology, or constrains the connection to the system.
Effects Involving Socio-Economic Factors
Distribution Utility Costs Effect on Tariffs Loop:
One direct effect of DER-DES Adoption is the Change in Grid Usage Profile. Whether that change is positive, negative or a mix of both is unknown as it will depend on the mix of DER-DES technologies that are adopted, but for sure adoption will increase change. This uncertainty about behavior of the grid usage profile is then transferred to the Distribution Grid Costs.
Distribution costs may increase, but there is no reason to assume that they won't decrease. In this context it is unclear if this is a reinforcing or a balancing loop, but what is clear is that this uncertainty presents an
opportunity and a challenge for new regulatory structures that work in both cases.
Financial Incentivesfrom Government, Utilities or Aggregators:
This variable reflects the inputs of stakeholders that might be benefited by DER-DES adoption, and that may give financial incentives to promote that trend. Obviously, the larger the financial incentives, the higher the DER-DES consumer adoption rate.
Socio-Economic Adequacy of Business Models:
DESs' rate of adoption will also depend on the existence on competitive business models that add value to the system and that are suitable for the socio-economic or cultural context. For instance, DES-related business models that require sharing consumers' load profiles, might not be adequate for societies that give an extreme value to any kind of private information. In that context, inadequate business models could produce low, or even null, rates of adoption. The more adequate the business model is to the socio-economic context, the higher the DESs' rate of adoption.