HAL Id: hal-00408544
https://hal.archives-ouvertes.fr/hal-00408544
Submitted on 3 Feb 2021
HAL is a multi-disciplinary open access
archive for the deposit and dissemination of
sci-entific research documents, whether they are
pub-lished or not. The documents may come from
teaching and research institutions in France or
abroad, or from public or private research centers.
L’archive ouverte pluridisciplinaire HAL, est
destinée au dépôt et à la diffusion de documents
scientifiques de niveau recherche, publiés ou non,
émanant des établissements d’enseignement et de
recherche français ou étrangers, des laboratoires
publics ou privés.
ULF waves in the Io torus: ULYSSES observations
Naiguo Lin, P. J. Kellogg, R. J. Macdowell, Y. Mei, N. Cornilleau-Wehrlin, P.
Canu, C. de Villedary, L. Rezeau, A. Balogh, R. J. Forsyth
To cite this version:
Naiguo Lin, P. J. Kellogg, R. J. Macdowell, Y. Mei, N. Cornilleau-Wehrlin, et al.. ULF waves in the Io
torus: ULYSSES observations. Journal of Geophysical Research Space Physics, American Geophysical
Union/Wiley, 1993, 98 (A12), pp.21151-21162. �10.1029/93JA02593�. �hal-00408544�
JOURNAL OF GEOPHYSICAL RESEARCH, VOL. 98, NO. A12, PAGES 21,151-21,162, DECEMBER 1, 1993
ULF Waves in the Io Torus' Ulysses Observations
NAIGUO
LIN,
1 P. J. KELLOGG,
1 R. J. MACDOWALL,
2 Y. MEI,
a N. CORNILLEAU-WEH19.LIN,
4
P. CANU,
4 C. DE VILLEDARY,
4 L. REZEAU,
4 A. BALOGH,
5 AND R. J. FORSYTH
5
Throughout the Io torus, Ulysses has observed intense ULF wave activity in both elec- tric and magnetic components. Such ULF waves have been previously suggested as the
source of ion precipitation leading to Jovian aurorae. The peaks of the wave spectra
are closely related to the ion cyclotron frequencies, which is evidence of the waves being
ion cyclotron waves (ICWs). Analysis of the dispersion relation using a multicomponent
density model shows that at high latitudes (~ 30ø), peak frequencies of the waves fall
into L mode branches of guided or unguided ICWs. Near the equator, in addition to the
ICWs below
fcO++, there
are strong
signals
at ~10 Hz which
require
an unexpectedly
large energetic ion temperature anisotropy to be explained by the excitation of either con- vective or nonconvective ion cyclotron instabilities. Their generation mechanism remains open for the future study. Evaluation of the Poynting vector and the dispersion relation
analysis suggest that the waves near the equator had a small wave angle relative to the
magnetic field, while those observed at high latitudes were more oblique. The polariza-
tion of the waves
below
fcH+ is more
random
than
that of the whistler
mode
waves,
but
left-hand-polarized components of the waves can still be seen. The intensity of the ICWs both near the equator and at high latitudes are strong enough to meet the requirement for producing strong pitch angle scattering of energetic ions.INTRODUCTION
The ultralow frequency (ULF) waves of interest here
are the waves near and below the local ion cyclotron
frequencies. The existence of these waves in the Jo-
vian magnetosphere has received attention [e.g., Thorne
and Moses, 1983, 1985; Gumeft and Goertz, 1983; Mei
et al., 1992] because it may account for the depletion of energetic particles in the Io torus [Krimigis et al., 1979] and the excitation of extreme ultraviolet emissions observed by Voyager i [Broadfoot et al., 1979]. Such
low-frequency waves, most likely ion cyclotron waves
(ICWs), could be the waves required to scatter energetic
ions into the loss cone at the strong pitch angle diffusion limit and cause strong ion precipitation into the auroral
zone. Thorne and Moses [1983, 1985] noticed that the
ICWs with a frequency above the oxygen gyrofrequency
could be excited strongly at high latitudes (> 15 ø) and
would be damped by ion cyclotron damping when prop- agating toward the equator.
More recently, Mei et al. [1992], using realistic plasma
parameters, have given a complete evaluation of convec-
x School of Physics and Astronomy, University of Min- nesota, Minneapolis.
2NASA
Goddard
Space
Flight Center,
Greenbelt,
Mary-
land.
aDepartment
of Atmospheric
Sciences,
University
of Cal-
ifornia, Los Angeles.'tCentre de Recherche en Physique de l'EnviroImement, Centre National d'Etudes des T616communications, Issy les Moulineaux, France.
5Imperial
College
of Science
and Technology,
London,
United Kingdom., Copyright 1993 by the American Geophysical Union.
'Paper
number
93JA02593.
0148-0227/93 / 933 A-02593 $05.00
five growth of ICWs at all frequencies below the proton
gyrofrequency in the entire Io plasma torus by wave ray
tracing. They found that there are preferred regions of
instability for the ICWs at different frequencies in the Io
torus: (1) The waves
between
the proton
and oxygen
gy-
rofrequencies (~10 Hz) grow only marginally and only at higher magnetic latitudes (A > 15ø). They are confined
to magnetic shells near L - 8. The path-integrated gain
of these waves is very sensitive to the plasma parame-
ters. (2) The waves with lower frequencies (below the
O + gyrofrequency,
leo+) may
experience
strong
growth
at the equator. They can propagate to high-latitude re-
gions without damping until absorbed by thermal heavy
ions.
While the ion cyclotron instability in the Earth's mag- netosphere has long been observed and widely studied
as Pc I and 2 micropulsations (see, for example, Kennel and Rouz et al. [1982]), there have been only a few
observations of Jovian ULF waves. Thorne and Scarf
[1984] reported an enhancement in wave activity ob-
served by Voyager 1 while traversing the Io torus, and the wave intensification was strongest in the frequency
range below the proton gyrofrequency. Although the ob-
served average wave intensity was typically an order of magnitude smaller than the strong pitch angle diffusion limit, the authors interpreted the wave activity as evi- dence for the possible existence of strong ICW sources at higher latitudes which were not reached by the space-
craft.
During the Ulysses flyby of Jupiter on February 8, 1992, the spacecraft passed through the Io torus from north to south traversing a large range of magnetic lat- itudes. It provided an opportunity to observe waves at high latitudes which had not been reached previously as well as those in the equatorial region. Furthermore,
the waveform analyzer (WFA) of the unified radio and plasma wave instrument (URAP) onboard the Ulysses
spacecraft measures both electric and magnetic signals
21,152 LIN ET AL.: ULF WAVES IN THE Io TORUS
with a wide frequency range from ~500 Hz to a frac-
tion of hertz, which is suitable for the study of the ULF wave we have reviewed above. It is the first spacecraft to carry a magnetic search coil into the Jovian magneto-
sphere. We will present the observations of ULF waves
during the flyby and discuss their possible generation mechanisms.
INSTRUMENTATION
A detailed description of the URAP experiment has
been presented
by Stone et al. [1992a]. The data used
in this study are derived from the WFA, which provides spectral analysis of electric and magnetic signals in 10 low-band and 12 high-band channels. The central fre- quencies of the low-band channels are 0.22, 0.33, 0.44, 0.67, 0.89, 1.33, 1.78, 2.67, 3.56, and 5.33 Hz, while those of the high band are 9.3, 14.0, 19.0, 28.0, 37.0,
56.0, 75.0, 112, 149, 224, 299, and 448 Hz.
For the high-band channels, electric and magnetic field measurements on antennas which are perpendic- ular to the spin axis, are available. They are denoted
here as E= and By, respectively.
Thus E= and B v are
measured in a rotating frame of reference and the z and
y refer to rotating spacecraft coordinates. For the z an-
tennas, which are aligned with the spin axis and always point to the Earth, the electric and magnetic signals, Ez and Bz, are measured alternatively. For the low-
band
channels,
data are obtained
for E= and either
B v
or Bz. In this paper the electric signals are converted to
field
strength
((V/m) 2 /Hz) by dividing
by an effective
length of 35 m for the z antennas and 3.5 rn for the z
antenna.
In addition to the average data set for both high and low bands, which consists of the averages of available E=,
Ez, B v, and Bz over 64 s, ...5 times the spin period
(12
s), there
are two more
sets
of data obtained
in high-band
channels:
(1) a peak data set, which
is the largest
value
recorded for the E= channels for each frequency and for each octant of spacecraft rotation, and the values
of B v and Bz or Ez taken at the same
time, and (2)
a measurement of the phase difference between the E=
signal
and the two others
at the same
time that the peak
measurement was made. The resolution of the phase
measurements is 22.5 ø . This set of data may be used to study the polarization of the signals.
OBSERVATIONS
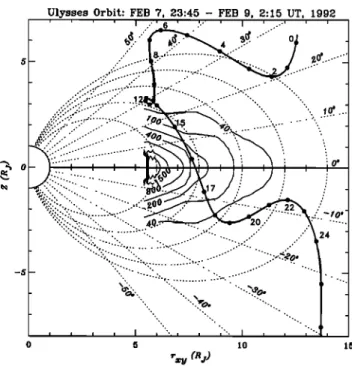
The trajectory of Ulysses during the flyby of Jupiter is shown in Figure 1. Contours of equal electron density are overplotted in Figure 1. The density numbers are
derived
from the equatorial
plasma
density
(F. Bagenal,
private communication,
1993) using a diffusive
equilib-
rium model
[Mei et al., 1992;
Mei, 1992]. Between
0700
and 2000 UT of Feb. 8, Ulysses traveled from north to south covering magnetic latitudes between ~ +48 ø
and ~ -15 ø. It reached
the closest
point to Jupiter at
~1202 UT at a radial distance of 6.31 Rj at 0130 LT, then penetrated the Io plasma torus. At ~1614 UT the spacecraft crossed the magnetic equator at a distance of
~ 7.75 Rj from Jupiter.
Dynamic spectra of electric and magnetic fields mea-
sured by the WFA during the day of February
8 are
presented in Plate 1. The data displayed have been cor-
rected for the background noise level of the instrument
Ulysses Orbit: FEB 7, 23:45 - FEB 9, 2:15 UT, 1992
Fig. 1. The trajectory of Ulysses between 2345 UT, Febru-
ary 7, and 0215 UT, February 9, 1992, plotted in magnetic
dipole field coordinates, where the horizontal axis rz v is the
cylindrical radius from the center of Jupiter, and the vertical axis is the cylindrical z from Jupiter. The solid circles show
the position of Ulysses for every hour from 0000 of February
8 to 0200 of February 9. The thin lines are contours of equal
electron density (per cubic centimeter).
and are then divided by a polynomial fit of the back-
ground
noise. The noise
level is determined
empirically
from previous
quiet periods
and is displayed
along
with
the fit in Figure 2, which shows
examples
of line plot
spectra. We note that during the entire period of Io
torus traversal, signals detected in all channels of WFA
were always a few decades higher in intensity than the
noise
level, indicating
that there are strong
and active
sources of various plasma waves in the Io torus.
The upper panel of Plate 1 shows such relative inten-
sities of electric signals detected on E=; while the lower
panel shows
the relative
intensity
of magnetic
signals,
By, (or, for some
periods
for the low-band
channels,
of
Bz). Both electric
and magnetic
data are the 64-s av-
erages. Local ion cyclotron frequency lines calculated using the Ulysses magnetometer data are overplotted
on each panel.
Intense wave activity is seen in both the electric and
magnetic data throughout the day. The waves near and
above the proton gyrofrequency
and extending
to the
upper
limit of WFA frequency
(448 Hz) are believed
to
be varieties
of whistler
mode
waves.
They are the topics
of other studies
and will only be mentioned
here briefly.
The wave enhancement between 0400 and 0800 UT has
been
suggested
to be auroral
hiss [Far•.ell
et al., 1993]
whose sources may be located in the boundary between
open and closed Jovian magnetic field lines. Another in-
tense period of wave activity at a few hundred hertz was
seen between 1000 and 1500 UT. These waves, which are
believed
to be whistler
mode chorus,
were observed
up
to 2 kHz by Ulysses
[Stone et al., 1992b]
and are dis-
LIN ET AL.: ULF WAVES XN THE Io Tor•us 21,153
cussed extensively by Farrell et al. [this issue]. The
above wave activity w•s seen in both electric and mag-
netic components, which confirmed observationally for
the first time the electromagnetic nature of the waves.
Enhanced waves below f•u+ were observed after 0800
when
Ulysses
was
penetrating
the Io plasma
torus.
Be-
tween 1000 and 1400 UT, two peaks of wave signals were observed in the Ez component. One is probably right
below the local O ++ gyrofrequency,
and the other is
below f•c+. Note that the Ez signals of whistler mode
hiss
during
this interval
extended
to ~10 Hz, below
the
fcH+ line and partially
obscure
the first peak. The By
enncemn
e,ow
but the second peak below f•c+ does not appear i
spectrum.
We note that during
this 4-hour
interval
the
spacecraft was essentially staying in the same L shells
(L ~ 8.5)at about the same
magnetic
latitude (~ 30ø).
After 1400, as the spacecraft went south approaching the magnetic equator, the intensity of Ez gradually de- creased and reached its minimum at the equator, then
increased again gradually as the spacecraft went further
southward. The sudden decrease at 1910 in low-band frequencies in Ez was due to a gain change of pream- plifiers which saturated the electronic system. Despite
the saturation, we still see that the intensity after the
equator crossing was not as strong as that before the
crossing. The time variation of the B v spectra near the
equator appears to be different from that of E=. The
B v component has a strong enhancement near the equa-
tor and peaks at the channel with the central frequency right below the local proton frequency. We will see later
that the apparent difference in Ez and By spectra at
the equator may be caused by the change in direction
of the observations of the wave front plane.
In Figure 2 we show line spectra of two periods to be examined in more detail: the period between 1155 and
1210, when the spacecraft was at L ~ 8.5, and magnetic
latitudes
of ~ 30 ø (Figure 2a), and the period between
1605 and 1620, when the spacecraft was near the mag-
netic equator
at L ~ 7.7 (Figure 2b). In these
two peri-
ods, measurements of B, were made for the high-band
channels only. The background noise of the instrument
is plotted in the lower panels for each component. Fig- ures 2a and 2b show that the power density in all com-
ponents are at least one or two decades higher than the
instrument noise.
We marked with arrows the local ion cyclotron fre-
quencies,
fcH+, f•_o+, f•_s+
and f•_o++, in the upper
panels of Figure 2,-•rhich •Iisplay thd r-elative intensity of
each component to show the correspondence of features
in the wave spectra to the cyclotron frequencies. For the
high-latitude
spectra
(Figure
2a) a reduction
in the wave
intensity
near
the proton
gyrofrequency
(fcH+ ~35.5 Hz
for the interval) can be seen in all three components. In Ez this reduction is not as clear as in B v and B, proba-
bly because the Ez signals of whistler mode hiss, which
peak
at ~ 200- 300 Hz, extend
to channels
below
fcH+'
In B v and B, the whistler mode signals showed a clear
cutoff
near fcH+
, and a relative
maximum
near 10 Hz
may be seen
in By (and probably
in Bz, too). In the Ez
spectra, another reduction in signal strength is seen near
fop+ (~2.2 Hz) and another
peak
appears
immediately
below
fcs+'
The above characteristics of the spectra seem to re-
semble the spectra of ion cyclotron waves observed pre-
viously in the Earth's magnetosphere. For example,
Young
et al. [1981]
observed
in He+-rich
plasma
the
reduction in the wave intensity right above the helium
gyrofrequency, which is believed to be in the stop band
for ICWs between
the He
+ gyrofrequency
and a cut-
off frequency. "Spectral slots" due to the stop band
near
the O + gyrofrequency
have
also
been
observed
[cf.
Fraser et al., 1992]. The similar spectral characteris-
tics in Figure
2 suggest
that the waves
below
fcH+ are
associated with the ion cyclotron instability.
The spectra
of equatorial
waves
(Figure
2b) show
sim-
ilar features.
A peak
at the frequency
below
fcH+
(~11.3
H•) appears
in the By component
(and probably
in Bz).
The peak in E= is not as clear as in the case of the last
interval. A reduction in the wave intensity near the gy-
rofrequency
of O ++ can be seen
in the Ez spectra
as
well as in Bv, followed by a peak in the lower frequency
channels.
This may be evidence
of the presence
of O ++
in this equatorial
region (L ~ 7.7), which has been ob-
served by Voyager 1 [Bagenal et al., 1992].
We note that the frequency resolution of WFA is ra-
ther low for this study. Within a stop band near an ion
gyrofrequency there may be only one or two channels
as will be shown later. Also, a very strong signa• in a
channel of a given frequency may.leak into the neighbor
channels resulting in spurious signals in these channels.
The above shortcomings might have affected the obser-
vations of the stop bands in the spectra and made them
less evident.
It is interesting to compare the power density of sig- nals on the z antennas with those on the z or y antennas for the two periods. For example, Figure 2a shows that
at 9.3 Hz, the ratio of the power density
By/B, is ~2,
while near the equator (Figure 2b), B, is more than 5 times larger than B v. In Figure 3a we plot the compar-
ison between
Ez and E, or between
By and B, (64-s
average data) for the channel of 9.3 Hz from 0900 to
1900 UT. The variation of the ratio of wave amplitudes
E=/Ez and By/B, (the third panel) seems
to be contin-
uous and consistent. Before 1400, when the spacecraft
was at high latitudes
(• 25ø), and the ambient
magnetic
field was mostly in the -z direction, the amplitude of signals in the z - y plane were ~2 times stronger than those along z. As the spacecraft approached the equa- tor, and the magnetic field became more and more in the north-south direction, the ratio reversed as the sig- nals detected on z antenna became stronger than the
z-y signals. After the equatorial crossing the ratio
tends to reverse again. The above variation pattern was seen in the high-band channels below 56 H•. There is
no simultaneous measurements of Ez and E, or By and
B, for the low-band channels, but it is likely that the above pattern also exists in low-band channels.
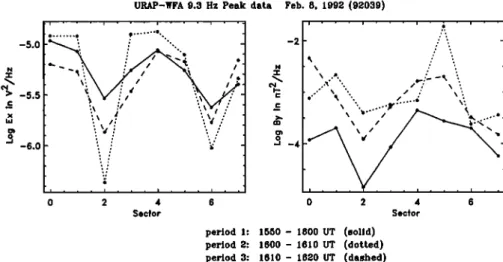
The variation of the ratio of the wave intensities may be explained at least partially by the change in the ori- entation of the wave front plane. In Figure 3b we show
the peak
values
of Ez (in V2/Hz) and B v (in nT2/H•)
versus the number of sectors for three successive time in-
tervals when the spacecraft was near the equator. Sector 0 begins at the position when the +z antenna is closest
21,154 LIN ET AL.: ULF WAVES IN THE Io TORUS ::.•i:::i::(S .',.
+ %
! I 0 xl- ,,-- I",. I t ... '.i:l' .. + +- 0 .. [[j:JiIII':' ... jiIllllllltlllljJilljl'•lllljlIllj. OCN,,--- o oo• o• . . 0 CN ,,-- .---LIN ET AL.: ULF WAVES iN THE Io To•us 21,155
• 6
fcS• fcO
++
• •o* / [4 0 ... i ... i ... i ... -5 -10 -15 -20 0.1 5 0 -5 1.0 10.0 100.0 1000.0 0.l HzLog (By in nT**2/Hz)
... ! ... ; ... i ... ... i ... i ... i .... 1.0 10.0 Hz Log (Bz in nT**2/Hz) -4 ' • ... ' ' ' • ... -5 -6 -7 - 10 ... 100.0 1000.0 0.1 1.0 10.0 100.0 1000.0 HzFiõ. 2a. Spectra of (•rom left to right) E=, By, and Bz for the period 1155 to 1210 UT. The upper panel
for each component is the loga•itlun of the relative intenSity which is used to plot the dynamic spectra in Plate 1. In the lower panels the logarithm of the power density is shown. The instrument backõround
noise is also plotted (open circles) for each component alon g with the polynomial fit to the noise. Arrows in the upper panels indicate the ion gyrofrequencies.
4.s 4.0 •.0 2.5
URAP-•FA
Spectra 16:5:44
-16:19:37
fcS+
fcO
+
.
• 4.0
3.0 4.0 2.5 3.5 ... fcH- • ... ] 2.0 Log (Ex in (V/m)**2/Hz) -2 ... ' " ... , ... m ... -4 -6 -8 ... ! ... i ... i ... -lO -12 -14 -16 0.1 5 0 -5 -10 1.0 10.0 100.0 1000.0 0.1 Hz Log (By in nT**2/Hz) '" ... m .... •,,,! ... V'm ... o ... I ... I ... I 1.0 10.0 100.0 1000.0 0.1 Hz.L.ø..g....,(B
z...i..n.,.
n,
T.*..?/..H
.z.),..
1.0 10.0 100.0 1000.0 HzFig. 2b. The same as Figure 2a but for the period 1605 to 1620 UT.
Plate l. Dynamic spectra of the relative intensity of (upper) Ez and (lower) B//. Each tickmark on
the vertical axes indicates the cente• frequency of a waveform analyzer (WFA) channel. A horizontal
bar under the second panel with alternative black and white periods indicates the intervals when the
mainetic measurements in low-band channels were BI• (black periods) or Bz (white periods). For the
high band (frequency > 5.3 Hz) the displayed magnetic data are all BV. The solid lines overplotted on
each
panel
are
local
gyrofrequency
lines
for
H +, O
++, O
+, and
S
+ , labeled
as
fcH+
, fcO++,
fcO+
, and
fcS+
, respectively.
The
universal
time
(UT), magnetic
latitude
(MLAT),
L value,
and
the distance
from
21,156 LIN ET AL.: ULF WAVES IN THE Io TORUS N URAP-WFA -6 -õ _ _ _ - o _
9.30 Hz (64-sec average data) 2/8/92
i , , , i , , , i , , , i , , ,
10.00
mN - • o cP o o •,•Ooo
'• 1.00'• 0.10
X ß '• 0.01 ... 10 12 14 16 18 HourFig. $a. Comprison between Ez •d Ez, •d By •d Bz (64-s average data) for the 9.3-H• chapel
•om 0900 to 1900 UT. The •st p•el shows the log•it• of the power density of Ez (dots) •d Ez
r,
,co,d
The bottom p•e] is the r•tios of the w•v• •pn•-&s E=/E• (•o•) •d B•/B• (c•c•es) plotted • •o•
-5.0
> -5.5
-6.0
URAP-WFA 9.3 Hz Peak data
'..%%
',.•i,f
'..%•
'., ..'..'
'...: .•.. , . ,, i ß . ß i . . . i . . . 0 2 4 $ecfor Feb. 8, i992 (92039)--
2 i . . . i ß . ß , ' ;,,.'?'z,,.,
' • ' ' '
x ..,.. .':. -• ..• ,, /? • \• {...' \ ',
.' % ',, // .' \.
..; '..[ ,,,.,...:;,-
! . . 6 0 2 4 6 Secforperiod i: i5õ0 - i800 UT (solid) period 2: i800 - iSi0 UT (dotted) period 3: iSi0 - i820 UT (dashed)
Fig. 3b. The logarithm of the peak values of (left) E= and (right) By versus the number of sectors where
the measurements of the peak data are taken for three periods near the equator: 1550-1600 UT (solid
lines),
1600-1610
UT (dotted
lines),
and 1610-1620
UT (dashed
lines).
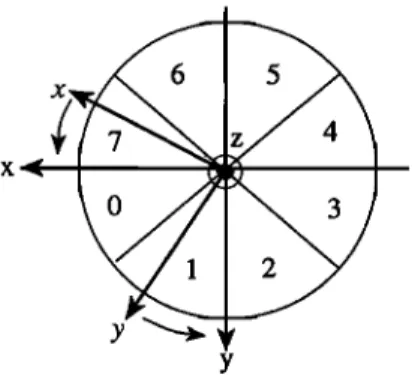
away from the +X axis of the despun spacecraft coordi-
nates. During the period we are studying -{-X pointed eastward and -{-Y pointed southward. The z antenna
alway• coincides with the 2 axis. The relative position
between the despun coordinates, the z-y antennas, and
the Sector directions is illustrated in Figure 4.
Figure 3b shows that the electric wave power is strong-
est in sectors 0 and 4 which are near the despun X axis
and has minima in sectors 2 and 6 near the Y axis.
The magnetic wave power has similar modulation but the maxima shift to sectors 1 and 5 in some periods. It seems that the waves observed may have their wave
front roughly in a plane between 0-4 and 1-5 sectors
and containing the Z axis. The wave electric field and
magnetic field lie in this plane have larger components
in the 2 and in the X directions than those in the Y
direction. Since E= and By used in Figure 4a are the
64 sec (five spins)
average
of the measurements
made
in
the X -Y plane, while E= and B= are the average of
the measurements on z antenna only, thus E= and B=
should be larger than E= and By. This is what we see
near the equator (N1600 UT) in Figure 3a. We note,
however, while the ratio of the magnetic wave ampli-
LIN ET AL.: ULF WAVES IN THE Io To•tus 21,157
Y
Y
Fig. 4. The relative position between the despun space-
craft coordinates (X, Y, and Z), the antennas z,y, and z,
and the directions of the eight sectors as viewed from the
Earth. The +Z antenna points to the Earth, +X lies in the plane containing the +Z and the Sun, pointing toward the
dixection closest to the Sun and perpendicular to the +Z,
and +Y completes the orthogonal system. The z antenna rotates in the direction indicated by the cttrved arrows. The
z antenna coincides with the Z axis.
right after 1600), which
seems
reasonable,
the ratio of
the electric
wave
amplitudes
Ez/Ez (right before
1600)
is ~0.1, which is unexpectedly small. One possible rea- son we can think of for such small Ez/Ez is that the
waves burst observed near the equator may also have a
large electrostatic component in the Z direction. At higher latitudes the wave front seems to lie on a plane closer to the X- Y plane and to be roughly per- pendicular to the Z axis, so that the wave components projected onto the X- Y plane are larger than that onto
the Z direction.
The changes
in the direction
of the wave
front planes observed at different latitudes may explain
the apparent
decrease
of Ez and enhancement
of B v
toward the equator seen in Plate 1.
The observed wave intensity in Ez at 9.3 Hz near the
equator
was ~10 -6 (V/m) 2 /H•.. It is comparable
to
the peak wave intensity observed by Voyager I at 10 H•.
at L = 6.2 [Thorne and Scarf, 1984].
ANALYSISPoynting Vector E•aluation
In the high-band channels the WFA measures peak
values of E• in each of the eight sectors in a spin .ro-
tation, and at the same
time, the measurements
of Bv,
and Ez or Bz are made. The phases of the components
with respect to E= are also measured for each sector.
We used the peak and phase data to evaluate the
Poynting
flux of the observed
waves
in the spacecraft
coordinates. Since we do not have simultaneous mea- surements of all six components of B and E (Ez and Bz are measured alternately), the calculations were made
only in intervals
(we took 10 rain for each
interval)
Cen-
tered at the times when measurements of Ez switched
to measurements of Bz so that we get Ez and Bz data
each for half interval. Then we assumed that the mea•
surements of each component averaged over this interval
are simultaneous.
The six components of B and E field were derived
as follows:
First, a sector
was selected
as the +X' axi
s
of a temporary
Cartesian
coordinate
system
(X •, Y•, Z •,
with Z • aligned
with the z antenna). The peak value
of the E field in the sector was taken as the amplitude of EX, , and wave phase of the E field measured in this
sector
was taken as the reference
phase. Then the Ey•
component was obtained from the peak value and the
relative
phase
shift (with respect
to the EX, ) measured
in the sector
perpendicular
to the X • sector,
while
was derived from the peak and phase data measured on
the z antenna. The components
EX, , Eye, and
were then rotated to the despun
S/C coordinates.
For example, if we choose sector 0 as the +X ' direc-
tion, then
rx, =
- r(2)cos(t +
-
E z, - Ez(O)cos(w/+
•E,(O)
-- •E,(O))
where
E=(i) and Ez(i) represent
the electric
field (the
peak value) measured on the z and z antennas, respec-
tively, at the time when the z antenna is in sector i.
Similarly, we have three components of B
B X, - By(6
) cos(wt
4- •OBv(6
) -- •OE,(0))
-
+
-
Bz, - B.(o)cos(,.,t
+ I,,s.(o)
-
where
By(i) and Bz(i) are the magnetic
field (the peak
value) measured on the y antenna and on the z antenna,
respectively, at the time when the z antenna is in sector
i. Knowing six components of E and B, we may calcu-
late the Poynting
flux S = (1/p0)E x B in X •, Y•, and
Z • coordinates,
and then rotate the flux into the despun
S/C coordinates.
In general, any sector can be chosen as the reference
sector
X •. In our calculation
we chose
sectors
6, 7, 0,
and 1, which are closer to the despun X axis (see Figure 4), as reference sectors, and Calculated the Poynting flux
in the despun coordinates separately. The results from
the four calculations
were then averaged
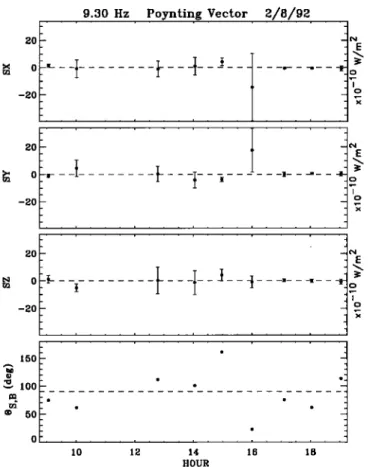
and shown
(for
9.3-Hz channel) in Figure 5 as SX, Sy, and Sz, with the standard deviation from the mean values overplot-
ted. There were only nine switches
of Bv/Bz between
0900 and 1900. In the last panel of Figure 5, the angle between the Poynting flux and the ambient magnetic
field, which was measured as the average of the B field
over each 10 rain period in the despun coordinates, is shown.
Figure õ shows that near the equator, the angle be-
tween
S and B was rather small (~ 20
ø near 1600 UT),
which means the average wave energy flow was nearly parallel to the magnetic field. We note, however, that
the standard
deviation
in Sx and Sy for 1500 is large,
which may suggest that the propagation of the waves was not in a unique direction. At high latitudes, at ~1300 UT, the Poynting flux was nearly perpendicular to the magnetic field. The intensity of the flux near the
equator,
IS[ ~ 2.2 x 10
-9 W/m 2 at 1600
UT is larger
than that at higher
latitudes
(~1.1x10
-lø W/m 2) at
~1245 UT.
Wave Polarization
In some cases the phase data may be used to derive
21,158 LIN ET AL.: ULF WAVES IN THE Io TORUS 20 9.30 Hz Poynting Vector 2/8/92 • 0 -20 20 20 0 -20 150 loo . 5O 0 10 12 14 16 18 HOUR
Fig. 5. Three components of the calculated Poynting flux
$X , Sy , and S Z, in the despun
coordinates
(the first three
panels). The last panel is the angle between the Poynting
flux and the magnetic field.
termine the polarization sense of the waves with respect
to the ambient magnetic field. Near the closest aproach
(A ~ 30ø), the ambient magnetic field, about (1072, 418, -2012) nT in the despun spacecraft coordinates X, Y,
and Z for the period 1155 to 1210 UT, was roughly in the
-Z direction (~30 ø tilted from the Z axis). Thus the
phase difference between signals in two perpendicular
sectors
(for example,
Ez(0) and Ez(2), Ez(1) and Ez(S),
and so on) can be used to determine the polarization
sense of the waves in the spin plane. Figure 6a shows the
phase shifts between E fields measured in two perpen-
dicular
sectors
(denoted
as Ey, and Ex, ) at each
high-
band frequency for the interval from 1155 to 1205 liT.
There are eight pairs of E¾, and E x, at each frequency.
Phase differences of 0øto 180øand -180 ø to -360 ø rep-
resent a right-handed polarization and is marked with R on the right side of Figure 6a. The rest of the area is then for left-handed polarization and is marked with L. It is seen in Figure 6a that the waves above 50 H, appear
to be right-hand polarized, which is consistent with the
polarization of whistler mode waves. The polarization
for the waves
near and below
fat+ (35.5 Hz), however,
is uncertain with the dots scatt•i•d in both the R and/)
areas. As we mentioned earlier, during this intervaJ the
whistler
mode
signMs
extended
to channel
below
fc.i.I+.
The presence of both left- and right-hand polarization in these channels may imply that the signals are the
mix of different wave modes. We aJso notice that some
data points spread near the 0 ø and 4-180 ø lines, which
correspond to linear polarization. Recently, Anderson
et al [1992a, b] reported observations of electromagnetic
ICWs in the Earth's outer magnetosphere that were lin-
early polarized at all magnetic latitudes they sampled
(MLAT < 4-16 ø) in the region near dawn. These waves
occurred at too high a frequency to have been affected
by the crossover frequency and thus are suggested by the
authors to be generated with linear polarization. It is
possible that the approximately linearly polarized com- ponents seen in Figure 6a, which appear in channels be-
low reit+ but higher
than the crossover
frequency
(~10
Hz in this case), are similar to those waves reported by Anderson et al. [1992a, hi.
Near the equator, the ambient magnetic field, about
(-183, 715, 2.79) nT, is basically
in the despun
+Y di-
rection, ~ 15 ø away from the +Y axis. In this case the centers of sectors 0, 7, 3, and 4 lie near the plane perpendicular to the ambient magnetic field. Thus we may determine the polarization of the waves on the de-
200
WFA high band 11:55:3- 12:9:51 92039
ß ß _ ß = i ß ß 8 ß 1000 -200 - ß +:3:1 ß ß ß ß I ß I ß .... I , , I ... I , , 10 100 Hz
Fig. 6a. The phase difference between electric signals in
two perpendicular sectors for the period 1155 to 1210 UT.
Symbols R and L on the right side denote the right-handed
and left-handed polarisargon, respectively, implied by the phase shifts.
200
-200
WFA high band
I ß 16:5:44 - 16'19:28 92039 ß ß J ß ß ß ß ß ß ß ß 1000 1oo Hz
Fig. 6b. The phase difference between Bz and By for the
LIN ET AL.: ULF WAVES IN THE Io TORUS 21,159
spun X- Z plane by examininE the phase shift between the siEnaIs in one of the four sectors and those on the z antennas. The results for the period 1605 to 1620 UT are shown in FiEure 6•. Durin E this period the z antenna was measurinE maEnetic siEnals. The plot
shows the phase shifts between Bz and By measured
in sectors 0, 7, 3, or 4. AlthouEh the results are more scattered than the previous ones, it can still be seen
that the hiEh-frequency channels (near and above 100 Hz) exhibit riEht-handed polarization. Only the low-
est channel
(9.3 Hz) in this period
falls below
fcH+' It
appears to show a left-handed polarization. Th-•-ma E-
rietic measurements in the WFA are usually more noisy
than the electric measurements. This may contribute
to the larEer scatter of the phase measurements seen
in FiEure 6b. For the frequencies near 50 Hz the data
points scatter in both the R and L teEions. We note
that durinE this period the wave siEnais (especially the maEnetic siEnals ) at these frequencies have decreased to a very low level (see FiEure 2b), thus the derivation of
the polarization for these frequencies is less meaninEful.
Refractive Indez
In an attempt to better understand the observed wave
modes we calculated the ratio cBu/Ez (where c is the speed of light), which is an approximation of the refrac-
tive index n, and then compared the results with the- oretically calculated values of n using the cold plasma dispersion relation and the recently developed density
model of the Io torus [Mei, 1992] (see also Mei et o2.
[1992]).
FiEure 7a show such a comparison for the equatorial
period,
1605-1620
UT (L ~ 7.7). The ratio cBy/Ez av-
eraged over the period is plotted with the asterisks. For this period we assume that the wave normal is approx- imately parallel to the ambient magnetic field and cal- culate the dispersion relation of the cold plasma waves
with 20 ø wave angle. We used the general equation [$tiz, 1962] to find the refractive index:
where An 4 - Bn 2 + C - 0 A - S sin 2 0 + P cos 2 0
B - RLsin
2 0 + PS(1 + cos
2 0)
C- PRL and S = 0.5(R + L), R- 1 - k L- 1- 2 P--l- w 2 kwhere
•vv/•
is the plasma
frequency
of particle
species
k,
while 12/• is the cyclotron frequency of species k, positive
for ions and negative for electrons.
• lOOO • lOO 16'5:45 - 16'19:37 UT, 92039 10 0.1 1.0
fcr
10.6
Hz
a
=
20
ø
10.0 100.0 Frequency (Hz)Fig. 7a. Ratio cBv/Ez (asterisks) and calculated refractive
index (thin lines) assuming a 20 ø wave angle for the interval 1605 to 1620 UT. The values of the refractive index at the
WFA frequencies are marked with open circles (for L mode)
or solid circles (for R mode).
100 1 o.1 11:55'5 - 12:1]'57 UT, 92039
... '
'
....
' '"
o ø a = 60 ø ... I , , ,7,,I,.I ... I , , , 1.0 10.0 100.0 Frequency (ttz)Fig. 7b. The same as Figure 7a, but for a 60 ø wave angle
and for 1155 to 1210 UT.
The electron density (N e) derived from the URAP
observation
is ~400 cm
-3 for this period
[Stone,
1992b].
The ratios between the density of each ion species and
Ne are estimated using the model by Mei [1992]. In the
calculation
we took N,, N.+, NO+
, NO++, NS+
, and
Ns+
+ as 375,
40, 85, 80, 10, and
40 cm
-3, respectively.
The calculated n values are overplotted in Figure 7a
with thin lines. The more vertical lines represents the
L mode refractive index, while the more horizontal lines
are for the R mode. The calculated n values at the
center frequencies of the WFA channels are marked with
solid circles
(for the R mode wave) or with open circles
(for the L mode wave).
The spectra for this period have shown a strong peak
at 9.3 Hz (Figure 2b, central panels). This frequency
is very close to the cutoff frequency, fco ~ 10 Hz, of a narrow L mode branch which extends to the proton
21,160 LIN •.T AL.: ULF WAV•.S IN THe. Io Togus
gyrofrequency
(11.3 HI). The lower part of this branch
(• for at 10.6 HI) is for the unguided
L mode wave. Al-
though the frequency resolution of the WFA instrument is too low to distinguish these characteristic frequencies
(fco,
for, and fcH+
) in such
a narrow
frequency
band
(10 - 11.3 Hz), the observed
cB•/E= at ~ 10 Hz, which
is closer to the values of the refractive index for the un-
guided L mode wave may imply that the strong signal in
the 9.3-Hz channel is the effect of nonconvective growth
of unguided waves. The angle between the Poynting vector and the ambient magnetic field calculated near
1600 UT (Figure 5) is ~22 ø. This seems
to be consis-
tent with the waves being unguided with a small wave angle, since for the unguided wave which has a closed refractive index surface, a quasi-parallel Poynting vec- tor, which is in the same direction as the group velocity,
implies a small wave angle [cf. Ranch and Ronz, 1982].
However, as we will discuss later, a very large hot ion
anisotropy is required to excite the ion cyclotron insta- bility in this narrow frequency band. In the first few channels where a peak of the power density appeared in the E= spectra, the n values are close to the two lowest
L mode branches.
The refractive index for the period of high latitudes
between
1155 and 1210 UT (L ~ 8.5, A ~ 30 ø) is shown
in Figure 7b in the same format as that of Figure 7a. In the calculation of the dispersion relation we have
used
the following
density
numbers:
Ne = 14, NH+
12.4
,No+ = 0.4, and NO+
+ = 0.6 cm- . The sulphur
3ions are neglected. We have calculated the refractive index for various wave angles and compared the results
with the cBu/E= obtained
from the data. We found
that
at the f•equencies of the first few channels of WFA the calculated values had bette• agreement with the data for the large wave angle than for the small wave angle.
While for higher frequencies, not much improvement was
seen by varying the wave angle. In Figure 7b we show
the calculations of the refractive index with 60 ø wave
angle.
The spectra
fo• this period (Plate i and Figure
show a peak at 9.3-Hi channel seen in Bu, another peak
above
-/co+ (in 2.67-Hz
channel),
and a rather wide
peak in the channels
below
leo+ (2.2 Hi). The 9.3-
Hi channel falls in an L mode branch between a cutoff
frequency fco = 7.6 Hz and a crossover frequency at
...12.5 H=. The measured
cBu/E= fo• this channel
is
close• to the L mode b•anch although is smaller by a
factor of 2 than the calculated L mode u value. The
2.67-Hz channel
falls almost
at the cutoff
f•equency
(2.5
Hi) of an L mode
band
below
-/co++' The ratio cBu/E=
is much smaller than the calculated value for the central
frequency but is very close to the u near the cutoff f•e-
quency. It is possible that the channel has been affected by stronger signals near the cutoff frequency. The values
of cBu/E= for the first three channels
are close•
to the
lowest branch of L mode guided waves, but the observed
values for the channels near i Hz are much lower than
the calculated results. We note that in both Figure 7a
and 7b, most of the observed
cBu/E= values
are lower
than the corresponding calculated values. One of the
possible •easons may be that the measured E= contains electrostatic components which should not be included
in calculations
of cBu/E•.
DISCUSSION
Throughout the Io torus, Ulysses has observed intense
ULF wave activity. The simultaneous observations of
the waves in both magnetic and electric components be-
low the proton gyrofrequency are convincing evidence of
the existence of electromagnetic plasma waves. The fre-
quency characteristics of these waves suggest that they
are likely to be ion cyclotron noise which was excited by the resonant ions in the Io torus through the cyclotron instability.
Although the polarization analysis can only be con-
ducted for the high-band
channels
of the WFA (• 9
Hz), the difference
in polarization
between
the waves
below
and above
the local
fcH+ is clear,
especially
for
the high-latitude
period
(Figure
6a). Above
f•H+, the
waves
exhibit
right-hand
polarization,
and belo-•
fcH+,
more data points fall in the L mode region. The increase
of randomness of polariiation at the frequency below
fw?Je+
range of wave angles or mixed wave modes. At themay
imply
that
the
observed
waves
have
a rather
equator, only the lowest channel of the high-band data
is below
the local
fcH+ (11.3
Hi), and the polarization
in the channel
is seen
left-handed
(Figure 6b).
The dominance of heavy ions near the equator in the Io torus produces broad frequency stop bands in which
L mode propagation is forbidden [Thorne and Moses, 1983; Meiet al., 1992]. This can also be seen from the
numerical calculation results in Figure 7a. For exam-
ple, no L mode
waves
exist
between
fco++ and a cutoff
frequency (fco) at ~10 Hz. There is a narrow band for
L mode
waves
between
the cutoff
frequency
and fcH+'
The waves
below the crossover
frequency
(f•) (~10.6
Hi) in this • mode branch are believed to be unguided waves [Mei, 1992], which are classified as class II waves by Ranch and Ronz [1982], or as the W branch follow- ing the notation by Horne and Thorne [1990]. The up- per part of the branch (above fo•) is possibly the B
waves described by Horne and Thorne's notation which
are guided and could be very unstable, being excited
by anisotropic resonant ions. The channel with a cen-
tral frequency of 9.3 Hz detected strong signals near the
equator
(seen
in B• in Plate I and Figure 2) and has
a cB•/E= ratio close to the refractive
index of the œ
mode W branch at ..,10 Hz. This seems to suggest that
we may be seeing the unguided • mode waves. However,
there is an upper limit in frequency of ion cyclotron •
mode waves which closely depends on the anisotropy of
the resonant protons [Kennel and PeOchek, 1966]:
fmsx/fcH+
-- A+/(A
+ + 1)
where
the anisot•opy
A + - Tñ/•[- 1. Since
the ob-
served
f•equency
is •.3 Hi and fcH+ ,-• 11.3 Hz, the
lowe•
limit fo• fmsx/fcH
+ is then ~ 0.8, which
gives
A + - 4 o• Tñ/•i - •. Such
a la•ge
anisot•opy
seems
unreasonable. Othe• mechanisms need to be explo•ed
to explain the observed equatorial waves. This is left for the future investigation.
At high latitudes (Figure 7b) the•e is • mthe• wide
f•equency
band between
fo•(~ 12.5 HI) and f•+ ($5.4
Hi) where the convective L mode ICWs can p•opagate.
However,
the anisot•opy
A + will limit the waves
to be-
LIN ET AL.: ULF W,•VES IN THE Io TORUS 21,161
ca] A + - 1, the maximum
wave
frequency
will be 1/2
fcH+, which
is 17 Hs for this peiod. As we have
seen,
a
peak in this œ mode band appears at ~10 Hs, between fco =7.63 Hz and f• =12.5 Hz, which belong to un- guided œ mode. There is no Poynting vector calculation available for this period, but the Poynting flux calcu-
lated for this frequency near 1245 (Figure 5) when the
spacecraft was still in about the same region show that the Poynting flux is quasi-perpendicular to the ambi-
ent magnetic field. This again seems to justify that the
waves observed in this region may be very oblique, as
we suggested in Figure 7b, since for the unguided wave,
the quasi-perpendicular group velocity implies a large
wave angle [Rauch and Rouz, 1982]. The waves below
f•o+ and f•o+ + are seen
in the spectra. Their peak
cfiannels
fal• within the frequency
bands
where ICWs
propagate.
Although
the cBy/Ez ratio sometimes
does
not agree with the calculated refractive index as shown
in the previous section, it is still reasonable to believe
that these are the œ mode ICWs. Those waves could be
easily excited in the equatorial region where the reso- nant energy is much lower and then propagate to high
latitudes [Meiet aJ., 1992].
The wave amplitude required to produce strong pitch angle scattering loss of energetic ions can be estimated
as [Thorne, 1983]
Et~ 102EpS/4(keV)L
-7/2
mV/m
where Ep is the kinetic energy of the resonant protons.
The resonance
energy
can be evaluated
as BJ/8wN.
Taking B - 738.6 nT near the equator (for the period of
1605
to 1620
UT) and N ~ 375 cm
-3, we find the res-
onance energy to be ~3.6 keV. This gives the required electric wave intensity for strong pitch angle scattering
as ~ 0.2 mV/m. The observed ICWs power density of
Ez at channels 0.67 and 0.89 Hz, which appear as peaks
in the spectra,
is ~3 x 10
-6 (V/m)2/Hz, which
corre-
sponds to an amplitude of 0.95 mV/m, larger than the
required amplitude.
At high latitudes (between 1155 to 1210 UT) the reso- nance energy was estimated to be ~1 MeV (taking B -
2318 nT and N ~ 14 cm-S). For such
energetic
ions
the required wave amplitude for strong diffusion is 10
mV/m. The observed wave power in the 0.67-Hz chan- nel which appears as a peak in the Ez and By spectra is
~2.5 x10 -4 (V/m)2/Hz, corresponding
to an amplitude
of ~8 mV/m, close to the required amplitudes. Consid-
ering that the data for this estimation is the average power and the peak power is much higher, waves at this frequency may also contribute to the strong pitch an- gle scattering of energetic ions. It seems that the ICWs observed by Ulysses near the equator as well as at high
latitudes (A ~ 30 ø) are strong enough to account for the
pronounced depletion of energetic ions observed in the
inner Jovian magnetosphere.
Acknowledgments. We would like to thank R. G. Stone, the principal investigator of the URAP experiment, for the opportunity to take part in this investigation. The authors
would like to thanks F. Bagenal for kindly providing the
equatorial plasma density data to produce the density con-
tours in Figure 1. We are also grateful to Denise Lengyel-
Frey of the University of Maryland for careful examination of
the WFA data. N.L. also thanks S. :I. Monson and K. Goets
of the University of Minnesota for their help in understand-
ing the WFA data. N.L. •ad Y.M. would like to thank R.
M. Thorne of UCLA for very helpful discussion. The work done at the University of Minnesota was supported by NASA
under contract NAS5-31219.
The editor thank• R. B. Horne and J. A. Slavin for their
assistance in evaluating this paper.
I•.EFERENCES
Anderson, B. :I., R. E. Erlandson, and L. :I. Zanetti, A statis-
tical study of Pc 1-2 magnetic pulsations in the equatorial
magnetosphere, 1, Equatorial occurrence distributions, J. GeophyJ. ReJ., 97, 3075, 1992a.
Anderson, B. :I., R. E. Erlandson, and L. :I. Zanetti, A statis-
tical study of Pc 1-2 magnetic pulsations in the equatorial
magnetosphere, 2, Wave properties, J. Geophy•. Re•., 97,
3089, 1992b.
Bagenal, F., D. E. Shemansky, R. L. McNutt Jr., R. Schreier,
and A. Eviatar, The abundence of O ++ in the Jovian
magnetosphere, Geophyz. Rez. Left., 19, 79, 1992. Broadfoot, A. L., et al., Extreme ultraviolet observations
from Voyager 1 encounter with jupiter, Science,
979,1979.
Farrell, W. M., et al., Ulysses observations of auroral hiss at
high Jovian latitudes, GeophyJ. Re•. Left., in press, 1993. Farrell, W. M., R. :I. MacDowall, R. A. Hess, M. L. Kaiser, M.D. Desch, and R. G. Stone, An interpretation of the
broadband VLF waves near the Io torus as observed by Ulysses, J. Geophy•. Re•., this issue.
Fraser, B. :I., Pc 1-2 observations of heavy ion effects by synchronous satellite ATS-6, Planet. Space Sci., 30, 1229, 1982.
Fraser, B. J., :I. C. Samson, Y. D. Hu, R. L. McPherron,
and C. T. Russell, Electromagnetic ion cyclotron waves observed near the oxygen cyclotron frequency by ISEE 1 and 2, J. Geophy•. ReJ., 97, 3063, 1992.
Gurnett, D. A., and C. K. Goertz, Ion-cyclotron waves in the Io plasma torus: Polarization reversal of whistler mode
noise, Geophy•. Re•. Left., 10, 587, 1983.
Horne, R. B., and R. M. Thorne, Ion-cyclotron absorption at the second harmonic of the oxygen gyrofrequency, Geo-
phyz. Rez. Left., 17, 2225, 1990.
Kennel, C. F., and H. E. Petschek, Limit on stably trapped
particle fluxes, J. GeophyJ. Rez., 71, 1, 1966.
Krimigis, S. M., et al., Low-energy charged particle environ- ment at Jupiter: A first look, Science• •0•, 998, 1979. Mauk, B. H., C. E. McIlwain, and R. L. McPherron, He-
lium cyclotron resonance within the Earth's magnetosph-
ere, Geophyz. Rez. Lett., 8, 103, 1981.
Mei, Y., The propagation characteristics and instability pro- perties of low frequency electromagnetic waves in the Io plasma torus, Ph.D. thesis, Univ. of Calif., Los Angeles,
1992.
Mei, Y., R. M. Thorne, and R. B. Horne, Ion-cyclotron waves at Jupiter: Possibility of detection by Ulysses, Geo-
phys. ReJ. Left., 19, 629, 1992.
Roux, A., S. Pertaut, :I. L. Rauch, C. de Villedary, G. Kremser, A. Korth, and D. T. Young, Wave-particle in-
teractions
near
/]He
+ observed
on board
GEOS
I and 2,
2, Generation of ion cyclotron waves and heating of He + ions, J. Geophyz. Rez., 87, 8174, 1982.
Rauch, :I. L., and A. Roux, Ray tracing of ULF waves in a multicomponent magnetospheric plasma: Consequencies
for the generation mechanism of ion cyclotron waves, J.
Geophyz. Re•., 87, 8191, 1982.
Stix, T. H., The Theory of Plasma Waves, McGraw-Hill,
New York, 1962.
Stone,
R. G., et al., The unified
radio
andsplasma
wave
investigation, Asiron. Asirophys. Supp. per., 9•, 291,
1992a.