HAL Id: insu-02884591
https://hal-insu.archives-ouvertes.fr/insu-02884591
Submitted on 30 Jun 2020
HAL is a multi-disciplinary open access
archive for the deposit and dissemination of
sci-entific research documents, whether they are
pub-lished or not. The documents may come from
teaching and research institutions in France or
abroad, or from public or private research centers.
L’archive ouverte pluridisciplinaire HAL, est
destinée au dépôt et à la diffusion de documents
scientifiques de niveau recherche, publiés ou non,
émanant des établissements d’enseignement et de
recherche français ou étrangers, des laboratoires
publics ou privés.
Switchbacks in the Solar Magnetic Field: Their
Evolution, Their Content, and Their Effects on the
Plasma
F. Mozer, O. Agapitov, S. Bale, J. Bonnell, T. Case, C. Chaston, D. Curtis,
Thierry Dudok de Wit, K. Goetz, K. Goodrich, et al.
To cite this version:
F. Mozer, O. Agapitov, S. Bale, J. Bonnell, T. Case, et al.. Switchbacks in the Solar Magnetic Field:
Their Evolution, Their Content, and Their Effects on the Plasma. Astrophysical Journal Supplement,
American Astronomical Society, 2020, Early Results from Parker Solar Probe: Ushering a New Frontier
in Space Exploration, 246 (2), pp.68. �10.3847/1538-4365/ab7196�. �insu-02884591�
Switchbacks in the Solar Magnetic Field: Their Evolution, Their Content, and Their
Effects on the Plasma
F. S. Mozer1 , O. V. Agapitov1 , S. D. Bale1 , J. W. Bonnell1, T. Case2 , C. C. Chaston1, D. W. Curtis1, T. Dudok de Wit3 , K. Goetz4, K. A. Goodrich1, P. R. Harvey1, J. C. Kasper5 , K. E. Korreck2 , V. Krasnoselskikh3 , D. E. Larson1, R. Livi1,
R. J. MacDowall6 , D. Malaspina7 , M. Pulupa1 , M. Stevens2 , P. L Whittlesey1 , and J. R. Wygant4 1
University of California, Space Science Laboratory, Berkeley, CA, USA
2
Smithsonian Astrophysical Observatory, Center For Astrophysics, Cambridge, MA, USA
3LPC2E, CNRS and University of Orléans, Orléans, France 4
University of Minnesota, Minneapolis, MN, USA
5
University of Michigan, Ann Arbor, MI, USA
6
NASA/Goddard Space Flight Center, Greenbelt, MD, USA
7
University of Colorado, Boulder, Laboratory for Atmospheric and Space Physics, Boulder, CO, USA Received 2019 November 10; revised 2020 January 18; accepted 2020 January 28; published 2020 February 19
Abstract
Switchbacks(rotations of the magnetic field) are observed on the Parker Solar Probe. Their evolution, content, and plasma effects are studied in this paper. The solar wind does not receive a net acceleration from switchbacks that it encountered upstream of the observation point. The typical switchback rotation angle increased with radial distance. Significant Poynting fluxes existed inside, but not outside, switchbacks, and the dependence of the Poyntingflux amplitude on the switchback radial location and rotation angle is explained quantitatively as being proportional to(B sin(θ))2. The solar windflow inside switchbacks was faster than that outside due to the frozen-in ions moving with the magnetic structure at the Alfvén speed. This energy gain results from the divergence of the Poynting flux from outside to inside the switchback, which produces a loss of electromagnetic energy on switchback entry and recovery of that energy on exit, with the lost energy appearing in the plasma flow. Switchbacks contain 0.3–10 Hz waves that may result from currents and the Kelvin–Helmholtz instability that occurs at the switchback boundaries. These waves may combine with lower frequency magnetohydrodynamic waves to heat the plasma.
Unified Astronomy Thesaurus concepts:Solar magneticfields (1503);Solar physics(1476);Solar wind(1534)
1. Introduction
An interesting result of the Parker Solar Probe mission has been the observation of switchbacks in the solar magneticfield. Switchbacks are seconds to minutes duration rotations of the magneticfield through angles that can be larger than 90°. The purpose of this paper is to discuss the evolution of switchbacks, their wave and plasma content, and their relationship to the acceleration of solar wind ions.
The Parker Solar Probe and its instruments are described elsewhere(Bale et al.2016; Fox et al.2016; Kasper et al.2016). It
is in a solar orbit with its first perihelion at 35 solar radii ( R )
occurring on 2018 November 5 and its second perihelion at 35 R
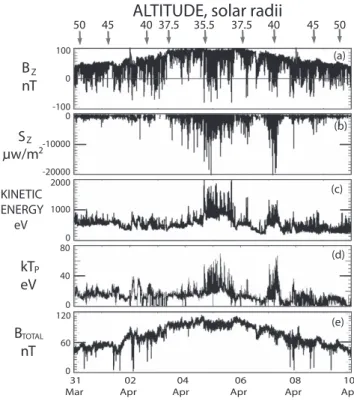
occurring on 2019 April 5. The coordinate system used in the following discussion is tied to the spacecraft, has X perpendicular to the Sun–spacecraft line, is in the ecliptic plane, is pointing in the direction of solar rotation (against the ram direction), has Y perpendicular to the ecliptic plane, is pointing southward, and has Z pointing sunward. Figure 1 presents an overview of 10 days of fields and plasma data collected around the April perihelion. Figure 1(a) gives the Z-component of the magnetic field, which
contains many spikes, which are the switchbacks(Bale et al.2019; Kasper et al.2019). Such structures were known prior to the Parker
Solar Probe launch (Yamauchi et al. 2004; Suess2007; Matteini et al.2005,2006,2014; Borovsky2016; Horbury et al.2018). The
fact that the total magneticfield in Figure1(e) was nearly devoid of
variation as the switchbacks occurred shows that the switchbacks are primarily rotations of the magneticfield.
2. Data
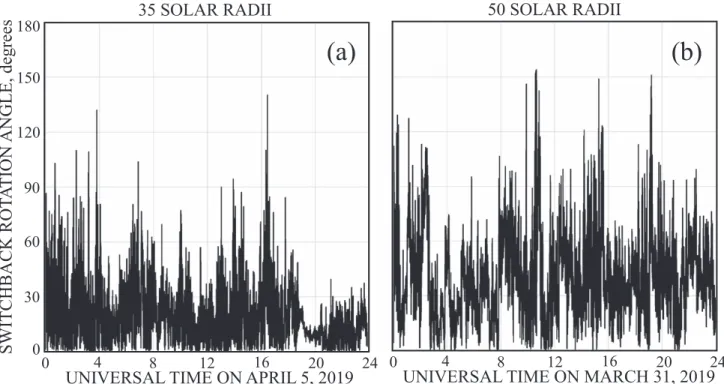
To study the evolution of the switchbacks in time, Figure2
presents the magneticfield rotation angle as a function of time for days near the ∼35 (actually 36.0) R perihelion and, five days earlier, at∼50 (actually 48.2) R . To the eye, there appear
to be more switchbacks at the outer radius, and they involved much largerfield rotations than those at perihelion. This result is made quantitative in Figure3, which gives the number of events with rotations greater than 30°, 60°, and 90° during the two days. The fact that there were many more switchbacks at the outer radius than at perihelion suggests that even fewer and smaller switchbacks occur closer to the Sun. Related statistical analyses on switchback occurrence are discussed in an accompanying article(Dudok de Wit et al.2020).
As seen in Figure 1, switchbacks contain large Poynting fluxes (Figure1(b), which gives the radial component of E ×
B/μ0, where E and B are the electric and magnetic fields),
energized ion kinetic energy(Figure1(c), which gives 0.5 mv2, where v is the plasma bulk flow), and hotter radial plasma (Figure 1(d), which is 0.5 mw2, where w is the radial plasma thermal velocity). The Poynting flux of Figure 1(b) measures
the Z-component of the electromagnetic energy, which was negative, meaning that the electromagnetic energyflowed away from the Sun, and it was spiky because the enhanced Poynting flux was embedded in magnetic field switchbacks. A striking © 2020. The Author(s). Published by the American Astronomical Society.
Original content from this work may be used under the terms of theCreative Commons Attribution 4.0 licence. Any further distribution of this work must maintain attribution to the author(s) and the title of the work, journal citation and DOI.
feature of the Poynting flux is that it was large near perihelion and an order of magnitude smaller at 50 R , both before and
after perihelion. This same spatial dependence was observed over the same radial distances on the first perihelion pass, so these four observations are assumed to represent the spatial distribution of the Poyntingflux. The proton kinetic energy of Figure1(c) increased from 500 eV/particle to nearly 2000 eV/
particle and the ion temperature of Figure1(d) increased from 20
to 60 eV in regions of enhanced Poyntingfluxes in switchbacks near perihelion.
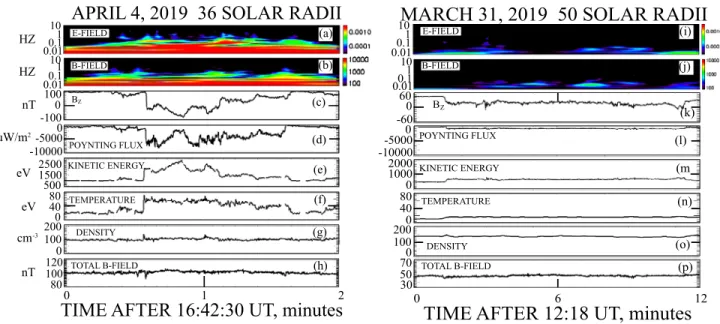
Examples of switchbacks that illustrate these enhancements, at 35 and 50 solar radii, are given in Figure4. Figures4(c) and (k)
give the radial components of the magneticfield whose value near perihelion at 35 R changed from+100 to −90 nT, while at 50 R , thefield change was from 50 to 15 nT. These changes are
characteristic of decreases of Poynting fluxes with distance and they identify these events as large amplitude switchbacks. Within the switchbacks, the largest Poyntingflux was 8000 μW m−2at 35 R (Figure4(d)) and 1000 μW m−2at 50 R(Figure4(l)).
The ion kinetic energy increased from 1000 to 3000 eV at 35 R
(Figure 4(e)) and from 500 to 600 eV at 50 R (Figure4(m)),
while the radial ion temperature increased from 20 to 60 eV at perihelion (Figure4(f)) and from 15 to 20 eV at 50 R . During
these times, the plasma densities(Figures4(g) and (o)) and total
magneticfields (Figures4(h) and (p)) remained roughly constant.
These variations are characteristic of large switchbacks seen at the two radial distances.
Figures 4(a) and (i), and (b) and (j), present spectra of the
perpendicular electric and magnetic fields, respectively. They show that the main power in the waves was at frequencies more than an order of magnitude below the∼1.5 Hz ion gyrofrequency
or the Doppler-shifted ion inertial scalefluctuations (tens of Hz at these densities and solar wind speeds). They also show that such waves had much larger amplitudes at 35 R than at 50 R . This
suggests that the waves were in the long wavelength Alfvén mode. Note that there was also wave power at 0.01–10 Hz inside the switchbacks, and these waves will be discussed below.
The next topic will be an investigation of the source and effects of the enhanced Poyntingflux, ion bulk flow, and ion temperature. Figure 5 presents plots of the Poynting flux as functions of the magnetic field rotation angle at the two distances. It shows that the magnitude of the Poynting flux increased rapidly with the rotation angle of the switchbacks and was an order of magnitude larger at perihelion than at 50R .
The absence of large Poyntingfluxes in the dashed rectangles in Figure5 shows that large Poyntingfluxes were not present outside switchbacks.
The confinement of the Poynting flux to the interior of switchbacks is understood by realizing that, outside of the switchbacks, the radial solar windflowed mostly parallel to the magneticfield. However, as the magnetic field rotates, more of the radial solar wind flow becomes perpendicular to the magneticfield, so it becomes an E × B/B2flow. Because the Poynting flux is E × B/μ0, it must also increase along with
E× B/B2as the magneticfield rotates.
One may obtain a quantitative expression for the Poynting flux as a function of the rotation angle and radial distance from the Sun in the following way. Because the solar wind speed is roughly constant between 35 and 50R , E × B/B2at afixed rotation angle is also constant. Thus, E× B/μ0is proportional to B2. At a magneticfield rotation angle, θ, the component of
velocity perpendicular to B is proportional to sinθ and the component of this component along the radial direction is also sinθ. Thus, the Poynting flux as a function of the radial distance and magnetic field direction should be equal to K(Bsinθ)2, where K is a normalizing constant. The red curves in Figure5
are plots of this function. Because they are consistent with the radial and angular variation of the Poyntingflux, they suggest that the Poyntingflux should increase rapidly at lower altitudes. However, because the magneticfield rotation likely decreases rapidly at lower altitudes (as suggested by Figure 2), this
Poyntingflux increase may not occur.
The variation of the ionflow velocity in switchbacks at 35 and 50 R is illustrated in Figure6(also noted at larger solar radii by
Matteini et al.2014) in which the black dots are the total proton
bulk speed and the red dots are the total magneticfield. The fact that the amplitudes of the red curves are independent of the magnetic field rotation angle shows that the field change was truly a rotation of thefield.
Energized ions occur in switchbacks, as shown in Figures1(c), 4, and 6. Because there are no more energetic ions inside the dashed rectangles of Figure6, which are the locations where more energetic ions, created in upstream switchbacks, would appear in local regions that are outside of switchbacks, it is also evident that such ions are confined to the interiors of switchbacks.
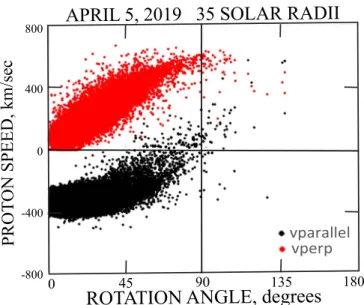
To study the mechanism behind the increase of the ion velocity in switchbacks, the locally parallel and perpendicular velocities as functions of the magneticfield rotation are plotted in Figure7for the 24 hr when the Parker Solar Probe was at its 35Rperihelion. As the magnetic field rotated to 90° inside switchbacks, the parallel(radial) velocity decreased to zero and the perpendicular (radial) velocity increased. At 90° rotation, the perpendicular speed was about 600 km s−1, while at 0°
Figure 1. Field and particle measurements during 10 days of spacecraft passage through perihelion on 2019 April 4. Switchbacks in the magneticfield (Figure 1(a)) are associated with enhancements of the Poynting flux
(Figure 1(b)) and increases of the solar wind kinetic energy and apparent
temperature(Figures1(c) and (d)).
rotation, the parallel speed was 300 km s−1. This shows that there was a net increase of the total velocity as the magnetic field rotated. The perpendicular speed increased because it included the Alfvén speed associated with the magnetic field perturbation. Thus, the increased ion velocity inside switch-backs was caused by the frozen-in ion motion with the magneticfield as they both moved radially at the Alfvén speed. The plots in Figure 7are curved. This is because they are proportional to the sine and cosine of the rotation angle, respectively.
The ion velocity in Figure 6(a) changed from about 400 to
600 km s−1 as the magnetic field rotated from 0° to 90° at perihelion. At 50R , the change in Figure 6(b) was from 350
to 450 km s−1. The fact that the velocity change was a factor of ~2 greater at 35 R can be, at least partially, understood by the 1/R decrease of the Alfvén speed between the two points, which is a factor of~1.5.
The following discussion offers an answer to the question of where the ions got their additional energy inside the switchbacks. An overwhelming percentage of the Poynting flux in typical switchbacks is in the radial direction, so this is the component discussed in the following analysis in which it is assumed that the switchback and its ions are a static structure that advects across the spacecraft. The radial divergence of the Poynting flux, ( · ) S , gives the change of electromagnetic energy across the divergence region according to Poynting’s theorem. There is no divergence outside a switchback, from one side to the other, so there is no net electromagnetic energy gain or loss outside of the switchback and there is no solar wind energy change due to the switchback. However, there is a net divergence of the Poynting flux from outside to inside the switchback so there must be a loss of electromagnetic energy upon its entrance of the switchback and a nearly equal gain of electromagnetic energy upon its exit. These divergences result in the ions inside the switchback having a greater kinetic energy than those outside. This solar wind energy gain inside a typical switchback may be estimated by assuming that the solar wind velocity outside the switchback is 400 km s−1, the density is 80 cm−3, and the Poyntingflux inside the switchback is 6000μW m−2. For these values, the divergence of the Poynting flux results in a solar wind velocity gain of 200 km s−1and the energy changes from 830 eV outside the switchback to 1900 eV inside. These results are in reasonable agreement with the observed changes of velocity and kinetic energy in Figures6and7.
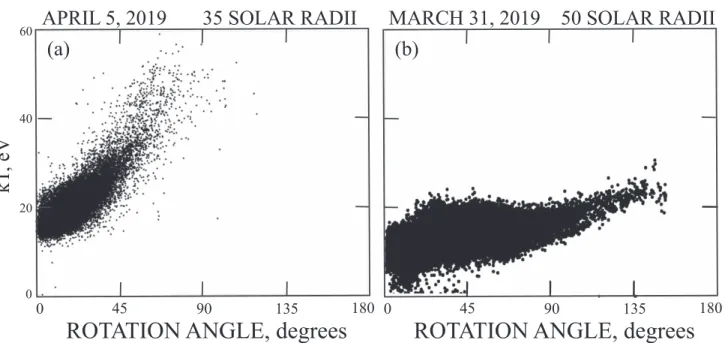
The increase of ion temperature inside switchbacks at the two radial distances is illustrated in Figure8. This may be due to one or both of the following reasons. First, the temperature measurement is made only for the plasma component along the line of sight to the Sun. As the switchback rotates, the measured quantity changes from being the parallel temperature,
Figure 2.Switchback rotation angle as a function of time during one day intervals at the perihelion distance of 35 solar radii and at 50 solar radii.
Figure 3.Number of switchbacks per day vs. their rotation angles at 35 and 50 solar radii. The increased number of large angle switchbacks at farther radial distances is illustrated.
Tpar, to the perpendicular temperature, Tperp. Thus, if Tperp/Tpar > 1, the measured temperature would increase with the switchback rotation angle. Second, because of the waves discussed below, it is possible that the plasma is heated in the switchbacks. An ongoing analysis will attempt to distinguish between these two explanations. Note that the ion temperature at the outer radius is less than that at 35 R . This is because the
ions cool as they and the magneticfield expand.
Heating cannot be produced by long wavelength, low frequency Alfvénic turbulence alone, so additional waves must
be associated with switchbacks if there is heating. Such waves are present in the wavelet spectra of Figures4(a) and (b) where the
wave intensity at ∼0.3–10 Hz is enhanced at the switchback boundaries and inside the switchbacks. Figure 9 presents expanded views at 35 and 50 R of the ∼0.3–10 Hz waves and turbulence in the data of Figure4. Figures9(a) and (d) present
the three components of the magneticfield at the two locations with the changes of BZ indicating the switchback boundaries. Figures 9(b) and (e) present the fluctuations in the magnetic
field with frequencies greater than 0.1 Hz, and Figures9(c) and (f)
Figure 4.Wavelet spectra of the perpendicular electricfield at 35R(Figure4(a)) and 50R(Figure4(i)), magnetic field wavelet spectra (Figure4(b) and (j)), and
plasma andfield parameters at typical switchbacks. The wave power spectra peaked at the abrupt changes of the magnetic field. Because the wave power was at low frequencies and the total magneticfield did not change (Figures4(h) and (p)), the waves were Alfvén mode waves. Also note the significantly greater variations of all
parameters at 35Rcompared to 50R .
Figure 5.Radial Poyntingflux as a function of the rotation angle of switchbacks at 35 and 50R . The angular range of switchback rotations was greater at 50 R and
the Poyntingflux at 90° was an order of magnitude larger at 35R than at 50 R . The red curves are equal to KB 2sin2(θ), so they accurately describe the radial and
angular dependencies of the Poyntingflux. They also show why the Poynting flux was not significant outside switchbacks, i.e., inside the dashed rectangles. The Astrophysical Journal Supplement Series, 246:68 (7pp), 2020 February Mozer et al.
give their spectra at ∼0.3–10 Hz. The amplitude of the fluctuations at 35 R was about a factor of three greater than that at 50R .
Peaks in the spectra of Figures 4 and 9 occurred at the boundaries of the switchbacks, which suggests that waves were generated at these boundaries, as shown by Krasnoselskikh et al. (2020). Because the ion velocity inside the switchbacks
was greater than that outside, it is feasible that the boundary was KH unstable and that this provided the source of these surface waves. To test this possibility, thefields were examined in the minimum variance coordinate system of the magnetic
field at each switchback boundary. The velocities at the beginning of the 35Rswitchback, near 16:43 UT and at its end, near 16:44 UT, show significant velocity shears (about 260 km s−1 and 150 km s−1, respectively) with almost zero velocity along the normal direction. These boundaries would be unstable to the KH instability if the following inequality is satisfied (Miura2003; Parks2004):
[( ) · ] ( )[( · ) ( · ) ] ( ) r r v -v k > r +r B k + B k m , 1 1 2 2 2 1 2 1 2 1 2 2 o
where the subscripts refer to the two sides of a boundary,ρ is the mass density, k is the wave vector, v is the velocity, and B is the magneticfield. For the wave normal vector directed along the velocity shear, this inequality is satisfied by a factor of ~2 at the leading edge and 1.4 at the trailing edge of the switchback at 35 Re. Applying the same criteria to the data at 50 R
shows that this crossing was marginally stable.
There are two types of perturbations associated with the solar wind switchbacks: the large-scale Alfvénic perturbation associated with the rotation of the magnetic field and the small-scale waves inside the structure that are generated at the structure’s boundaries (Krasnoselskikh et al. 2020). The
smaller-scale ∼0.3–10 Hz waves are magnetohydrodynamic modes because their Doppler-shifted frequencies are below the ion cyclotron frequency of a few Hz. These perturbations affect the plasma in two ways: first, by the large-scale reversible enhancement of the plasma bulk velocity in the switchback and, second, by predominantly pitch angle scattering of the ions by the small-scale waves. This scattering of large bulk-velocity protons may spread part of the bulk flow kinetic energy and lead to heating of protons inside the switchback. Thus, the combined interactions of these different scale perturbations with protons may guide the transfer of switch-back energy into thermal energy during the switchswitch-back propagation.
Figure 6.Proton bulk speed and the total magneticfield as functions of the switchback rotation angle at 35 and 50 solar radii. Because the total magnetic field did not vary with the rotation angle, the magneticfield variations must have been true rotations. The proton bulk speed is not enhanced outside of the switchbacks, i.e., inside the dashed rectangles.
Figure 7.Local perpendicular and parallel components of the solar windflow speed as functions of the magneticfield rotation angle. For zero rotation, the proton speed is parallel to the radial magneticfield while at 90° switchbacks, the radialflow is perpendicular to the local magnetic field, and it is larger than theflow speed outside of switchbacks (i.e., at zero degree rotations).
3. Summary
The switchback evolution in time and space has been studied with the conclusion that both the number of switchbacks per unit time and the magnetic field rotation inside them increase with the distance from the Sun. The switchbacks contained enhanced solar wind bulkflow, the Poynting flux, and thermal energy. The Poynting flux increased in switchbacks as a consequence of the rotation of the magneticfield such that the bulk flow changed from being parallel to the magnetic field to having a component perpendicular to the field. This perpend-icularflow is E × B/B2. Hence, E× B/μ0, the Poyntingflux, also increased as the magneticfield rotated. For a fixed angular rotation, the Poyntingflux varies with the radial distance from the Sun, as 1/R7. Thus, it is nearly an order of magnitude smaller at 50 solar radii than at 35 solar radii, as observed. This
radial dependence suggests the possibility that the Poynting flux is huge at smaller radii. This may be unlikely because the rotation angle also decreases at smaller radii. The Poyntingflux outside switchbacks is essentially zero because the bulkflow is almost parallel to B. Thus, the energy associated with the Poyntingflux does not accelerate the bulk ion flow.
Even so, the bulk ionflow inside switchbacks was observed to increase relative to that outside. This is because the ions are tied to the oscillating magneticfield, so they gain an additional velocity proportional to the Alfvén speed, which they lose after the switchback passes by. This energy comes from the divergence of the Poyntingflux of opposite signs upon entering and exiting the switchback. Because the Alfvén speed is proportional to 1/R, the enhanced ion speed inside switchbacks is smaller at 50 solar radii than at 35 solar radii.
Figure 8.Ion temperature as a function of the switchback rotation angle.
Figure 9.Magneticfield (Figures 9(a) and (d)), magnetic fluctuations (Figures 9(b) and (e)), and the magnetic field spectra (Figures9(c) and (f)) during the
switchbacks illustrated in Figure4.
Wave power is observed at ∼0.3–10 Hz at the boundaries and inside switchbacks. These waves may result from large velocity shears at the switchback boundaries, which cause the boundaries to be Kelvin–Helmholtz (KH) unstable.
This work was supported by NASA contract NNN06AA01C. The authors acknowledge the extraordinary contributions of the Parker Solar Probe spacecraft engineering team at the Applied Physics Laboratory at Johns Hopkins University.
ORCID iDs
F. S. Mozer https://orcid.org/0000-0002-2011-8140
O. V. Agapitov https://orcid.org/0000-0001-6427-1596
S. D. Bale https://orcid.org/0000-0002-1989-3596
T. Case https://orcid.org/0000-0002-3520-4041
T. Dudok de Wit https://orcid.org/0000-0002-4401-0943
J. C. Kasper https://orcid.org/0000-0002-7077-930X K. E. Korreck https://orcid.org/0000-0001-6095-2490 V. Krasnoselskikh https://orcid.org/0000-0002-6809-6219 R. J. MacDowall https://orcid.org/0000-0003-3112-4201 D. Malaspina https://orcid.org/0000-0003-1191-1558 M. Pulupa https://orcid.org/0000-0002-1573-7457 M. Stevens https://orcid.org/0000-0002-7728-0085 P. L Whittlesey https://orcid.org/0000-0002-7287-5098 References
Bale, S. D., Badman, S. T., Bonnell, J. W., et al. 2019,Natur, 570, 232 Bale, S. D., Goetz, K., Harvey, P. R., et al. 2016,SSRv,204, 49
Borovsky, J. E. 2016,JGRA,121, 5055
Dudok de Wit, T., Krasnoselskikh, V., Bale, S. D., et al. 2020, ApJS, doi:10. 3847/1538-4365/ab5853
Fox, N. J., Valli, M., Bale, S. D., et al. 2016,SSRv,204, 7
Horbury, T. S., Matteini, L., & Stansby, D. 2018,MNRAS,478, 1980
Kasper, J. C., Abiad, R., Auston, G., et al. 2016,SSRv,204, 131
Kasper., J. C., Bale, S. D., Belcher, J. W., et al. 2019,Natur,516, 228
Krasnoselskikh, V., Larosa, A., Agapitov, O., et al. 2020, ApJ, submitted Matteini, L., Horbury, T. S., Neugebauer, M., et al. 2014,GeoRL,41, 259
Matteini, L., Landi, S., Hellinger, P., & Velli, M. 2005, ESA Spec. Publ.,
592, 503
Matteini, L., Landi, S., Hellinger, P., & Velli, M. 2006,JGRA,222, A10101
Miura, A. 2003,JGR,108, 1076
Parks, G. K. 2004, Physics of Space Plasmas; An Introduction(Boulder, CO: Westview Press)
Suess, S. T. 2007, ESA Spec. Publ.,641, 11