HAL Id: hal-00566560
https://hal.archives-ouvertes.fr/hal-00566560
Submitted on 30 Apr 2021
HAL is a multi-disciplinary open access
archive for the deposit and dissemination of
sci-entific research documents, whether they are
pub-lished or not. The documents may come from
teaching and research institutions in France or
abroad, or from public or private research centers.
L’archive ouverte pluridisciplinaire HAL, est
destinée au dépôt et à la diffusion de documents
scientifiques de niveau recherche, publiés ou non,
émanant des établissements d’enseignement et de
recherche français ou étrangers, des laboratoires
publics ou privés.
crust to moderately great depths in the Earth: Results
from the solidus determination in the system
CaO-MgO-Al2O3-SiO2-CO2
Shantanu Keshav, Gudmundur H. Gudfinnsson
To cite this version:
Shantanu Keshav, Gudmundur H. Gudfinnsson. Experimentally dictated stability of carbonated
oceanic crust to moderately great depths in the Earth: Results from the solidus determination in
the system CaO-MgO-Al2O3-SiO2-CO2. Journal of Geophysical Research, American Geophysical
Union, 2010, 115, pp.B05205. �10.1029/2009JB006457�. �hal-00566560�
for Full Article
Experimentally dictated stability of carbonated oceanic crust
to moderately great depths in the Earth: Results from the solidus
determination in the system CaO
‐MgO‐Al
2O
3‐SiO
2‐CO
2Shantanu Keshav
1and Gudmundur H. Gudfinnsson
1Received 12 March 2009; revised 2 November 2009; accepted 17 December 2009; published 19 May 2010. [1]
Solidus melting phase relations are reported for carbonated eclogite in the system
CaO
‐MgO‐Al
2O
3‐SiO
2‐CO
2at 12 to 25 GPa. From 12 to 16 GPa, melts are in equilibrium
with clinopyroxene, stishovite, garnet, aragonite, and magnesite. At 20 and 25 GPa, melts
are in equilibrium with garnet, stishovite, calcium‐alumino silicate, calcium perovskite,
and magnesite. Melting reactions demonstrate that from 12 to 16 GPa, stishovite is in
reaction with the melt. At 20 and 25 GPa, garnet and stishovite together are produced upon
melting of model, carbonated eclogite. At 20 and 25 GPa, calcium perovskite is also the
phase that contributes the most toward liquid production. Melt compositions at all
pressures are carbonatitic, with roughly 37
–40 wt% dissolved CO
2. From 12 to 16 GPa,
the liquids are calciocarbonatites with Ca#
molarof
∼69–71; liquid compositions become
less calcic with Ca# of
∼52–55 at 20 and 25 GPa. Given these melting phase relations,
suitable subduction zone adiabats do not intersect the solidus of model carbonated eclogite
at depths investigated in the present study. Hence, on this basis, it is fair to say that
carbonated eclogite possibly avoids melting in subduction zone settings, thereby delivering
carbonate to at least moderate depths in the Earth. However, owing to local heating
events, small
‐degree melting of carbonated eclogite is not completely precluded, and
the liquids liberated from this melting can be viewed as agents of chemical mass transfer in
the deep Earth. At present, however, geochemical consequences of subduction‐related
melting of carbonated eclogite are difficult to evaluate.
Citation: Keshav, S., and G. H. Gudfinnsson (2010), Experimentally dictated stability of carbonated oceanic crust to moderately great depths in the Earth: Results from the solidus determination in the system CaO‐MgO‐Al2O3‐SiO2‐CO2, J. Geophys. Res.,
115, B05205, doi:10.1029/2009JB006457.
1.
Introduction
[2] The so‐called “carbonate ledge” at a pressure of ∼2.5–
3.0 GPa is a very prominent feature in the solidus topology of carbonated peridotite. At the ledge the solidus tempera-tures of carbonated peridotite also decrease by∼200°C, and the ledge was first reported in simplified carbonated peri-dotite in the system CaO‐MgO‐SiO2‐CO2 (CMS‐CO2
[Eggler, 1973, 1974, 1976, 1978; Wyllie and Huang, 1976]). The ledge is also present in the slightly more complex system CaO‐MgO‐Al2O3‐SiO2‐CO2(CMAS‐CO2
[Dalton and Presnall, 1998] reviewed in the work of Luth [1999] and Gudfinnsson and Presnall [2005]). It has been proposed that the melt compositions continuously change along the ledge, from a“basaltic” liquid with some dissolved CO2at lower pressures to carbonatitic with about 40–45 wt%
CO2at higher pressures [Dalton and Presnall, 1998; Luth,
1999; Gudfinnsson and Presnall, 2005]. Therefore
tempera-tures at which mantle melts and the melt compositions that result from this melting are fundamentally dependent on the nature of CO2, that is present either in vapor or crystalline
form, a feature that has been emphasized since the 1970s [Eggler, 1973, 1974, 1976, 1978; Wyllie and Huang, 1976]. After the initial drop somewhere between 2.4 and 3.0 GPa, the solidus temperature of carbonated peridotite gradually rises with pressure up to at least 8 GPa [Gudfinnsson and Presnall, 2005]. However, between 14 and 16 GPa, S. Keshav et al. (Precipitous drop in the solidus of carbonated peridotite between 14–16 GPa: Calcic carbonatites in the Earth’s tran-sition zone, paper presented at Goldschmidt Conference, Cologne, Germany, 2007) reported another drop in the soli-dus of the carbonated peridotite in the system CMS‐CO2.
Similar to the lower‐pressure topology, the solidus at higher pressure resumes a gradual positive trajectory between 16 and 20 GPa and shows slight signs of flattening between 22 and 26 GPa. Needless to say, the second drop in the solidus of carbonated peridotite has tremendous consequences for a variety of geological processes operating at depth in the Earth. [3] The other major rock type supposed to be present in
the mantle is eclogite of broadly basaltic composition. While opinions vary on its ultimate genesis, some portion of eclogite
1
Bayerisches Geoinstitut, Universität Bayreuth, Bayreuth, Germany. Copyright 2010 by the American Geophysical Union.
in the mantle is supposed to have originated from subduction of former oceanic crust at various depths. Signatures of this subduction are found in the chemistry of individual xenoliths or as high‐pressure inclusions in diamonds from the cratonic mantle, brought on the surface by violent jets of kimberlite eruptions [Stachel et al., 2005; Schulze et al., 2003; Pearson et al., 2003]. Besides the oceanic crust that undergoes sub-duction at convergent margins, it has also been proposed that in order to balance the global, continuous CO2emissions at
active volcanic centers, carbon must be recycled into the Earth’s mantle at convergent zone settings [Javoy et al., 1982; Zhang and Zindler, 1993; Kerrick and Connolly, 1998, 2001]. Most of the carbon is present in the form of crystalline carbonate (from various sources [e.g., Sleep and Zahnle, 2001]) on the top 300–400 m of the oceanic crust, and it appears that the average CO2content can be as high as 3–
4 wt% in this part of the oceanic crust [Bonatti et al., 1974; Staudigel et al., 1996; Plank and Langmuir, 1998; Jarrard, 2003]. Estimates concerning the budget of carbon in the mantle come from arc‐related and mid‐ocean ridge magma-tism [Javoy et al., 1982; Cartigny et al., 2008]. On the basis of computed, multivariant phase equilibrium work, combined with geochemistry, there are indications that volatiles retained within the oceanic crust may explain the apparent discrepancy between subducted and volcanic volatile fluxes [Kerrick and Connolly, 1998, 2001]. This aspect of carbonate subduction in the mantle at trench settings, including its influence on CO2 in the exosphere of the very early and
modern‐day Earth has attracted a great deal of attention (for reviews, see Sleep and Zahnle [2001] and Kerrick [2001]).
[4] Given suitable geotherms [Peacock and Wang, 1999;
Ganguly et al., 2009], subduction of carbonate, and by corollary, carbon, appears to be a highly efficient process [Kerrick and Connolly, 1998, 2001]. Therefore carbonate is believed to survive subduction‐related melting, making its journey relatively unscathed in the Earth’s deeper mantle and representing, in turn, a mechanism for return of carbon to the Earth’s mantle. In other words, carbonated oceanic crust (converted to eclogite), during the process of subduction at convergent margins, has the potential to deliver large amount of carbonate to the mantle. In the last few years, through studies on diamonds and their inclusions, Armstrong et al. [2007, 2008], Walter et al. [2007, 2008], and S. Keshav et al. (Majoritic‐garnets and clinopyroxenes in cratonic dia-monds: Precipitates from CO2‐rich melts, paper presented at 11th Experimental Mineralogy, Petrology, and Geochemistry Conference, Bristol, UK, 2006) have presented crucial evi-dence for signatures of melting related to carbonated peri-dotite and carbonated eclogite to relatively great depths in the Earth’s mantle. These authors have argued that the silicate inclusions trapped in some diamonds are precipitates from carbonatitic melts that resulted from melting of carbonated rocks at depths approximating∼300–500 km or more in the Earth. Therefore in some cases carbonated mantle at great depths appears to have occurred, underlying the importance of understanding melting phase relations of carbonated oce-anic crust (eclogite) at various depths in the Earth.
[5] Prior phase equilibrium experiments in model systems
have established that the carbonation reactions experiments relevant for bimineralic (dominantly clinopyroxene + garnet), and hence broadly basaltic rocks, appear to occur at pressures
higher than those for a peridotitic phase assemblage [Luth, 1999, 2006]. The intersection of these subsolidus carbonation‐ decarbonation boundary lines with the appropriate solidus would therefore be at higher pressures than in the corresponding peridotitic systems. This carbonation‐decarbonation reaction offset between carbonated mafic and ultramafic rocks means that there will be a depth interval in the Earth where CO2‐
vapor will exist in mafic rocks, while crystalline carbonate will be stable along the peridotite solidus [Luth, 1999, 2006]. [6] In the recent past, melting phase relations have also
been reported for natural, multicomponent carbonated mafic rocks (2–15 GPa [Hammouda, 2003; Dasgupta and Hirschmann, 2004; Yaxley and Brey, 2004; M. Shirasaka and E. Takahashi, A genesis of carbonatitic melt within subducted oceanic crusts: High pressure experiments in the system MORB‐CaCO3, paper presented at 8th Interna-tional Kimberlite Conference, Victoria, British Columbia, Canada, 2003]) and diopside‐CO2compositions (3–8 GPa
[Luth, 2006]). Out of these experimental studies, those by Hammouda [2003] (multicomponent), Shirasaka and Takahashi (presented paper, 2003) (multicomponent), Yaxley and Brey [2004] (relatively simplified), and Luth [2006] (diopside‐ CO2) were all done in the silica‐saturated portion of the
com-position space. On the other hand, Dasgupta and Hirschmann [2004] (multicomponent) reported experimentally determined phase relations in a silica‐undersaturated carbonated eclogite, even though Pertermann and Hirschmann [2003] reported experimental data on melting of silica‐saturated, nominally anhydrous, multicomponent, carbonate‐free eclogite. In the context of carbonate‐silicate interactions, while some studies in natural or model systems report a rather steep drop (owing to the formation of crystalline carbonate in the subsolidus) in the solidus temperatures of carbonated eclogite in the approximate pressure range of 2.5–6 GPa (Figure 1) [Hammouda, 2003; Shirasaka and Takahashi, presented paper, 2003; R. W. Luth, Melting of carbonated eclogites, paper presented at Goldschmidt Conference, Davos, Switzerland, 2009], others either do not seem to observe signs of this behavior (Figure 1) [Yaxley and Brey, 2004] or report only a gentle negative solidus curve [Dasgupta and Hirschmann, 2004]. However, in some model (Luth, presented paper, 2009) and natural systems [Hammouda, 2003; Shirasaka and Takahashi, presented paper, 2003] the solidus gains a positive slope in studies where the initial drop is observed. On the other hand, in the system diopside‐CO2, only a very gentle negative solidus
trajectory, resembling a hump, that occurs at ∼3 GPa, is reported [Luth, 2006]. Curiously, and unlike other studies, the solidus in diopside‐CO2does not resume a positive trajectory
in P‐T space and continues its downward journey (Figure 1) [Luth, 2006].
[7] Some other features related to melting phase relations
of carbonated eclogite, worthy of further commenting, are as follows: (1) moderate to considerable flattening of the sol-idus curve after approximately 5–8 GPa is a prominent feature in studies that have determined the solidus of car-bonated eclogite in natural systems (Figure 1) [Hammouda, 2003; Shirasaka and Takahashi, presented paper, 2003]; (2) among natural, silica‐saturated carbonated eclogite com-positions, the solidus temperature determinations differ by as much as ∼200–400°C at the highest pressure (Figure 1); (3) the solidus curve of natural, carbonated eclogite produced
in the work of Hammouda [2003] is explicable in terms of the simplified carbonated eclogite in the system CMAS‐CO2
(Luth, presented paper, 2009), and (4) while most studies concur that CO2vapor is not stable (owing to the appearance
of crystalline carbonate) at the solidus at pressures beyond 6– 7 GPa, one study in natural systems finds that CO2vapor,
CO2‐rich melt, and crystalline carbonates continue to coexist
with the crystalline silicate assemblage (cpx, garnet, and an SiO2polymorph) at pressures beyond 6 GPa and up to at least
15 GPa (Shirasaka and Takahashi, presented paper, 2003). [8] Besides melting phase relations, subsolidus
experi-ments coupled with analytical transmission electron micros-copy (ATEM) indicated that at elevated pressures dolomite dissociated to a mixture of CaCO3 and MgCO3, and
fur-thermore, magnesite was the stable carbon‐hosting phase down to great depths in the Earth [Biellmann et al., 1993]. Additionally, on the basis of textures obtained at high pres-sures, Biellmann et al. [1993] hinted at the interesting pos-sibility of ferropericlase also being a host for carbon in the deep Earth. Further subsolidus, in situ experiments again demonstrated that magnesite is a stable phase down to great depths in the Earth [Isshiki and Irifune, 2003]. Therefore in this respect, contrary to two previous reports [Liu, 1999; Fiquet et al., 2002] wherein magnesite was suggested to have undergone dissociation to its individual components, MgO + CO2, neither Biellmann et al. [1993] nor Isshiki and Irifune
[2003] observes such dissociation. Petrologically, all these experimental observations have tremendous consequences for the behavior of carbon in the mantle, dominantly through the process of subduction of carbonates along convergent margins, its identity in the deeper Earth, generation of partial melts owing to carbonate‐assisted processes in the deeper mantle, and influence of this melting on the overall geo-chemistry of the mantle at various depths.
[9] Therefore given the background above, clarifying the
solidus of carbonated eclogite at high pressures is the most fundamental task inasmuch as (1) the solidus topology con-trols the fate of subducted carbonate in the deeper mantle; (2) the impact of topology on local or extensive melting (if at all); (3) the possible relationship between the carbonated peridotite and carbonated eclogite solidi at these depths; (4) subduction of carbonated eclogite and its possible rec-ognition in deep mantle samples; and (5) eventually the possibility of carbonate survival at these and greater depths. With these issues in mind, we have determined the solidus melting phase relations of simplified carbonated eclogite between 12 and 25 GPa in a multianvil device. This pressure range corresponds to depths of∼350–720 km in the Earth. In this contribution, we have chosen to focus on the part of composition space in the system CaO‐MgO‐Al2O3‐
SiO2‐CO2(CMAS‐CO2), which is analogous to the natural
carbonate‐bearing mantle with eclogitic bulk composition.
2.
Experimental and Analytical Details
[10] For the experiments reported here, three grams each of
starting compositions (Table 1) were prepared using CaCO3
(Alfa Aesar®, 99.998%), MgO (Alfa Aesar®, 99.997%), Al2O3(Alfa Aesar®, 99.998%), SiO2(Aldrich®, 99.995%),
and magnesite (the source of some of MgO and all of CO2;
Krantz®, Bonn, Germany). Silicate portion of the starting mixtures was prepared first. All the components were fired in Pt crucibles for at least 17 h in air, MgO, Al2O3, and SiO2at
1250°C and CaCO3 at 400°C. Pt crucibles were used that
had not been previously used to dry either iron metal or iron oxides. For any particular mix, fired oxides and CaCO3were
immediately mixed in appropriate proportions, and ground for at least 1 h under ethanol in an agate mortar. After drying Figure 1. Solidus curves for dry and carbonated eclogites plus diopside‐CO2systems. Descriptions are
as follows: dry eclogite [Yasuda and Fujii, 1994]; S‐T is natural, carbonated eclogite (Shirasaka and Takahashi, presented paper, 2003); H is natural, carbonated eclogite [Hammouda, 2003]; Y‐B is natural, carbonated eclogite [Yaxley and Brey, 2004]; D‐H is natural, carbonated eclogite [Dasgupta and Hirschmann, 2004], and L is Diopside‐CO2system [Luth, 2006]. Please see the text for further details
under an infrared (IR) heat lamp, this mixture was dec-arbonated in a Pt crucible, in air in a box furnace. To decar-bonate, temperature of the furnace was slowly raised to 1000°C over 10 h, and kept at this temperature for another 6–7 h. After this step, the Pt crucible was cooled in air for ∼5 min and transferred to another higher‐temperature furnace to prepare glass. Silicate glass of a particular mix was made in air at 1650°C for 4–5 h. To quench this portion, the Pt crucible was partially immersed in an ice‐cold container, and the resulting glass was optically transparent. To ensure homogeneity, the silicate glass was reground for 1 h under ethanol in an agate mortar and then dried under an IR heat lamp for 45 min. Finely ground magnesite (source of some MgO and all of CO2) was fired at 200–250°C in air in a Pt crucible for over
17 h. Along with the magnesite firing step, the ground silicate glass was also kept in a furnace at 1000°C. After firing these two individual components together, they were mixed and ground in an agate mortar under ethanol for another 1 h and the final contents poured in a glass vial and stored in a desiccator. Nominal compositions of the starting mixtures employed in the present study are reported in Table 1.
[11] All the experiments were made in a traditional,
uni-axial, split‐sphere, multianvil apparatus (MA6/8 module) installed at Bayerisches Geoinstitut (BGI). This module is a device that has a maximum thrust of 1200 ton (Sumitomo 1200). The experiments were performed using Cr2O3‐doped
MgO pressure cells at 12 and 14 GPa with an edge length of 14 mm and at 16, 20, and 25 GPa with an edge length of 10 mm. Second‐stage tungsten carbide anvils (32 mm edge length) with 8 mm (Toshiba F grade), 5 mm (Toshiba F grade), and 4 mm (Widia F grade) truncated edge lengths were employed in experiments at 12 and 14 GPa, 16, 20, and 25 GPa, respectively. Pyrophyllite was used as gasket material in all the experiments. All the pressure cells used in this study have similar internal configurations, consisting of zirconia thermal insulators, dense 4‐bore alumina sleeves for thermocouples, and soft magnesia and alumina inserts. Cells with 14 mm and 10 mm edge length have stepped and straight lanthanum chromate (LaCrO3) heaters, respectively.
In all pressure cells, molybdenum (Mo) rings on either end of the heaters serve as electric contacts with the second‐ stage WC anvils. For all the experiments, ∼0.2–0.4 mg of a starting mix was loaded into a Pt capsule (1.2 or 1.6 mm outer diameter; 1.1–2.0 mm final length). The capsule had previously been annealed in air at 1000°C, sealed at one end by arc welding, boiled in dilute HCl (30–45 min), ultra-sonically cleaned in ethanol (10 min), and fired again in air at 1000°C for 10 min. The other end of the capsule was three‐way crimped, and finally the capsule was lightly
hammered. The top end of the capsule therefore was pressure sealed. Before assembling the pressure cell, the loaded cap-sule was again dried in air at 175–200°C for over 14–16 h.
[12] Run temperature was measured using type D (W75Re25/
W97Re3) thermocouple wires (0.15 or 0.13 mm thick;
Omega®) that were in direct contact with the Pt capsule. Temperatures reported in the manuscript are thermocouple readings, and the effect of pressure on the thermocouple emf was ignored. Temperature was controlled to within ±2° C of the target temperature using a Eurotherm controller. To ensure anhydrous conditions during the experiments, all the cell parts (except Mo electrodes and capsules) were fired in air at 1000°C in a box furnace for 1 h. After construction and before an experiment, the entire cell was kept dry in an oven at 175°C. After each run, the Pt capsule was recovered from the cell, mounted longitudinally in epoxy, and ground and polished for optical and electron microprobe examination. After termination of an experiment, the thermocouple junction was always confirmed as being in direct contact with the capsule. Owing to the water‐soluble nature of carbonate, runs were polished under water‐absent condi-tions, and charges also had to be vacuum‐impregnated with resin.
[13] High‐temperature (1200–1600°C) calibrations for the
pressure cells employed in this study are derived on the basis of previous determinations done on Sumitomo 1200 at Bayerisches Geoinstitut. These determinations have been reported in a few publications [Canil, 1994; Frost and Langenhorst, 2001; Keppler and Frost, 2001]. In summary, these fixed pressure points have employed coesite‐stishovite, forsterite‐wadsleyite, wadsleyite‐ringwoodite, and dissocia-tion of ringwoodite to magnesium‐silicate perovskite and periclase phase boundaries. The interested reader is referred to the above mentioned publications for further details.
[14] The compositions of the crystalline phases and melt
were determined by wavelength‐dispersive electron micro-probe analyzer (5‐spectrometer JEOL‐JXA‐8900 Supermicro-probe at BGI) with an accelerating voltage of 15 kV and 15 nA probe current (at the Faraday cup). Melt was analyzed using a beam diameter of 3–10 mm. The beam diameter was 1–2 mm for crystalline phases, and all the analyses were performed in a fixed spot mode. Analyses were reduced using the ZAF correction scheme, and the amount of CO2in melt and
car-bonate was calculated by difference. All the four oxides were measured using a combination of forsterite, diopside, pyrope, and enstatite standards.
3.
Definition of the Solidus in Model Systems
[15] Normally, the solidus is defined as a curve in P‐T
space, below which melt is absent. However, this definition applies strictly only to natural, multicomponent systems. In model, low‐variance systems, bulk compositions can be adjusted so as to maximize the amount of liquid, without modifying the melting phase relations or phase compositions. We adopted this strategy so that liquid compositions can be retrieved using the electron microprobe. Therefore in the melting phase relations reported here, the solidus is ideally defined as full set of the relevant phase assemblage present, making it iso-barically either invariant or univariant. In case where invari-ance is not reached, temperature brackets are provided. In an ideal case, melt will always be present on the low‐temperature
Table 1. Nominal Composition of Starting Mixtures Employed in the Present Studya
Mixture CaO MgO Al2O3 SiO2 CO2b
EC‐CO2‐1‐A 21.23 22.49 4.02 30.80 21.46 EC‐CO2‐1‐B 22.80 19.69 3.87 27.66 25.98 EC‐CO2‐1‐C 21.43 22.28 3.71 31.71 20.87 EC‐CO2‐1‐D 23.42 19.86 3.88 27.07 25.77 EC‐CO2‐1‐E 22.11 20.60 3.85 29.17 24.27 EC‐CO2‐2‐A 21.77 17.50 10.28 30.23 20.22 EC‐CO2‐4‐A 22.93 20.32 4.01 28.73 24.01 aCompositions are measured by weight.
b
side of the melting curve, since starting compositions are tailored to yield large amount of melt. However, sometimes melt might not be present on the low temperature side of the bracket, but the philosophy remains the same. In this manner, the solidus is rigorously determined.
4.
Experimental Charges and Phase Assemblages
[16] In the experiments reported here, melt does not occur
as glass, but as an intergrowth of silicates and carbonates (hereafter, quench refers to quenched melt; Figure 2a). Melt is mainly present as separate pools (∼50–100 mm long by ∼50–100 mm wide; Figure 2b), but interstitial melt pockets (∼5–40 mm across; Figure 2c) are also seen. Unlike exper-imental charges in simplified carbonated peridotite [Dalton and Presnall, 1998; Gudfinnsson and Presnall, 2005] and in the system diopside‐CO2[Luth, 2006], melt in our
exper-imental charges here does not seem to segregate itself from the crystalline phases (Figure 2d). Some partial segregation does occur, but more often, melt is largely interstitial and wets all the crystalline phase boundaries. In polished sections, melt can be distinguished from crystalline carbonate owing to its quenched texture, relatively low relief, beam damage after quantitative analyses, and lack of fluorescence under the backscatter electron microprobe beam. The brightest crys-talline phases in all the experiments, as observed in back-scatter images, are either clinopyroxene or aragonite. Clinopyroxene, which is present at 12 (Figure 3a),
14 (Figure 3b), and 16 GPa (Figure 3c) occurs as equant shaped grains. The clinopyroxene grains normally range between∼10 and 40 mm across but on occasions can reach up to 50–75 mm across. They are always in contact with either large quench pools or smaller melt pockets and also occur uniformly throughout the charge. Clinopyroxene emits pale blue fluorescence under the electron microprobe beam and does not exhibit beam damage. Occasionally, it occurs as an inclusion in either aragonite or magnesite (Figure 3d) and sometimes also hosts roundish crystals of majoritic garnet.
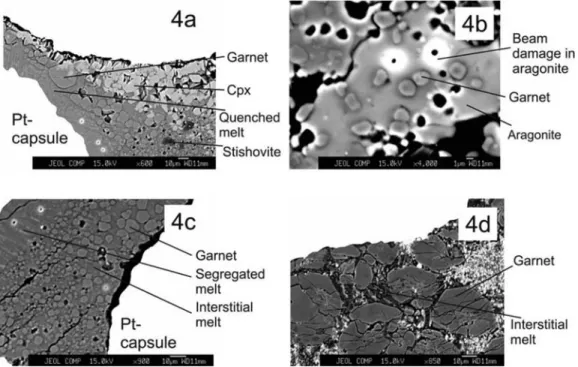
[17] In the experiments reported here, garnet occurs at
all pressures. Compared to cpx in backscatter images, it is a relatively dark phase and occurs both as a discrete phase (Figure 4a) and as inclusions in either aragonite or cpx (Figure 4b). From cpx, garnet can be distinguished by its subhedral appearance, higher‐relief, roundish grain bound-aries, and lack of fluorescence under the electron micro-probe beam. When garnet occurs as an inclusion in either aragonite or cpx, it rarely exceeds 5–10 mm across. When it occurs as separate, discrete phase, it attains dimensions of 10–20 mm across, occurs uniformly throughout the experi-mental charge, and is always in physical contact with quenched melt (Figure 4c). At 25 GPa, majoritic garnet is considerable larger in size than at lower pressures (Figure 4d).
[18] A silica polymorph (assigned as stishovite, discussed
later) occurs in all the experiments reported here. In back-scatter images, stishovite is much darker than cpx, quenched Figure 2. Backscatter electron (BSE) images of a few experimental charges showing melt‐related
fea-tures: (a) this image exhibits the described nonglassy texture of experimentally produced melt at 20 GPa/ 1590°C; (b) image demonstrating segregation of experimentally produced melt on either end of the Pt‐capsule at 20 GPa/1590°C; (c) BSE image of a charge at 16 GPa/1425°C, showing interstitial melt and its relation with crystalline silicates, in this case, garnet and stishovite. Some of the void space visible in this charge has developed during the course of polishing the grain mount on silicon carbide (SiC) paper; (d) BSE image of an average experimental charge. The ultradark arms represent magnesite.
Figure 3. BSE images showing textural arrangement of clinopyroxene (cpx), at (a) 12 GPa/1275°C in the presence of melt. In this particular charge, melt primarily occurs as an interstitial phase; (b) 14 GPa/ 1375°C, with randomly distributed grains of garnet and stishovite. Void space has formed owing to pol-ishing on SiC paper during which grains tend to fall out from the charge mount; (c) 16 GPa/1425°C. This is perhaps the only charge where cpx has attained relatively huge dimensions and also contains garnet inclusions, and (d) 12 GPa/1275°C. In this case, cpx occurs as clusters of individual grains in magnesite.
Figure 4. BSE images displaying garnet in some experiments with respect to (a) liquid and cpx at 16 GPa/1425°C; (b) aragonite at 16 GPa/1425°C. In this particular shot, garnet occurs as an inclusion in relatively large aragonite grains; (c) slightly segregated and interstitial liquid at 12 GPa/1275°C, and (d) interstitial liquid at 25 GPa/1850°C. This is the only charge where garnet attains such big dimensions and also has this cracked appearance.
melt, and garnet (Figure 5a). It also has higher relief than the crystalline phases named above. Stishovite is normally on the thin side (Figure 5b), although it can be on stubby (Figure 5c). At places it is slightly acicular, and under backscatter electron beam, it exhibits strong, bluish‐green fluorescence. Stishovite never exceeds 5–10 mm across, although it can be∼10–15 mm long. It generally occurs uni-formly throughout the experimental charge in physical con-tact with melt, but at places it can be found clinging to magnesite (Figure 5d). After quantitative analyses, stishovite shows slight beam damage (Figures 5a and 5c).
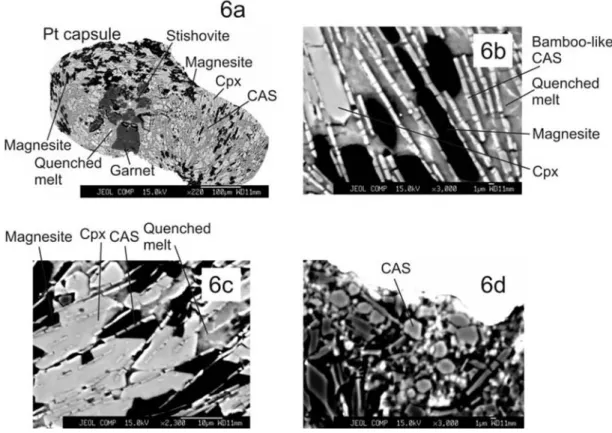
[19] In part of the composition space studied here, a
highly aluminous phase, calcium‐alumino‐silicate (CAS) also becomes stable. Being a new phase, it deserves more attention than a mere mention. In the experiments reported here, CAS occurs at 20 and 25 GPa. At 20 GPa, it is the most acicular of all the phases seen in the experiments (Figure 6a). On an average, CAS is roughly 10–15 mm long by 3–4 mm wide (Figure 6a) and does not exhibit any sort of fluorescence under the electron beam. Individual grains of CAS stack up on top of each other, resembling bamboo shoots (Figure 6b). In backscatter images, it is a fairly light‐ shaded phase but can be distinguished from other phases by its distinct habit. It normally cuts through quenched melt (Figure 6c). However, on closer inspection, CAS also cuts the grain of other phases, like cpx and crystalline car-bonate (Figure 6c), confirming that it is a stable, equilibrium crystalline phase. Owing to its peculiar habit, CAS provides a kind of schistose fabric to the experimental charge (Figure 6a) and is uniformly distributed in the sectioned experimental charge at this pressure. At 25 GPa, however, CAS changes its
habit, becoming rounder (Figure 6d) with relief that appears slightly higher than neighboring garnet. In addition, CAS does not show damage under electron microprobe beam.
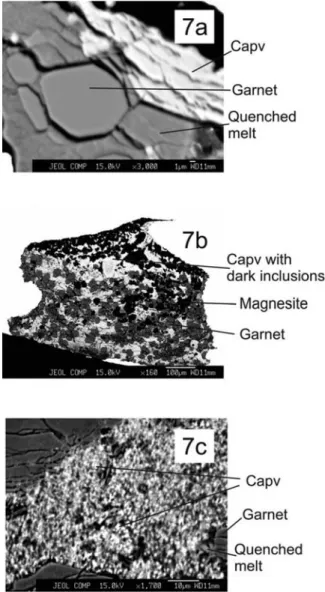
[20] Calcium perovskite (Capv), present in experiments at
20 (Figure 7a) and 25 GPa (Figures 7b and 7c), is a rela-tively bright phase in backscatter images. Calcium perov-skite can be distinguished from cpx owing to its general lack of textural homogeneity and crystal outlines. Calcium perovskite dominantly occurs as small (∼10–20 mm) and amorphous looking masses (Figure 7c) and tends to be uniformly distributed throughout the experimental charge. Like other phases, it is in contact with quench pools/pockets. It always exhibits evidence of beam damage under the elec-tron probe beam, and it appears that the amorphous nature is related to its transformation during decompression from elevated pressures [Liu and Ringwood, 1975]. At places, Capv hosts a number of grains of a much darker phase, whose identity cannot be revealed at the scale of observation.
[21] In the melting phase relations presented here, there
are two stable crystalline carbonate phases, almost pure CaCO3and magnesite with a limited CaCO3solid solution.
We have assigned CaCO3to its aragonite form, and reasons
for this designation are discussed later in the manuscript. Together, aragonite and magnesite are present in experiments at 12 (Figure 8a), 14 (Figure 8b), and 16 GPa (Figure 8c). Above 16 GPa, however, aragonite is no longer present in the experimental charges. When present, aragonite is a relatively bright phase in backscatter images, occupies low grounds, and can be amoeboid in outlines. In this textural aspect, aragonite in these experiments resembles that seen in low‐ pressure, subsolidus experiments of Luth [2001] and melting Figure 5. A series of BSE images showing stishovite at (a) 12 GPa/1275°C and next to magnesite,
gar-net, and cpx. Compared to rest of the phases, stishovite occurs as a phase with a higher relief; (b) 14 GPa/ 1375°C. Compared to Figure 5a, in this case, stishovite has slightly more well‐developed grain margins; (c) 16 GPa/1425°C. In this run, electron beam damage in stishovite is noticeable, and (d) 20 GPa/1590°C. Here, stishovite occurs as an inclusion in large magnesite.
and subsolidus experiments of Buob et al. [2006]. Unlike the two studies mentioned above, in our experiments, we do not observe features consistent with intergrowth of aragonite with magnesite. Aragonite can be differentiated from cpx on the basis of lack of fluorescence and more anhedral textural features. Aragonite lacks quench features and therefore is easy to distinguish from quenched melt; however, aragonite does show signs of damage after quantitative analyses. Magnesite is present in all the experiments, and at a given contrast/brightness signal level in backscatter images it is the darkest phase (Figure 8d). In general, it tends to occupy a significant portion of the experimental charge (Figure 8e) and is in physical contact with quenched melt pockets. In some runs it can also occur as a separate, dark band (Figure 8f), but in such cases, small quench pockets were observed to be in contact with it. Frequently, magnesite also has inclusions of stishovite, and at places, it also hosts small, round grains of garnet.
5.
Phase Compositions
[22] In the experimental data presented here, melting
phase relations pertaining to the solidus of carbonated eclogite only are reported. The thermal stability of crys-talline carbonate and evolution of liquid compositions in equilibrium with the relevant crystalline assemblage above the solidus is subject matter of another publication. Here, melts in equilibrium with the crystalline assemblage do not show signs of liquid immiscibility. Also, contrary to
a previous report (Shirasaka and Takahashi, presented paper, 2003), free CO2 is absent in the run products
described here. Possible reason(s) for the mentioned dis-agreement are not currently understood.
[23] Melt compositions in the system studied here are
carbonatitic with roughly 37–40 wt% dissolved CO2. From
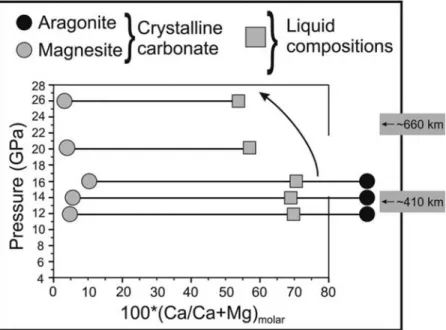
12 to 16 GPa melts are calciocarbonatites with Ca# (molar Ca/Ca+Mg*100) of ∼67–71 (Table 2). These melts com-positions are characterized by fairly low silica concentra-tions. In this respect, these melt compositions are slightly different from a few previous studies performed in either carbonated peridotite or carbonated eclogite systems at lower pressures, where higher silica concentrations, reaching up to∼3–5 wt% have been reported [Dalton and Presnall, 1998; Dasgupta and Hirschmann, 2004; Gudfinnsson and Presnall, 2005]. In the work of Hammouda [2003], variable (0–10 wt%) silica concentrations are seen, but these liquids are still carbonatitic. In our experiments, the calcic nature of melts is compromised beyond 16 GPa. Liquids, both at 20 and 25 GPa, are more magnesian than at lower pressures (Figure 9). For example, the Ca# of melts at these pressures is approximately 52–55 and hence resembles those reported for liquids in equilibrium with carbonated peridotite [Dalton and Presnall, 1998]. With increasing pressure, the changes in melt compositions can also be clearly seen in a ternary pro-jection onto the C‐M‐S base from CO2(Figure 10). In
por-traying compositional data in Figures 9 and 10, we have adopted the schemes outlined by Dalton and Presnall [1998] Figure 6. Images showing the appearance of CAS phase in the experiments described here: (a) overall
map of the 20 GPa charge, where CAS first becomes visible; (b) bamboo‐like appearance of CAS, along with neighboring magnesite, cpx, and quenched melt; (c) occurrence of CAS in cpx, demonstrating that it is not a phase formed upon quenching, and (d) CAS at 25 GPa/1850°C. In contrast to the charge at 20 GPa, CAS in this run, occurs as in subhedral form.
and Gudfinnsson and Presnall [2005]. In this respect, it should be noted that the melt compositions in the system CMAS‐CO2, since they contain a tiny amount of alumina, are
slightly off the CMS plane.
[24] The two crystalline carbonates have the composition
corresponding to CaCO3 and magnesite with a limited
amount of calcite solid solution. Although we have not performed determinative analyses, on the basis of previous phase equilibrium determinations performed at elevated pressures and temperatures [Liu and Lin, 1995; Luth, 2001], the CaCO3 phase in our manuscript is assigned to be
ara-gonite. Aragonite is virtually end‐member in composition, with <1 wt% MgO. Magnesite, on the other hand, shows a fair amount of calcite in solid solution, with concentrations of CaO reaching as high as ∼6 wt%. However, more gen-erally, CaO concentrations in magnesite do not exceed ∼4 wt%, and in melt‐absent, true subsolidus runs, magnesite is virtually free of CaO. Crystalline carbonates in our
experi-ments also do not show signs of dissociation to their indi-vidual components, CaO + CO2 or MgO + CO2, an
experimental observation that is in contrast to previous suggestions [Liu, 1999; Fiquet et al., 2002]. After the dis-appearance of aragonite at 16 GPa, melts are in equilibrium only with magnesite, a trend that continues up to 25 GPa. Compositions of crystalline carbonate in equilibrium with melt compositions at various pressures are shown in Figure 9.
[25] A SiO2 polymorph is present in all the experiments
reported here, and its precise identity should be discussed in the light of previous experimental/theoretical works. We are aware that there are fairly large experimental discrepancies in defining the slope of the boundary line between coesite and stishovite in P‐T space [Yagi and Akimoto, 1976; Zhang et al., 1993; Serghiou et al., 1995]. However, comparison with these previous studies would seem to indicate that it is stishovite. Besides Al2O3, in our experiments, stishovite
lacks measurable concentrations of all the other oxides. Stishovite accommodates approximately 0.4–2 wt% Al2O3,
and in this respect, is similar to the experimental data re-ported on hydrous mid‐ocean ridge basalt (multicomponent) [Litasov and Ohtani, 2005].
[26] Garnet is more majoritic at 12 to 16 GPa than at
higher pressures. In this pressure range, the concentrations of CaO (lime) and MgO (magnesia) are roughly equal. At 20 and 25 GPa, garnets become significantly more alumi-nous and much less siliceous, attaining“pyropic” character. At these pressures, garnets also appear to be slightly more magnesian and less calcic than at lower pressures. Clin-opyroxene in the experiments is a solid solution of lime, magnesia, and alumina components. Unlike Hammouda [2003], cpx in the experiments reported here is much less aluminous, mostly with 1–5 wt% Al2O3. Higher than a
percent concentrations of alumina in cpx are found below the true solidus, that is when not all the required (six in our case) phases are present in the same charge.
[27] In the present set of experiments, calcium‐alumino
silicate (CAS) becomes stable at 20 GPa. In the absence of experiments spanning the range 16 to 20 GPa, we are not in a position to place a minimum pressure when CAS first becomes stable; CAS also becomes stable at 20 GPa and is absent at 18 GPa in melting phase relations reported on multicomponent, hydrous mid‐ocean ridge basalt (MORB) [Litasov and Ohtani, 2005]. Although we recognize that the behavior of carbonated eclogite (this work) is different from that of hydrous MORB, the similarity in the order of appearance of CAS in both the systems indicates that the model system chosen here captures the essence of melting phase relations of carbonated oceanic crust. Therefore on this basis we infer that in our experiments CAS likewise could have been a stable phase at pressures slightly lower than 20 GPa. At 20 GPa, CAS approximately has 18 wt% CaO, 1.5 wt% MgO, 40 wt% Al2O3, and 40 wt% SiO2. At
25 GPa, however, the concentrations of MgO and Al2O3
increase to∼4 and 44 wt%, respectively, with CaO remaining near 16 wt% and SiO2 decreasing to 36 wt% (Table 2).
Calcium silicate perovskite (capv) is first observed at 20 GPa and is also a stable phase at 25 GPa. Like in previous studies [Canil, 1994], composition of Capv is difficult to determine especially at 25 GPa with certainty, with microprobe analyses summing up to 96–97 wt%; Figure 7. Calcium perovskite in BSE images at (a) 20 GPa,
occurring alongside garnet and quenched melt, (b) an overall shot of calcium perovskite‐bearing charge at 25 GPa, along with garnet and magnesite, and (c) close‐up of Figure 7b. Notice how compared to Figure 7a, calcium perovskite in Figures 7b and 7c is full of tiny, dark inclusions.
however, good microprobe analyses are obtained at 20 GPa (Table 2).
6.
Melting Phase Relations of Model Carbonated
Eclogite and Comparison With Previous Work
[28] At a fixed pressure in the system CMAS‐CO2, the
studied phase relations involving six phases at the solidus are invariant, and it is possible through algebraic methods outlined by Presnall [1986] to determine if the solidus is of eutectic or peritectic nature. Provided all the phases are present, the melting phase relations reported here stay valid for any model combination of carbonated eclogite. The phase
equilibrium philosophy adopted here also means that as long as all the phases at the solidus are present in the experimental charges, the choice of starting composition does not affect the phase compositions. Eventually, the resulting phase equilib-rium data can be used to model very small degrees of melting in a portion of the mantle with the same phase assemblage. Therefore by studying the system CMAS‐CO2, melts
analo-gous to very small degree mantle magmas can be readily analyzed by the electron microprobe, and solidus tempera-tures as a function of pressure can be determined with great rigor. This is a huge advantage over experiments that employ multicomponent (natural) starting compositions to determine the solidus, as in this case: (1) solidus melting relations are Figure 8. Aragonite and magnesite under BSE in experimental charges: (a) aragonite (very light) and
magnesite (ultradark), sitting next to each other at 16 GPa/1425°C; (b) wormy‐looking aragonite at 12 GPa/1225°C; (c) subhedral aragonite; (d) random distribution of magnesite (darkest phase at this con-trast and brightness) at 16 GPa; (e) magnesite occurring as a band at the top of capsule at 12 GPa. The thermocouple junction is in the opposite direction to magnesite, and (f) magnesite occurring dominantly as a band at the top but also a tiny sliver at the bottom of this particular capsule. The thermocouple junc-tion is where the sliver occurs.
multivariant; (2) owing to severe quench modification, low‐ degree, solidus melt compositions are impossible to analyze, and therefore the very task of understanding mantle melting processes is defeated; and (3) in natural systems it can be very difficult to determine when melting initiates, and as a corol-lary, the solidus temperatures are influenced by the amount of CO2in the starting mixtures.
[29] Shown in Figure 11, the solidus of model carbonated
eclogite in this manuscript is defined as follows: (1) 12 GPa/ 1225–1275°C; 14 GPa/1325–1375°C; 16 GPa/1425°C − aragonite + magnesite + cpx + garnet + stishovite + liquid; (2) 20 GPa/1590°C; 25 GPa/1850°C− magnesite + garnet + stishovite + CAS + capv + liquid.
[30] At 12 and 14 GPa, the solidus curve is bracketed
with two temperature points each that are 50°C apart from one another. Therefore at 12 and 14 GPa we have placed the solidus temperatures at 1250 and 1350°C, respectively. However, at 16, 20, and 25 GPa, the required phase assemblage is present. Additionally, since two different phase assemblages occur at 16 GPa/1425°C (aragonite + magnesite + cpx + garnet + stishovite + liquid) and 20 GPa/1590°C (magnesite + garnet + CAS + stishovite + capv + liquid), there must exist two pressure‐temperature invariant points somewhere between these experimental runs. One of them will consist of aragonite + magnesite + clinopyroxene + garnet + stishovite + CAS + melt; the second invariant point should have magnesite + clinopyroxene + garnet + stishovite + CAS + Capv + melt. Owing to lack of densely gathered data between 16 and 20 GPa, the precise position of these two invariant points, at the moment, is difficult to locate in P‐T space.
However, we note that (1) the CAS phase has been reported in studies done on MORB‐type compositions [Hirose et al., 1999; Hirose and Fei, 2002], at pressures exceeding 20 GPa; (2) More recently, Litasov and Ohtani [2005] reported melting phase relations for both dry and hydrous MORB composition. In their work, CAS coexisted with Figure 9. Plot of pressure (P) in GPa versus 100*Ca/Ca+Mgmolar(Ca#) ratio of coexisting crystalline
carbonates (black and gray circles; aragonite and magnesite together at 12–16 GPa, magnesite at 20 and 25 GPa) and liquid (filled, gray squares) compositions determined at the solidus of simplified car-bonated eclogite. The arrow signifies the shift in liquid compositions at 20 and 25 GPa. It is to be noted that since at 12 and 14 GPa, isobaric invariance does not happen (meaning solidus is bracketed) and liquid first becomes noticeable at temperatures that are slightly higher than ideal, some interpolation in liquid compositions is performed. The above is done only to be in accord with the 16 GPa data, wherein isobaric invariance is achieved. To avoid clutter, the horizontal axis has not been extended to 100.
Figure 10. Projected from CO2onto the CaO‐MgO‐SiO2
(CMS) base, liquid compositions (in filled, gray circles) are shown. Numbers adjacent to the circles denote pressure in GPa. The thick, solid line in the ternary is the trend of liq-uid compositions in equilibrium with carbonated peridotite in the system CMAS‐CO2from 3 to 7 GPa as determined
previously [Dalton and Presnall, 1998; Gudfinnsson and Presnall, 2005]. Compared to liquids derived from car-bonated eclogite (this work), those from carcar-bonated peri-dotite are slightly on the more siliceous side.
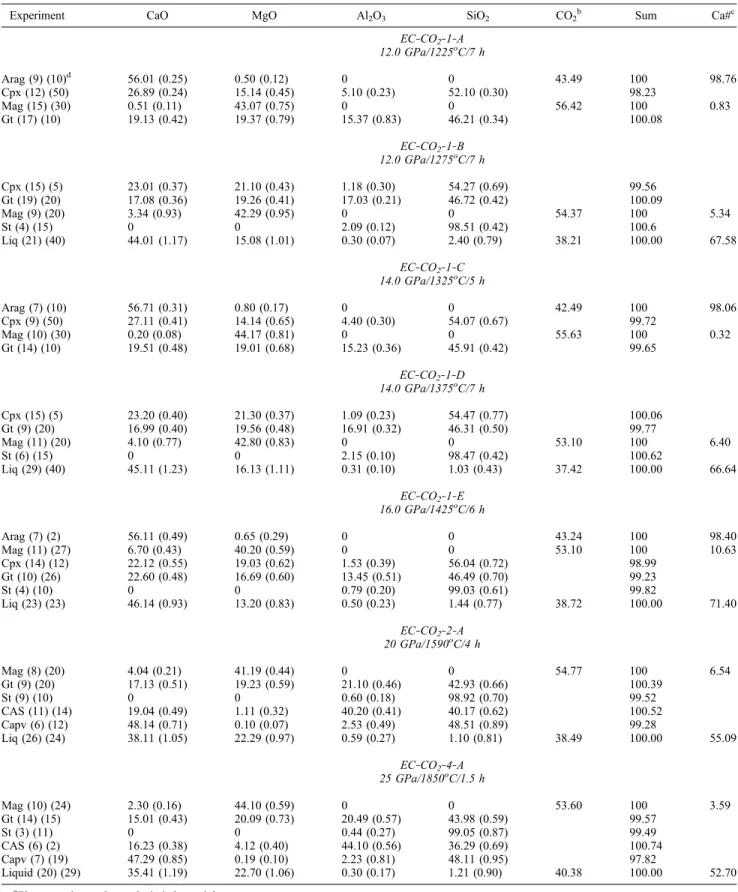
Table 2. Experimental Details, Run Products, and Electron Microprobe Analyses of Crystalline Phases and Quenched Liquidsa
Experiment CaO MgO Al2O3 SiO2 CO2
b Sum Ca#c EC‐CO2‐1‐A 12.0 GPa/1225oC/7 h Arag (9) (10)d 56.01 (0.25) 0.50 (0.12) 0 0 43.49 100 98.76 Cpx (12) (50) 26.89 (0.24) 15.14 (0.45) 5.10 (0.23) 52.10 (0.30) 98.23 Mag (15) (30) 0.51 (0.11) 43.07 (0.75) 0 0 56.42 100 0.83 Gt (17) (10) 19.13 (0.42) 19.37 (0.79) 15.37 (0.83) 46.21 (0.34) 100.08 EC‐CO2‐1‐B 12.0 GPa/1275oC/7 h Cpx (15) (5) 23.01 (0.37) 21.10 (0.43) 1.18 (0.30) 54.27 (0.69) 99.56 Gt (19) (20) 17.08 (0.36) 19.26 (0.41) 17.03 (0.21) 46.72 (0.42) 100.09 Mag (9) (20) 3.34 (0.93) 42.29 (0.95) 0 0 54.37 100 5.34 St (4) (15) 0 0 2.09 (0.12) 98.51 (0.42) 100.6 Liq (21) (40) 44.01 (1.17) 15.08 (1.01) 0.30 (0.07) 2.40 (0.79) 38.21 100.00 67.58 EC‐CO2‐1‐C 14.0 GPa/1325oC/5 h Arag (7) (10) 56.71 (0.31) 0.80 (0.17) 0 0 42.49 100 98.06 Cpx (9) (50) 27.11 (0.41) 14.14 (0.65) 4.40 (0.30) 54.07 (0.67) 99.72 Mag (10) (30) 0.20 (0.08) 44.17 (0.81) 0 0 55.63 100 0.32 Gt (14) (10) 19.51 (0.48) 19.01 (0.68) 15.23 (0.36) 45.91 (0.42) 99.65 EC‐CO2‐1‐D 14.0 GPa/1375oC/7 h Cpx (15) (5) 23.20 (0.40) 21.30 (0.37) 1.09 (0.23) 54.47 (0.77) 100.06 Gt (9) (20) 16.99 (0.40) 19.56 (0.48) 16.91 (0.32) 46.31 (0.50) 99.77 Mag (11) (20) 4.10 (0.77) 42.80 (0.83) 0 0 53.10 100 6.40 St (6) (15) 0 0 2.15 (0.10) 98.47 (0.42) 100.62 Liq (29) (40) 45.11 (1.23) 16.13 (1.11) 0.31 (0.10) 1.03 (0.43) 37.42 100.00 66.64 EC‐CO2‐1‐E 16.0 GPa/1425oC/6 h Arag (7) (2) 56.11 (0.49) 0.65 (0.29) 0 0 43.24 100 98.40 Mag (11) (27) 6.70 (0.43) 40.20 (0.59) 0 0 53.10 100 10.63 Cpx (14) (12) 22.12 (0.55) 19.03 (0.62) 1.53 (0.39) 56.04 (0.72) 98.99 Gt (10) (26) 22.60 (0.48) 16.69 (0.60) 13.45 (0.51) 46.49 (0.70) 99.23 St (4) (10) 0 0 0.79 (0.20) 99.03 (0.61) 99.82 Liq (23) (23) 46.14 (0.93) 13.20 (0.83) 0.50 (0.23) 1.44 (0.77) 38.72 100.00 71.40 EC‐CO2‐2‐A 20 GPa/1590oC/4 h Mag (8) (20) 4.04 (0.21) 41.19 (0.44) 0 0 54.77 100 6.54 Gt (9) (20) 17.13 (0.51) 19.23 (0.59) 21.10 (0.46) 42.93 (0.66) 100.39 St (9) (10) 0 0 0.60 (0.18) 98.92 (0.70) 99.52 CAS (11) (14) 19.04 (0.49) 1.11 (0.32) 40.20 (0.41) 40.17 (0.62) 100.52 Capv (6) (12) 48.14 (0.71) 0.10 (0.07) 2.53 (0.49) 48.51 (0.89) 99.28 Liq (26) (24) 38.11 (1.05) 22.29 (0.97) 0.59 (0.27) 1.10 (0.81) 38.49 100.00 55.09 EC‐CO2‐4‐A 25 GPa/1850oC/1.5 h Mag (10) (24) 2.30 (0.16) 44.10 (0.59) 0 0 53.60 100 3.59 Gt (14) (15) 15.01 (0.43) 20.09 (0.73) 20.49 (0.57) 43.98 (0.59) 99.57 St (3) (11) 0 0 0.44 (0.27) 99.05 (0.87) 99.49 CAS (6) (2) 16.23 (0.38) 4.12 (0.40) 44.10 (0.56) 36.29 (0.69) 100.74 Capv (7) (19) 47.29 (0.85) 0.19 (0.10) 2.23 (0.81) 48.11 (0.95) 97.82 Liquid (20) (29) 35.41 (1.19) 22.70 (1.06) 0.30 (0.17) 1.21 (0.90) 40.38 100.00 52.70
aElectron microprobe analysis is by weight. b
CO2in aragonite, magnesite, and liquid calculated by difference. c
Ca# is Ca/Ca+Mg × 100 in molar units.
dAbbreviations are Arag, aragonite; CAS, calcium‐alumino silicate; Cpx, clinopyroxene; Gt, garnet; Liq, liquid; Mag, magnesite; St, stishovite. In each
Capv, majorite, stishovite, and fluid at 20 GPa but is absent at 18 GPa, indicating that with the addition of volatiles, the stability field of CAS undergoes a fairly decent expansion, with the result that this phase starts to become visible at pressures much lower than in dry MORB.
[31] The experimental data presented here have been used
to evaluate melting reactions that capture the contribution of each phase toward melt generation. Owing to the nature of the melting phase relations presented here, melting reactions can be written with great precision, and we use the approach outlined by Presnall [1986]. To employ this scheme of melting reactions, one needs to know only the composition of all the phases in a particular experimental charge. The calculated melting reactions at each pressure are as follows:
12GPa :
0:74 arag þ 0:18 mag þ 0:15 cpx þ 0:0001 gt ¼ 0:065 st þ 1:00 liq
14 GPa :
0:76 arag þ 0:16 mag þ 0:13 cpx þ 0:008 gt ¼ 0:07 st þ 1:00 liq
16 GPa :
0:74 arag þ 0:18 mag þ 0:12 cpx þ 0:005 gt ¼ 0:05 st þ 1:00 liq
20 GPa :
0:71 mag þ 0:40 CAS þ 0:99 capv ¼ 0:88 gt þ 0:23 st þ 1:00 liq
25 GPa:
0:73 mag þ 0:21 CAS þ 0:82 capv ¼ 0:53 gt þ 0:22 st þ 1:00 liq
[32] In the written reactions, the abbreviations correspond
to the following: arag, aragonite; mag, magnesite; cpx, clinopyroxene; gt, garnet; st, stishovite; CAS, calcium‐ alumino silicate; capv, calcium perovskite, and liq, liquid. It can be seen that the solidus melting reactions at all pressures are of peritectic‐type, with stishovite being produced upon melting. While from 12 to 16 GPa, it is the sole phase in reaction relation with the liquid, garnet joins stishovite at 20 and 25 GPa when melting initiates. The biggest contributor toward melting, however, at 12 to 16 GPa is aragonite. Since the concentrations of CaO and dissolved CO2in the
experi-mental liquids do not dramatically change at these pressures, the amount of aragonite contributing toward melt production remains fairly similar from 12 to 16 GPa. The melting reac-tions at 12 to 16 GPa attest to the overwhelming significance of crystalline carbonate to form the melt. Magnesite and cpx do not exert much control on the melting reactions. Owing to this small amount of garnet taking part in the reaction, it is wise to speculate that it could also be on the right side of the melting reactions at 12 to 16 GPa. The amount of stishovite being produced at the initiation of melting is also roughly the same from 12 to 16 GPa. Compared to the results at lower pressures, the amount of magnesite partaking in melting reactions at 20 and 25 GPa undergoes an almost fourfold increase. This rather dramatic rise in magnesite contributing toward melt generation is readily understood, since it is the phase that capacitates the liquids their carbonatitic nature at these two pressures. Owing to the amount of magnesite in liquid on the other side of the reactions, liquids are also higher in their MgO concentrations. Additionally, at both 20 and 25 GPa, Capv is the only silicate phase that gives the most toward melt production, a feature that is in some contrast to that at lower pressures, wherein crystalline carbonate is a Figure 11. The solidus of simplified carbonated eclogite as determined here, shown as a straight line
with filled, dark gray circles. Brackets are provided at 12 and 14 GPa. Numbers next to the gray circles represent temperature in degrees Celsius. The lower and higher pressure extensions of the solidus are shown as dashed lines. For comparison, also displayed are solid curves of natural, carbonated eclogite in two studies: thick, solid curve with a ledge around 3 GPa is from Shirasaka and Takahashi [2003] and dashed curve with a cusp around 5 GPa is from Hammouda [2003]. In both these cases, the ledge corresponds to a negative temperature‐pressure slope of the melting curve. The “Ca‐pv in” boundary line projected onto this diagram has been adapted from a previous study [Fei and Bertka, 1999] and is considered to be approximate.
larger part of the melting reactions. The CAS phase, that first appears at 20 GPa, is also a fairly decent donator toward melt at 20 GPa. However, by 25 GPa the amount of CAS that goes toward melting is reduced to roughly half of its value at 20 GPa. On the other hand, there is a manifold increase in the amount of stishovite being produced upon initiation of
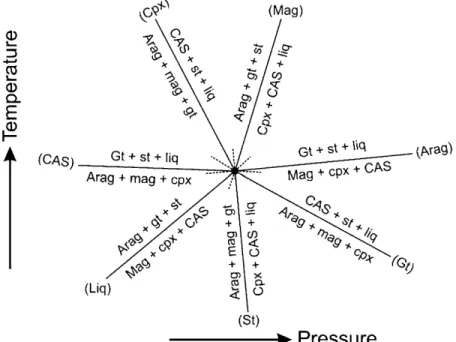
melting at 20 and 25 GPa than at lower pressures. In addition, garnet is in reaction relation with the liquid at 20 and 25 GPa. In this respect, although phase relations do not allow us to be sufficiently precise, it is fair to say that somewhere between 16 and 20 GPa, a singular situation should occur on the sol-Figure 12. Pressure‐temperature projection displaying melting of model carbonated eclogite at pressures
between 16 and 20 GPa. This figure shows what the solidus of might look like when CAS first becomes stable in model carbonated eclogite. This diagram therefore corresponds to a phase assemblage consisting of aragonite + magnesite + cpx + garnet + CAS + stishovite + liquid.
Figure 13. Pressure‐temperature projection showing melting of model carbonated eclogite at pressures between 16 and 20 GPa. This construct shows what the solidus of carbonated eclogite might look like when Capv first becomes stable in model carbonated eclogite. Compositional degeneracy exists at this invariant point on the solidus of model carbonated eclogite, consisting of magnesite + cpx + garnet + CAS + Capv + stishovite + liquid.
idus of carbonated eclogite. Singularity is expected since garnet changes sides in the melting reactions.
[33] One can take the data presented here a step further,
and evaluate what the solidus of model carbonated eclogite might look like between 16 and 20 GPa. Since there are two new phases that come in and two that are lost, there should be two invariant points that the univariant melting curve of model carbonated eclogite, intersects between 16 and 20 GPa. From the compositional data of the run products presented here, we show two topological constructs (Figures 12 and 13). Both of these diagrams capture the melting behavior of simplified carbonated eclogite between 16 and 20 GPa. The first construct (Figure 12) is for an invariant situation con-sisting of aragonite + magnesite + cpx + garnet + CAS + stishovite + liquid. As shown in Figure 12, aragonite‐absent (shown as (Arag)) and CAS‐absent (as (CAS)) lie on opposite sides to each other, meaning that with increasing pressure aragonite will no longer be stable at the solidus, while with decreasing pressure, CAS becomes unstable. The second topological construct (Figure 13) depicts the melting behav-ior of model carbonated eclogite after and before the disap-pearance of aragonite and cpx from the solidus, respectively. Therefore Figure 13 captures a situation wherein the phase assemblage consists of magnesite + cpx + garnet + CAS + Capv + stishovite + liquid. As shown, Cpx‐absent (Cpx) and Capv‐absent (Capv) curves lie on the opposite sides, meaning that with increasing pressure, cpx becomes unstable at the solidus, while with decreasing pressure, Capv disappears from the solidus of model carbonated eclogite. There exists compositional degeneracy marking the second invariant point (Figure 13).
[34] The melting reactions written here for model,
carbon-ated eclogite are vastly different from those reported in similar multicomponent rocks at lower pressures [Hammouda, 2003; Yaxley and Brey, 2004; Dasgupta and Hirschmann, 2004] or in the system diopside‐CO2[Luth, 2006]. Besides our work,
we are not aware of any other study that has investigated melting phase relations of carbonated eclogite at these depths. Therefore we are left with no choice but to compare the melting reactions with what is available to us. Further, we compare the melting reactions reported in our work to those written for simplified carbonated (CMAS‐CO2) [Dalton and Presnall,
1998] and CO2‐free peridotite in CMAS [Gudfinnsson and
Presnall, 1996], CMAS‐Na2O (CMASN) [Walter and
Presnall, 1994], natural peridotite [Walter, 1998], CMAS‐ FeO (CMASF) [Gudfinnsson and Presnall, 2000], CMAS‐ K2O [Liu and O’Neill, 2004], and CMAS‐H2O [Liu et al.,
2006] systems. As shown later, this comparison brings out vital differences in the way mantle melts. We start by describing melting reactions given for multicomponent, car-bonated eclogite from Hammouda [2003], Yaxley and Brey [2004], and Dasgupta and Hirschmann [2004], eventually getting up to the system diopside‐CO2[Luth, 2006].
[35] Melting reactions retrieved from the data set of
Hammouda [2003] (reviewed by Luth [2006]) are all peri-tectic in nature, with garnet, calcite, and coesite contributing toward liquid production, while vapor, cpx being in reaction relation with the melt at pressures of 5 to 6 GPa. At 6.5 GPa, only cpx and liquid are produced, while calcite, garnet, and coesite generate the melt; at 7 GPa, however, coesite joins cpx and liquid, but aragonite, dolomite, and garnet are the contributors toward melt production. Therefore, since coesite
switches sides in the melting reaction, there should exist a singular situation on the solidus of carbonated eclogite reported by Hammouda [2003], whereby when such singular situations develop, the phase that flips sides is on neither side of the reaction. At 10 GPa, aragonite, magnesite, garnet, and coesite produce melt, but cpx is produced upon melting. Hence somewhere between 7 and 10 GPa, there should again be at least one more singularity signifying the switching of coesite back to liquid production side of the reaction, and stabilization of magnesite on the reactant side. A feature to be noted is that cpx remains in reaction relation with the liquid throughout the reported pressure range in the study of Hammouda [2003], which is different from what is reported here. In our study, all the major, lime‐bearing silicate phases contribute toward the generation of liquid. Also, unlike in the work of Hammouda [2003] where coesite shows dramatic excursions in the melting reactions, stishovite in the reactions written here remains a product upon melting throughout the investigated pressure range.
[36] Compared with Hammouda [2003], the work of
Yaxley and Brey [2004] is at much lower pressures, 2.5 to 5.5 GPa, but nonetheless shows several interesting features. For one thing, vapor is missing from the experimental charges in the work of Yaxley and Brey [2004]. Crystalline carbonate and garnet react to produce liquid and cpx from 2.5 to 3.5 GPa. However, at 4.3 GPa, melting reaction is eutectic in nature. At 5.5 GPa, melting reaction again becomes peritectic, with coesite joining crystalline carbonate and garnet to produce melt and cpx. Therefore if the data of Yaxley and Brey [2004] are correctly interpreted, ideally there must be at least two singular situations: the first one between 3.5 and 4.3 GPa and the second somewhere between 4.3 and 5.5 GPa. Again, barring the reaction at 4.3 GPa, cpx is in reaction relation with the liquid as reported by Yaxley and Brey [2004] (reviewed by Luth [2006]). It remains to be seen if such singularities can be argued to come into existence on the solidus, as reported by Hammouda [2003] and Yaxley and Brey [2004]. The melting reactions that can be written for the carbonated eclogite in the work of Dasgupta and Hirschmann [2004] are quite different. For example, instead of cpx, garnet is in reaction relation with the liquid, while cpx and crystalline carbonate generate the melt (reviewed by Luth [2006]). The work of Luth [2006] locates CO2‐vapor as a
separate phase at the solidus. Hence combined with previous work [Luth, 1995], the position of decarbonation‐carbonation at the solidus of diopside‐CO2 is precisely located in
pressure‐temperature space. The melting reactions provided by Luth [2006] are all of peritectic nature, with cpx, vapor, and liquid being produced at the expense of dolomite and coesite at 5.5 GPa. Between 6 and 8 GPa, dolomite and coesite are the only contributors toward production of melt. In most previous studies, cpx is always a product at the initiation of melting, whereas crystalline carbonate is the phase that overwhelmingly controls melt generation. A rather interest-ing feature seen in the meltinterest-ing reactions provided by Luth [2006] is that from 6 to 8 GPa, the contribution of coesite toward melting shows signs of decrease, and therefore it is possible that with further increase in pressure, coesite might switch sides in the melting reactions.
[37] The melting reactions for either carbonated eclogite
or diopside‐CO2systems described here are quite different
in the system CMAS‐CO2 [Dalton and Presnall, 1998;
Ghosh et al., 2008]. Recently, Ghosh et al. [2008] determined that in the stability field of vapor‐bearing spinel and garnet peridotite (from 2.1 to 2.8 GPa), the melting reactions are such that opx is the only phase in reaction with the liquid, and forsterite, cpx, and spinel/garnet are the reactants. However, once crystalline carbonate becomes a stable phase at the solidus of carbonated peridotite, melting reactions change again (Dalton and Presnall [1998], reviewed in the work of Luth [2006]). For example, from 3 to 4 GPa, while dolomite, opx, and garnet contribute toward melt production, forsterite and cpx are in reaction relationship with the liquid. Clin-opyroxene and magnesite start to contribute toward liquid generation only at pressures greater than 4 GPa and forsterite, orthopyroxene, and garnet are produced upon melting after 4 GPa, a trend that continues to at least 6 GPa in model car-bonated peridotite. Since the reaction coefficients for garnet at 7 GPa are really small (meaning it could be on either side of the reaction), but if the data of Dalton and Presnall [1998] are taken at its face value, then garnet flips sides in the melting reaction and contributes toward melt production [Dalton and Presnall, 1998]. In this respect, the melting reactions for carbonated peridotite at 7 GPa are similar to the ones written here for carbonated eclogite, in the sense that carbonate, cpx, and garnet react together to produce liquid.
[38] The melting reactions of carbonated eclogite and
volatile‐free peridotite are quite different. For instance, along the solidus of spinel peridotite in the system CMAS, from 2.0 to 2.8 GPa, opx, cpx, and spinel contribute toward melting, while forsterite is produced upon melting [Gudfinnsson and Presnall, 1996]. In the system CMAS‐Na2O, at 2.0 GPa
(along an isobarically univariant curve in the spinel peridotite field), opx, cpx, and spinel react to produce forsterite and liquid [Walter and Presnall, 1994]. The reactions written in the system CMAS‐FeO are different from those in CMAS‐ Na2O. For instance, at 2.0 GPa cpx and spinel react to
pro-duce forsterite, opx, and liquid (again, along an isobarically univariant curve in the spinel peridotite field) [Gudfinnsson and Presnall, 2000]. At pressures of 3.0 GPa or higher, however, forsterite joins cpx and garnet to generate liquid, while opx starts to become visible on the product side in simplified garnet peridotite (CMAS) [Gudfinnsson and Presnall, 1996] and in natural systems [Walter, 1998]. In the system CMAS‐K2O [Liu and O’Neill, 2004], the melting
reactions change for simplified mantle peridotite existing along a univariant curve at 1.1 GPa. For example, at tem-peratures of 1255–1260°C, liquid and spinel are produced at the expense of opx, cpx, and forsterite. However, at tem-peratures above 1260°C, opx and cpx react to produce liquid, forsterite, and spinel [Liu and O’Neill, 2004], and therefore in this respect melting reactions resemble those seen in the system CMASN at 2.0 GPa [Walter and Presnall, 1994]. In the system CMAS‐H2O [Liu et al., 2006], melting reactions
for simplified mantle peridotite at 1.1 GPa are such that opx, cpx, and spinel react to produce forsterite and liquid, an assemblage that is univariant in nature.
[39] Hence from our work the following can be concluded.
Although crystalline carbonate seemingly dictates the melt-ing temperatures, it seems that at much elevated pressures, silicate component has a larger influence in controlling the liquid compositions. In the recent past, Luth [2006] pointed out the effect minor silicate components might have on the
binary Ca‐Mg carbonate melting phase relations at pressures greater than 3 GPa in either diopside‐CO2or for simplified
carbonated peridotite in CMAS‐CO2[Dalton and Presnall,
1998].
7.
A Note on the Survival of Carbonate to
Moderately Great Depths in the Earth
[40] Whether or not carbonated eclogite survives
sub-duction‐related melting, is an issue that we are not entirely in a position to address. The main difficulties in addressing the aforementioned survival are almost certainly due to a combination of the following:
[41] 1. The first difficulty is a complete absence of
melt-ing phase relations in the end‐member system CaCO3‐
MgCO3, which forms perhaps the most important subsystem
of carbonate‐silicate mixture, even at moderate pressures (>6–7 GPa).
[42] 2. The second difficulty is a rather incomplete
knowledge of melting phase relations (either in the model or multicomponent systems) of carbonated, hydrated sediments and basalts (aqueous fluid‐saturated/absent) in the sub-ducting“package” at moderate‐to‐great depths in the Earth, although in this sense some gaps are starting to get filled in [Molina and Poli, 2000; Thomsen and Schmidt, 2008, and references therein]. Here it is important to mention that the issue of subcritical versus supercritical features developing either in sediments, basalts, or a mixture of these two in hydrous, carbonated composition space is not known. Such features, when they come into play, influence melting phase relations and chemical transport/fractionation, irrespective of particular tectonic settings. However, the lack of knowledge in the relevant phase equilibria appears to be particularly grim in rock types consisting of hydrous, carbonated mantle peri-dotite and harzburgite (although see Falloon and Green [1990], Gudfinnsson et al. [2008], Keshav and Gudfinnsson [2009], and Mibe et al. [2009]), especially given the fact that there continue to be considerable disagreements as to where supercritical (second critical end‐points or singulari-ties) features develop in the system MgO‐SiO2‐H2O [Luth,
1993; Melekhova et al., 2007; Mibe et al., 2007]. Hence given these fundamental uncertainties in the influence of water (with or without CO2) on melting phase relations, the
suggestion that water gets expelled (or nearly so) from the rocks during subduction, while carbonate escapes melting‐ related events and thereby undergoes subduction to great depths in the Earth [Dasgupta and Hirschmann, 2004], requires some attention.
[43] 3. The third difficulty is the complexities reported in
the melting phase relations of subsystems in carbonate‐ silicate mixtures (for instance, diopside‐CO2[Luth, 2006])
relevant for carbonated rocks at subduction zone settings. Such complications become more magnified since the solidi temperatures of carbonated eclogite largely depend on the compositions of various subsystems in carbonate‐basalt system, with the silicate portion exerting a lot of control on the melting phase relations (Luth, presented paper, 2009). Significantly, the aforementioned compositional dependence implies that “cherry‐picking” a particular melting curve of carbonated eclogite and coming to certain judgments is not advisable.
[44] 4. The fourth difficulty is that although CO2 is
thought to play a substantial role in mantle melting, we still do not fully understand the relationship that possibly exists between CO2‐assisted melting and surface observables, the
exosphere (combined atmosphere, oceans, and sediments), volcanism at arc and mid‐ocean ridge settings, and meta-morphic reactions at subduction zone settings [see Kerrick and Connolly, 2001; Kerrick, 2001; Sleep and Zahnle, 2001; Sohn et al., 2008; Cartigny et al., 2008].
[45] The imperfect understanding mentioned above is
made further complicated by the carbon and nitrogen iso-topes measured in diamonds from the continental mantle. While the idea that some eclogitic diamonds might have formed from carbon introduced into the mantle via sub-duction has been in the published literature for at least 3 decades [Cartigny, 2005; Stachel et al., 2005; Tappert et al., 2005, and references therein], more recent measure-ments have invoked an elevated role of carbonic fluids (liquids) that are not derived from subduction related pro-cesses. Therefore in this particular set of arguments, there is not much need to introduce carbonated oceanic crust or its modified form in the source regions of diamonds since carbonic fluids/liquids are generated from ambient mantle peridotite [Cartigny, 2005, and references therein]. How-ever, very recently, Armstrong et al. [2007, 2008] and Walter et al. [2008] have hinted at the possibility of former carbonated oceanic crust being important in the genesis of silicate inclusions in diamonds from locations in Brazil.
[46] With respect to the eventual fate of carbonate in the
trench settings, two recent studies have come to polar
con-clusions. For instance, Hammouda [2003] who reported melting phase relations in silica‐saturated, multicomponent carbonated eclogite between 5 and 10 GPa, concluded that carbonated eclogite will undergo melting before reaching depths of more than ∼300 km in the Earth, an event that unlocks carbon. However, Hammouda [2003] also pre-sented a softer view with the notion that under certain cir-cumstances it is possible for carbonate in the subducting oceanic crust to escape melting‐induced removal, but experimental data at higher pressures were desired to confirm this prediction. On the other hand, Dasgupta and Hirschmann [2004], on their melting work in silica‐undersaturated, mul-ticomponent carbonated eclogite between 2 and 8 GPa (with densely collected data in the range∼2.5–5 GPa) firmly con-cluded that given suitable geotherms thought to be prevailing in subduction zones, it was nearly impossible for carbonated eclogite to undergo melting. Hence on the basis of their experimental data coupled with extrapolations to various tectonic settings, Dasgupta and Hirschmann [2004] pre-sented the notion that along subduction zones, carbonated eclogite has the ability to transport fairly large quantities of carbonate back into the mantle.
[47] Notwithstanding the caveats and suggestions outlined
above, now we are in a position to insert a short note on the survival of carbonate during the process of subduction. In order to do so, we project two geothermal profiles onto the melting curve of simplified carbonated oceanic crust from this study (Figure 14). The geotherms were calculated using parameters (for instance, including slab thickness, dip angle, slab velocity, specific heat, diffusivity, and thermal expan-Figure 14. Computed subduction zone geotherms projected onto temperature‐pressure diagram
display-ing the meltdisplay-ing curves of carbonated eclogite as determined here and in two previous studies (see above). The dashed and solid temperature‐depth profiles represent conditions whereby slab sinks very fast (very little time for thermal relaxation) or very slow (thermal relaxation is achieved or nearly so), respectively. For the sake of simplicity, we name these two profiles as“cold” and “hot.” Both the profiles have been calculated (H. Samuel and M. Tirone, personal communication, 2009) by employing parameters provided by Ganguly et al. [2009]. Given that some of the data presented here suitably captures the melting be-havior of carbonated eclogite, it appears that in principle it should be possible for deliver crystalline carbonate to fair depths in the Earth. However, as briefly mentioned in the text, the solidus curve of Hammouda [2003] is likely to intersect the projected“hot” and “cold” geotherms at depths approaching 370–400 km (13–14 GPa) and >500 km (>16 GPa) in the Earth.