HAL Id: hal-02974819
https://hal.archives-ouvertes.fr/hal-02974819
Submitted on 26 Oct 2020
HAL is a multi-disciplinary open access
archive for the deposit and dissemination of
sci-entific research documents, whether they are
pub-lished or not. The documents may come from
teaching and research institutions in France or
abroad, or from public or private research centers.
L’archive ouverte pluridisciplinaire HAL, est
destinée au dépôt et à la diffusion de documents
scientifiques de niveau recherche, publiés ou non,
émanant des établissements d’enseignement et de
recherche français ou étrangers, des laboratoires
publics ou privés.
Cold waves are getting milder in the northern
midlatitudes
Geert Jan van Oldenborgh, Eli Mitchell-Larson, Gabriel Vecchi, Hylke de
Vries, Robert Vautard, Friederike Otto
To cite this version:
Geert Jan van Oldenborgh, Eli Mitchell-Larson, Gabriel Vecchi, Hylke de Vries, Robert Vautard, et
al.. Cold waves are getting milder in the northern midlatitudes. Environmental Research Letters, IOP
Publishing, 2019, 14 (11), pp.114004. �10.1088/1748-9326/ab4867�. �hal-02974819�
Environmental Research Letters
LETTER • OPEN ACCESS
Cold waves are getting milder in the northern
midlatitudes
To cite this article: Geert Jan van Oldenborgh et al 2019 Environ. Res. Lett. 14 114004
View the article online for updates and enhancements.
Recent citations
Examining trends in multiple parameters of seasonallyrelative extreme temperature and dew point events across North America
Cameron C. Lee et al
-Where Do Cold Air Outbreaks Occur, and How Have They Changed Over Time? Erik T. Smith and Scott C. Sheridan
Environ. Res. Lett. 14(2019) 114004 https://doi.org/10.1088/1748-9326/ab4867
LETTER
Cold waves are getting milder in the northern midlatitudes
Geert Jan van Oldenborgh1 , Eli Mitchell-Larson2 , Gabriel A Vecchi3 , Hylke de Vries1 ,Robert Vautard4 and Friederike Otto2
1 Royal Netherlands Meteorological Institute(KNMI), R&D Weather and Climate Models, De Bilt, The Netherlands 2 School of Geography & the Environment and Department of Physics, University of Oxford, Oxford, United Kingdom 3 Geosciences Department and Princeton Environmental Institute, Princeton University, Princeton, NJ, United States of America 4 IPSL/LSCE, Gif-sur-Yvette, France
E-mail:[email protected]
Keywords: cold outbreaks, global warming, northern midlatitudes, Europe, North America, cold extremes Supplementary material for this article is availableonline
Abstract
The strong two-day cold wave in the midwestern United States in January 2019 again ignited the
discussion as to whether cold waves are getting more severe or not as a result of Arctic amplification
due to climate change. Assessing the evolution of cold waves in the northern hemisphere midlatitudes
in the observations has been difficult because the variability of cold waves is large compared to
anthropogenic warming. In order to detect changes in cold spells, two complementary ways to
optimise the signal-to-noise ratio are employed: multi-decadal series at individual stations, and for
shorter time periods by using spatially aggregated measures. Global warming is now strong enough to
make trends clear at individual stations when considering long enough
(>50 yr) records of daily
minimum and maximum temperature. Calculating the land area that has temperatures below the
1-in-10 year return value
(defined over 1951–1980) enables us to investigate trends over a shorter time
horizon. The long-term station data have strong decreases everywhere in the lowest minimum
temperature. Warming trends in the lowest maximum temperature are smaller over most of the
Northern Hemisphere, with dataset-dependent indications of possible negative trends in parts of the
United States and Mexico. Considering the area experiencing cold waves over the last decades, the
most notable feature is a sharp decline of this area since the 1980s. The natural variability is still so
large that it is possible to arbitrarily select starting dates after the decline for which the trend is slightly
positive in smaller regions like North America or Europe. However, these values are within
uncertainties compatible with a steady decline and have differing starting dates in North America and
Europe. An analysis of the entire northern midlatitudes confirms the steady decrease in severity and
frequency of cold waves over the last decades in the observations.
1. Introduction
A very strong two-day cold wave enveloped the midwestern United States on 30–31 January 2019
(NWS 2019), leading to over 20 reported deaths
(BBC2019). The anomalously cold temperatures were
the result of a perturbed jet stream which ordinarily bounds the tropospheric polar vortex, causing a southward incursion of cold Arctic air over the
continent(WMO 2019). Cold waves are a common
occurrence in North America, just the lastfive years saw further widely reported North American cold
waves in January 2014, November 2014, February 2015, and the winter of 2017/18. Over these years the long-used meteorological term‘polar vortex’ entered the public lexicon(Waugh et al2017). Heavy media
coverage of the recent January 2019 cold wave reignited the public and scientific debates over whether such events are increasing or decreasing in their severity and frequency in response to anthropo-genic climate change as a result of the fast warming of the high latitudes, referred to as Arctic amplification (Newson 1973, Francis and Vavrus 2012, Barnes
2013). OPEN ACCESS RECEIVED 16 April 2019 REVISED 23 September 2019 ACCEPTED FOR PUBLICATION 26 September 2019 PUBLISHED 22 October 2019
Original content from this work may be used under the terms of theCreative Commons Attribution 3.0 licence.
Any further distribution of this work must maintain attribution to the author(s) and the title of the work, journal citation and DOI.
Europe has also experienced a series of recent cold waves, albeit these have not been exceptional relative to recent historical norms Examples are the winter of 2009/10, January 2012, and January 2017. These European cold waves were primarily attributed to negative anomalies in the Arctic and North Atlantic Oscillations and were severe, but within expected variability(Cattiaux et al2010, Anagnostopoulou et al
2017, Christiansen et al 2018). February and March
2018 had very cold days for the time of year in the Alps and eastern Europe respectively (and brought some skating possibilities to the Netherlands). However, compared to the whole winter these cold waves were milder or not much colder than normal in Europe.
The recent perceived prevalence of cold waves, exacerbated by heightened media attention to each event, is at odds with a rather obvious first-order hypothesis: a warming climate should lead to warm extremes getting warmer, and cold extremes getting less cold. Thisfirst-order trend has indeed been vali-dated, both with regard to specific cold waves becom-ing less severe and frequent than they would have been without anthropogenic warming(Cattiaux et al2010, Screen et al2015, van Oldenborgh et al2015), and as a
regional, long-term trend toward milder and less fre-quent cold waves across the United States over many decades (Peterson et al 2013, EPA 2016, Vose et al
2017) and similarly over Europe (see e.g.
Charlton-Perez et al2019). Cold waves have not been increasing
in frequency and severity, rather they have been get-ting milder, as expected. For example, the cold winter of 2013/14 in the Upper Midwest region of the US was shown to have been 20–100 times less likely to occur in todays climate relative to the 1880s due to long-term warming(Wolter et al2015).
However, it has been proposed that Arctic ampli fi-cation and associated accelerated Arctic sea ice loss can lead to a slow-down and/or higher amplitude (more equatorward extent) of the jet stream, which in turn leads to increased extreme winter weather in the Northern midlatitudes (Francis and Vavrus 2012).
This, and variations invoking the influence of snow-cover on the position and strength of the jet stream (Henderson et al2018), has sometimes been referred
to as the ‘warm Arctic/cold continents’ hypothesis starting around 2000(Overland et al2011, Cohen et al
2013). Studies exploring this link in observations and
model simulations have yielded mixed results, with somefinding a link between Arctic amplification or sea ice loss from 1990 onwards and midlatitude winter weather(Cohen et al2014, Kretschmer et al2018), and
others finding no such link (Screen and Simmonds
2013, McCusker et al2016), or further concluding that
any cooling was the result of large interannual varia-bility, and only very weakly forced by sea ice loss and unlikely to continue in a warming climate(Sun et al
2016, Blackport et al2019). Others have disputed
whe-ther the jet stream wave extent or sinuosity has even increased beyond what can be explained by internal
atmospheric variability (Barnes 2013, Barnes and Screen2015, Cattiaux et al2016). Several recent
stu-dies in thisfield have made the even stronger claim that the observed frequency of extreme winter weather events is increasing(Kim et al2017, Cohen et al2018).
Here, we investigate claims that the trends in cir-culation are strong enough to overcome long-term warming and have reversed the tendency toward less frequent and less severe cold waves over the last dec-ades. We consider observations only, using measures with a good enough signal-to-noise ratio to be able to draw conclusions in the presence of large natural variability. We optimise the signal-to-noise ratio in two complementary analyses. The first takes local temperature data and long time series, the second spa-tially aggregated data with lower variability to study trends on shorter time scales.
2. Data and methods
In order to assess the local trends we use station data. Our primary measure of a cold wave at each station for each year is the annual minimum of the daily minimum temperature, denoted by TNn. To study winter extremes in the Northern Hemisphere we define the year as starting in July and ending in June, so the minimum is taken over the whole winter. In the Southern Hemisphere there is a small chance that the extreme falls around 1 July and is counted twice. We choose a one-day time scale, because one-day daily temperature minima are often-quoted when describ-ing the severity of a cold wave(e.g. Alexander et al
2006, van Oldenborgh et al 2015) and have been
recommended by the expert team on climate change detection and indices(Karl et al1999). We compare
this with the lowest maximum temperature of the year, TXn. Cold wave magnitude measures based on longer time scales, 3, 7 and 14 days, are shown in the supplementary material is available online atstacks.
iop.org/ERL/14/114004/mmedia.
As the trend in global mean surface temperature (GMST) has not been linear we use a nonlinear trend
measure: the regression on the GISTEMP (Hansen
et al2010) global mean temperature smoothed with a
four-year running mean. This measure posits that, to leading order, local temperature extremes scale with the global long-term mean, which in turn scales with the global mean radiative forcings(Tebaldi and Arblaster2014). This scaling has been used in extreme
event attribution studies(e.g. van Oldenborgh et al
2015, Uhe et al2016, Kew et al2019). We note that
we do not presently apply this method in order to per-form‘detection and attribution’, rather we use it to describe components of temperature change linearly connected to global temperature changes. Local and global temperature changes are also induced by in flu-ences other than greenhouse gas forcing to varying degrees, such as local aerosol forcings, urban heat 2
island and irrigation cooling effects, in addition to nat-ural variability; and we do not attempt to formally separate these influences. We do note that the effects of the local forcings can often be discerned on maps by their locations: in areas of strong air pollution, near cities or irrigated areas.
We use station data from the GHCN-D database (Menne et al 2012), available from www.ncdc.noaa.
gov/ghcnd-data-access. The version downloaded on 4
August 2019 contains minimum temperatures for 35 182 stations worldwide, of which 9116 have at least 50 years with data. Requiring a minimum inter-station distance of 2° reduces this to 1631 stations. We con-sider data from the twentieth century to be more reli-able than earlier data as in many countries standard Stevenson screens were introduced around 1900. Requiring at least 50 years in 1900–2018 with no more than 20% missing data each year leaves us with 1026 stations, which make up the dataset used forfigure1. The series in the GHCN-D dataset have in general not been homogenised, so there are stations that show
non-physical trends due to changes in observation practices or station relocations, or trends linked to changing local environments such as growing cities or increased irrigation. The largest non-physical trends stand out as isolated outliers against the more homo-geneous background of climate change signals. An example is Bridgeville, DE, USA, which shows as a blue dot on figure 1 with a trend of −4 K/K. However, inspection of the time series shows that this is due to a roughly three degree Celsius downward discontinuity around 1955. The Historical Observing Metadata Repository indeed shows that the station was moved on 10 October 1954.
The second analysis uses a spatially aggregated measure to reduce the variability and enable the char-acterisation of trends over shorter time periods. For this we consider the land area that has a coldest day of the year that is colder than the 10 year return value. Similar measures were used for cold waves by Karl et al (1996), EPA (2016), Christiansen et al (2018) and
Cou-mou and Robinson(2013) for heat waves. We use the
Figure 1.(a) Trend 1901–2018 in lowest daily minimum temperature of the year TNn (July–June) as a regression on the smoothed global mean temperature[K/K]. Data: 1026 GHCN-D stations with at least 50 years with 80% valid data, GISTEMP global mean surface temperature smoothed with a 4 yr running mean.(b) The same for the lowest maximum temperature of the year TXn at 1094 stations.
3
Berkeley Earth analysis of daily temperatures over land (Rohde et al 2013) starting in 1880. As mentioned
above, data from the 1800s are less reliable. We found an implausible cooling trend over northern Europe over 1900–1950 that appears based on very fragmen-tary station data. We therefore only show European data starting in 1950. Trends before 1950 were also in contradiction to station data in northern Siberia in earlier versions of the Berkeley Earth analysis.
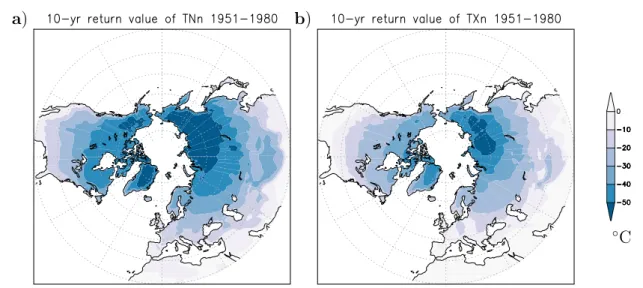
All calculations use 1951–1980 as the reference period to estimate the 10 year return values. These are estimated for each grid point byfitting the lowest daily minimum temperature of the year (July–June) to a generalised extreme value(GEV) function using a log-likelihood method(Coles2001). These temperatures
are shown infigure2. We define North America to
include the land area in 25–50 °N, 50–130 °W, Europe as 35–72 °N, 15 °W–40 °E and the whole midlatitudes as 30–60 °N. The latter region does not have complete coverage in Central Asia(figure2). The period up to
1950 is less reliable for Europe and the whole northern midlatitude regions.
We have compared the area measures in Europe against the E-OBS daily data (van der Schrier et al
2013) 1950–2019 and in the United States against the
gridMET dataset(Abatzoglou2013) 1979–2019.
3. Trends in cold waves
Figure1(a) shows the long-term trends in the lowest
minimum temperature of the year(TNn) in GHCN-D station with at least 50 years with 80% valid data. The trend values go tofive times the global mean temper-ature trend. Except for isolated stations the trend is strongly positive almost everywhere: over 50–100 year time scales, cold extremes are getting warmer in all areas of the globe where we have sufficient data,
including virtually all of the northern midlatitudes. There are no obvious associations with urban areas or other local factors. In these midlatitudes the trend is a factor three to more thanfive times the global mean trend, except near coasts. This is even faster than the winter mean temperature trend, which is only a factor two to three higher than the global mean temperature rise(van Oldenborgh et al2015). The spatial
homo-geneity of the trends over almost continental-sized regions motivates us to posit that global warming is the dominant forcing of the trend in cold waves on these long time scales. We conclude that almost every-where the local trend over 50 years or longer is towards milder cold waves as defined by the lowest minimum temperature of the year. This also holds for 7 d averaged minimum temperatures(suppl. mat. figure S1).
The trend in the lowest maximum temperatures of the year(figure1(b)) is in general smaller than the trend
in minimum temperatures, around three times the trend in global mean temperature for large parts of the globe. There are broad regions with slight negative trends, such as the central-eastern United States and large swaths of Mexico. A further investigation of this region shows that these negative trends do not appear in the Berkeley Earth analysis(see suppl. mat. figure S2).
As the signal-to-noise ratio is lower over shorter time periods than 50–100 year, it is not possible at this point to detect trends over the last few decades at a sin-gle location. To study these we turn to our spatially aggregated measure of cold waves. Figure3(a) shows
the fractional area affected by cold waves in North America as a function of time, where a cold wave is defined by a lowest minimum temperature of the year TNn below the 10 year return value in 1951–1980. By definition this fraction is 0.1 on average over 1951–1980. It can be seen to decrease strongly: what used to be a 1 in 10 year cold wave is now much rarer.
Figure 2.(a) The 10 yr return value of the lowest minimum temperature of the year (July–June) from a GEV fit over 1951–1980 in the Berkeley Earth daily minimum temperature analysis.(b) The same for the lowest maximum temperature of the year (TXn). Latitude circles are at 25°, 35°,K
4
During the last winter of 2018/19 only 3% of the North America area studied experienced a lowest minimum temperature below the 1 in 10 year return value, in spite of the strong cold wave of 30–31 January 2019.
However, the decrease is not monotonic: there continue to be harsher winters and milder winters. Due to what we hypothesize is natural variability, it is possible tofind intervals ending in winter 2018/19 over which the trend is nominally positive, albeit with a large uncertainty that encompasses the long-term trend. Figure3(b) shows the trend as a function of the
starting date for North America. One can obtain a slightly positive trend by choosing a start year in the range 1997–2000, just after the strong decline in cold waves after the 1980s. All other start years give a decrease in the area with cold waves. These nominally positive trends are compatible with the long-term
negative trend within uncertainties and hence compa-tible with natural variability. The starting years for a positive trend do coincide with the time that winter (December–February) Arctic amplification starts in the ERA5 reanalysis, around 2000 in the 60–90 °N averaged 2 m temperature.
Using the much shorter gridMET analysis 1979–2019, with a reference period 1979–2008, gives similar results: cold wave areas in the two datasets are correlated at r=0.96. However, due to the different reference period and smaller decorrelation scales the trends in the cold wave area are positive for a somewhat broader range of start years, 1997–2004 (not shown).
Measured by the lowest maximum temperature of the year, the largest cold waves in North America occurred in the 1980s. The area covered by 1 in 10 year cold in North America decreased very steeply after that
Figure 3.(a) Fraction of land area in North America (land points in 25–50 °N, 50–130 °W) 1900–2019 with lowest minimum temperature of winter below the 10 year return value defined over 1951–1980, the red line indicates a 10 yr running mean. (b) Trends (regression of the logarithm of the fraction on smoothed GMST) as a function of starting date, the end date is always the winter of 2018/19. The 95% confidence intervals are indicated by blue lines. (c), (d) The same for the lowest maximum temperature of the year, TXn.(e)–(h) The same for Europe (land points in 35–72 °N, 15 °W–40 °E) 1950–2019.
5
until 2000 and stayed constant at this very low level after that(figures3(c), (d)).
In Europe the variability is even larger, due to the smaller area and influence of large modes of winter weather variability such as the North Atlantic Oscilla-tion(figure3(e)). In a very harsh winter such as occurred
in 1956, more than 70% of Europe experienced a cold wave in TNn with a probability that was 1 in 10 yr(10% per year) or rarer over 1951–1980. Trends from 1950 onwards show a clear decline(figure3(f)), but again it is
possible to choose starting years for a short-term trend that give a small positive number, for Europe that is 1988–1994 except 1991. However, as was the case for North America, this trend and all others are compatible with the long-term trend from 1950 onwards. In Europe the years from which a(non-significant) positive trend is found is ten years earlier than in North America and our measure of the onset of Arctic amplification.
Comparing these results to those obtained from the E-OBS analysis 1950–2019 shows a high correla-tion in cold wave areas(r=0.95). However, using this data set as basis for the analysis the trend is always negative: there are no start years that give a positive cold wave area trend(not shown).
As in North America, the largest area with cold waves defined by the lowest maximum temperature of the year occurred in the 1980s. This ceased by 1990 and stayed roughly constant at a much lower level since then(figures3(g), (h)).
To improve the signal-to-noise ratio further we also analyse the northern hemisphere midlatitudes as a whole. Figure4confirms that previously noted
short-term positive trends in the area covered by cold waves were just localfluctuations, as this aggregate measure of cold waves shows negative trends for all starting years in TNn. Using TXn this holds for all starting dates except 1995, 1997 and 1998, as there have been large declines in cold wave area from around 1980 to
2000 and again a decline from 2010 to 2018/19. This resulted in negative trends in the cold wave area start-ing before and after the late 1990s. All these fluctua-tions are compatible with natural variability.
Longer cold waves, defined by the lowest 3, 7 and 14 d averaged minimum and maximum temperatures give the same results(Suppl. Mat. figures S3 and S4).
4. Conclusions
We have investigated whether there is observational evidence to support the notion that cold waves in the northern midlatitudes are becoming more severe or more frequent. Variability of wintertime temperature extremes in this region is large, often hiding a trend signal. So in order to obtain reasonable signal-to-noise ratios needed to assess trends potentially linked to climate change, we need to consider either long (multi-decadal) time series at a series of locations, or a spatial aggregate across continents or the whole hemi-sphere for shorter time scales. We chose a standard indicator of wintertime temperature extremes: TNn, the lowest minimum temperature of the year, where we define the year (non-standard) from July to June in order to keep the whole winter in one year. In addition we consider TXn, the lowest maximum temperature of the year. One-day, three-day, seven-day and 14 d cold waves all give similar results.
Station observations with at least 50 years of data show a strong warming in cold waves everywhere in the northern midlatitudes, of three tofive times the rate of global mean temperature rise over 1900–2018. As an aggregate index we chose the fraction of land area in North America(25–50 °N), Europe (15 °W–40 °E) and all northern midlatitudes(30–60 °N) with TNn below the 10 yr return value estimated over 1951–1980. All regions show a strong decrease in the area affected by
Figure 4. Asfigure3but for the whole northern midlatitudes. The data before 1950 is less reliable.
6
cold waves since 1950. In the subset regions of North America and Europe, it is possible to obtain a small posi-tive trend by choosing the starting date of the trend judi-ciously, but the values are within the uncertainties around the long-term trends. For the midlatitudes as a whole, there are no positive trends whatsoever in the lowest minimum temperatures and only a lack of trend at a very low level in the maximum temperature. We conclude that, as expected from the observed planetary warming driven in large part by increasing greenhouse gases, cold waves in the northern midlatitudes are getting less severe, andfind no robust evidence to the contrary.
Acknowledgments
This work was supported by the EUPHEME project, which is part of ERA4CS, an ERA-NET initiated by JPI Climate and co-funded by the European Union(Grant #690462).
Data availability
The data that support thefindings of this study are openly available at the data providers, NCEI and Berkeley Earth. The latest version of the data of figures1and S1 is also available atclimexp.knmi.nl
under‘Daily station data’. The figures can be repro-duced by following the link ‘Correlate with a time series’. The data of figures2–4and S2–S4 can be
re-computed after selecting the relevant Berkeley Earth daily temperaturefield by following the links ‘Com-pute mean, s.d. or extremes’ (figure2), ‘Correlate with
a time series’ (figure S2) and filling out the form ‘Area with extremes’ (figures3,4, S3, S4).
ORCID iDs
Geert Jan van Oldenborgh https: //orcid.org/0000-0002-6898-9535
Eli Mitchell-Larson
https://orcid.org/0000-0002-3775-3482
Gabriel A Vecchi
https://orcid.org/0000-0002-5085-224X
Hylke de Vries https: //orcid.org/0000-0002-6124-1102
Robert Vautard
https://orcid.org/0000-0001-5544-9903
Friederike Otto https: //orcid.org/0000-0001-8166-5917
References
Abatzoglou J T 2013 Development of gridded surface
meteorological data for ecological applications and modelling Int. J. Climatol.33 121–31
Alexander L V et al 2006 Global observed changes in daily climate extremes of temperature and precipitation J. Geophys. Res. Atmos.111 109
Anagnostopoulou C, Tolika K, Lazoglou G and Maheras P 2017 The exceptionally cold January of 2017 over the Balkan Peninsula Atmosphere8 252
Barnes E A 2013 Revisiting the evidence linking Arctic amplification to extreme weather in midlatitudes: Arctic amplification and weather Geophys. Res. Lett.40 4734–9
Barnes E A and Screen J A 2015 The impact of Arctic warming on the midlatitude jet-stream: Can it? Has it? Will it? Wiley Interdiscip. Rev. Clim. Change6 277–86
BBC 2019 Polar vortex death toll rises to 21 as US cold snap continues (www.bbc.co.uk/news/world-us-canada-47088684) Blackport R, Screen J A, van der Wiel K and Bintanja R 2019
Minimal influence of reduced Arctic sea ice on coincident cold winters in mid-latitudes Nat. Clim. Change9 697–704 Cattiaux J, Vautard R, Cassou C, Yiou P, Masson-Delmotte V and Codron F 2010 Winter 2010 in Europe: a cold extreme in a warming climate Geophys. Res. Lett.37 704
Cattiaux J, Peings Y, Saint-Martin D, Trou-Kechout N and Vavrus S J 2016 Sinuosity of midlatitude atmosphericflow in a warming world Geophys. Res. Lett.43 8259–68
Charlton-Perez A J, Aldridge R W, Grams C M and Lee R 2019 Winter pressures on the UK health system dominated by the Greenland Blocking weather regime Weather Clim. Extremes 25 100218
Christiansen B et al 2018 Was the cold european winter of 2009/10 modified by anthropogenic climate change? an attribution study J. Climate31 3387–410
Cohen J, Jones J, Furtado J and Tziperman E 2013 Warm Arctic, cold continents: a common pattern related to arctic sea ice melt, snow advance, and extreme winter weather Oceanography26 150–60
Cohen J et al 2014 Recent Arctic amplification and extreme mid-latitude weather Nat. Geosci.7 627–37
Cohen J, Pfeiffer K and Francis J A 2018 Warm Arctic episodes linked with increased frequency of extreme winter weather in the United States Nat. Commun.9 869
Coles S 2001 An Introduction to Statistical Modeling of Extreme Values(London: Springer Series in Statistics)
Coumou D and Robinson A 2013 Historic and future increase in the global land area affected by monthly heat extremes Environ. Res. Lett.8 034018
EPA 2016 Climate Change Indicators: high and Low Temperatures, https: //epa.gov/climate-indicators/climate-change-indicators-high-and-low-temperatures
Francis J A and Vavrus S J 2012 Evidence linking Arctic
amplification to extreme weather in mid-latitudes Geophys. Res. Lett.39 801
Hansen J, Ruedy R, Sato M and Lo K 2010 Global surface temperature change Rev. Geophys.48 RG4004
Henderson G R, Peings Y, Furtado J C and Kushner P J 2018 Snow-atmosphere coupling in the Northern Hemisphere Nat. Clim. Change8 954–63
Karl T R, Knight R W, Easterling D R and Quayle R G 1996 Indices of climate change for the united states Bull. Am. Meteorol. Soc. 77 279–92
Karl T R, Nicholls N and Ghazi A 1999 CLIVAR/GCOS/WMO Workshop on Indices and Indicators for Climate Extremes Workshop Summary(Dordrecht, Netherlands: Springer) pp 3–7
Kew S F, Philip S Y, van Oldenborgh G J, Otto F E, Vautard R and van der Schrier G 2019 The exceptional summer heatwave in Southern Europe 2017 Bull. Am. Meteorol. Soc.100 S2–5 Kim J-S, Kug J-S, Jeong S-J, Huntzinger D N, Michalak A M,
Schwalm C R, Wei Y and Schaefer K 2017 Reduced North American terrestrial primary productivity linked to anomalous Arctic warming Nat. Geosci.10 572 Kretschmer M, Coumou D, Agel L, Barlow M, Tziperman E and
Cohen J 2018 More-persistent weak stratospheric polar vortex states linked to cold extremes Bull. Am. Meteorol. Soc. 99 49–60
McCusker K E, Fyfe J C and Sigmond M 2016 Twenty-five winters of unexpected Eurasian cooling unlikely due to Arctic sea-ice loss Nat. Geosci.9 838–42
7
Menne M J, Durre I, Vose R S, Gleason B E and Houston T G 2012 An overview of the global historical climatology network-daily database J. Atmos. Ocean. Technol.29 897–910
Newson R L 1973 Response of a general circulation model of the atmosphere to removal of the Arctic Ice-cap Nature241 39–40
NWS 2019 Late January 2019 Extreme Cold Summary,(https:// weather.gov/fgf/2019_01_29-31_ExtremeCold) Overland J, Wood K and Wang M 2011 Warm Arctic—cold
continents: climate impacts of the newly open Arctic Sea Polar Res.30 15787
Peterson T C et al 2013 Monitoring and understanding changes in heat waves, cold waves,floods, and droughts in the united states: state of knowledge Bull. Am. Meteorol. Soc.94 821–34
Rohde R, Muller R A, Jacobsen R, Muller E, Perlmutter S, Rosenfeld A, Wurfele J, Groom D and Wickham C 2013 A New estimate of the average Earth surface land temperature spanning 1753–2011 Geoinfor. Geostat.: An Overview1 1 Screen J A and Simmonds I 2013 Exploring links between Arctic
amplification and mid-latitude weather Geophys. Res. Lett.40 959–64
Screen J A, Deser C and Sun L 2015 Reduced risk of north american cold extremes due to continued Arctic sea ice loss Bull. Am. Meteorol. Soc.96 1489–503
Sun L, Perlwitz J and Hoerling M 2016 What caused the recent ‘warm Arctic, cold continents’ trend pattern in winter temperatures?: warm Arctic not causing cold continents Geophys. Res. Lett.43 5345–52
Tebaldi C and Arblaster J M 2014 Pattern scaling: its strengths and limitations, and an update on the latest model simulations Clim. Change122 459–71
Uhe P, Otto F E L, Haustein K, van Oldenborgh G J, King A, Wallom D, Allen M R and Cullen H 2016 Comparison of methods: attributing the 2014 record european temperatures to human influences Geophys. Res. Lett.43 8685–93 van der Schrier G, van den Besselaar E J M, Klein Tank A M G and
Verver G 2013 Monitoring European average temperature based on the E-OBS gridded data set J. Geophys. Res. A118 5120–35
van Oldenborgh G J, Haarsma R, De Vries H and Allen M R 2015 Cold extremes in north america versus mild weather in europe: the winter of 2013–14 in the context of a warming world Bull. Am. Meteorol. Soc.96 707–14
Vose R S, Easterling D R, Kunkel K E and Wehner M F 2017 Climate Science Special Report: A Sustained Assessment Activity of the US Global Change Research Program(Temperature Changes in the United States) (Washington, DC, USA: US Global Change Research Program) pp 267–300
Waugh D W, Sobel A H and Polvani L M 2017 What is the polar vortex and how does it influence weather? Bull. Am. Meteorol. Soc.98 37–44
WMO 2019 2019 starts with extreme, high-impact weather (https: //public.wmo.int/en/media/news/2019-starts-extreme-high-impact-weather)
Wolter K, Hoerling M P, Eischeid J K, van Oldenborgh G J, Quan X-W, Walsh J E, Chase T N and Dole R M 2015 How unusual was the cold winter of 2013/14 in the Upper Midwest? Bull. Am. Meteorol. Soc.96 S10–4
8
![Figure 1. ( a ) Trend 1901 – 2018 in lowest daily minimum temperature of the year TNn ( July – June ) as a regression on the smoothed global mean temperature [ K / K ]](https://thumb-eu.123doks.com/thumbv2/123doknet/13361795.403156/5.892.181.823.89.670/figure-trend-lowest-minimum-temperature-regression-smoothed-temperature.webp)