HAL Id: hal-00800688
https://hal.archives-ouvertes.fr/hal-00800688
Submitted on 14 Mar 2013HAL is a multi-disciplinary open access archive for the deposit and dissemination of sci-entific research documents, whether they are pub-lished or not. The documents may come from teaching and research institutions in France or abroad, or from public or private research centers.
L’archive ouverte pluridisciplinaire HAL, est destinée au dépôt et à la diffusion de documents scientifiques de niveau recherche, publiés ou non, émanant des établissements d’enseignement et de recherche français ou étrangers, des laboratoires publics ou privés.
The Effects of Politics on Local Tax Setting: Evidence
from France
Eric Dubois, Matthieu Leprince, Sonia Paty
To cite this version:
Eric Dubois, Matthieu Leprince, Sonia Paty. The Effects of Politics on Local Tax Setting: Evidence from France. Urban Studies, SAGE Publications, 2007, 44 (8), pp.1603. �hal-00800688�
THE EFFECTS OF POLITICS ON LOCAL TAX SETTING:
EVIDENCE FROM FRANCE
Forthcoming in Urban Studies, volume 44:8, July 2007
Eric Dubois
LAEP - University of Paris 1, Maison des Sciences Économiques,
106-112 bd de l'Hôpital, F-75647 Paris cedex 13, FRANCE
Matthieu Leprince
CREM (UMR CNRS 6211) - University of Rennes 1,
7 place Hoche, F-35065 Rennes cedex, FRANCE
Sonia Paty
♦MEDEE and INRA-CESAER - University of Lille 1,
F-59655 Villeneuve d’Ascq, FRANCE
Abstract:
This article investigates the effect of the intensity of political competition on the tax choices
by local governments. More precisely, we study whether local governments determine their
tax rates more in a Leviathan way, exploiting a low political competition to vote high tax
rates, or in a partisan way, fiscal choices by leftwing governments being significantly in
contrast with those by rightwing ones. We focus on the tax behaviour of the French
departments and estimate for the local business tax a spatial model in 1999. Our results
suggest that elected representatives adopt a partisan behaviour rather than a Leviathan
behaviour in their fiscal choices.
Key-words: local government, spatial econometrics, political competition, partisan behaviour
JEL Classification: H71, H73
♦
Corresponding author, Faculté des Sciences Economiques et sociales, Université des
Sciences et Technologies de Lille, F-59655 Villeneuve d’Ascq, France,
sonia.paty@univ-lille1.fr
I. INTRODUCTION
Since at least three decades, political determinants of fiscal policy have been well identified in the economic literature. For example, the political system (presidential / parliamentary) and the voting rule (majority / proportional) may affect the size of the government (Persson and Tabellini, 1999; Milesi-Ferretti et al., 2002). In the same way, the centralization degree of the political system matters: the more centralized the system is, the better the control over the spending will be (Persson and Tabellini, 1999). The budgetary process also plays an important role. For example, the way the budget is voted (agenda…) or the transparency of the rules can influence the budgetary variables (von Hagen, 1992; de Haan and Sturm, 1994). According to another theory, divided governments or governments formed by a coalition of parties increase public spending because several conflicting political objectives have to be conciliated (Alt and Lowry, 1994, 2000; Poterba, 1994). Antagonist objectives among interest groups can also delay reform that could reduce deficits (Alesina and Drazen, 1991; Spolaore, 2004). Political instability (frequent changes of governments) is also a source of large deficits (Roubini and Sachs, 1989ab) so that democracy may enhance public spending (Persson and Tabellini, 2003). Finally, the size of the governing institutions may also matter (Pettersson-Lidbom, 2005). However, the explanation that has given rise to the largest literature is the politico-economic cycle one which can be divided into two approaches. According to the first one, introduced by Downs (1957) and formally developed by Nordhaus (1975), Rogoff and Sibert (1988) and Rogoff (1990), governments are opportunistic in the sense that they only care about their re-election. They manipulate monetary and fiscal instruments to satisfy voters before the election what creates a cycle (called "political business cycle") in main macroeconomic variables. This type of behaviour rests on the hypothesis that all voters have the same expectations about the economy (for example, in the case of an inflation-unemployment trade-off, they all want less unemployment and more inflation) and that parties' policies converge to satisfy the median voter. By contrast, in a second strand of the literature, since voters are heterogeneous, parties do not converge. Each party has its own objective function that reflects the preferences of its voters. The cycle in macroeconomic variables which depends on the governing party is called "partisan cycle". Classic references are Hibbs (1977) and Alesina (1987,
1988). Among recent works on politico-economic cycles in fiscal variables, one can cite Alesina et al. (1997) that survey and test both opportunistic and partisan theories.
A closely related strand of the literature has an approach in terms of political competition rather than in terms of cycles. On the one hand, the Leviathan government hypothesis first developed by Brennan and Buchanan (1980) suggests that, irrespective of the government’s ideology, a lower intensity of political competition leads to an increase in the size of the public sector. Indeed, political competition forces the government to control the increase in tax rates and then to reduce (in a relative sense) the public sector’s size whatever her ideology (see Caplan, 2001). On the other hand, according to the partisan-type hypothesis, intense competition will not have a clear effect on the size of the public sector. The incumbent will find easier to implement her platform when the competition is weak. Then, leftwing governments that prefer higher public sector, increase spending and taxes when competition decreases whereas rightwing governments do the opposite (Boyne, 1994). Solé Ollé (2006) provides empirical evidence in favour of the partisan hypothesis over the Leviathan one by using a panel data set of the Spanish municipalities in the 1990s. He finds that for leftwing governments, spending, taxes and deficits increase as the electoral margin increases, while for rightwing governments, a weaker competition leads to reductions in all these variables.
From the political economy point of view, the literature mainly focuses on behaviour of the amount of taxes collected (see Besley and Case, 1995b, Kneebone and McKenzie, 2001, among others, for recent examples). Papers that examine the determination tax rates are scarce (but see Pettersson-Lidbom, 2000) and political factors that affect tax rates remain largely unknown.
Our contribution is twofold. Firstly, we want to provide evidence on the effects of political variables on the local tax setting in France where no previous evidence exists. Secondly, we study the effects of political competition on tax choices in the same framework. Since the end of the 90's, our understanding of tax setting in France has well increased (Feld et al., 2002; Leprince et al., 2005; Madiès et al., 2005) but all these studies exclusively focus on the role of socio-demographic and
economic determinants in explaining tax rates while political factors are neglected. Consequently, the absence of such relevant explanatory variables might lead to misspecified regressions and biased estimations.
The evidence in other European countries, Solé Ollé (2003) in Spain, Bordignon et al. (2003) in Italy, is very scarce. However they estimate the same tax setting equation in which the dependent variable is the local tax rate while the explanatory variables are socio-demographic, economic and political factors. They also take into account one major aspect of the determination of tax rates, that is the possible influence of tax choices set by nearby jurisdictions which can bias regression results if it is not included as explanatory variables. The existence of horizontal tax interactions is a common prediction of both tax competition and yardstick competition literatures (Brueckner, 2003). Indeed, policy-makers may mimic the tax policies of their neighbours by fear of tax base mobility (tax competition hypothesis) or not being reelected (yardstick competition hypothesis). Consequently, the empirical study of political determinants of local tax setting must be conducted by controlling the possible existence of horizontal tax interactions. On a methodological point of view, we will use the appropriate specification and estimation procedure based on spatial econometrics developed by Anselin (1988). As is well known from this literature, ignoring such spatial dependence would lead to biased estimators.
We obtain two main results. We first show that governments with high seats margin tend to set lower tax rates. Therefore, we reject the Leviathan behaviour hypothesis and we also give empirical evidence in favour of the partisan model hypothesis. Leftwing governments tend to set higher tax rates than rightwing governments and also tend to cut their tax rates less when their margin increases. However, we also show that none of the political variables including the characteristics of the local incumbent is significant. Features such as seniority, proximity with other local or national assemblies, and/or a plurality of local and national mandates have no impact on local tax decisions.
The paper is organised as follows. Section II gives a brief description of the French system of local politics. Section III presents the empirical model. Section IV describes the data set and the results and section V concludes.
II. LOCAL POLITICS IN THE FRENCH DEPARTMENTS
2.1. General features of county elections
From the local viewpoint, metropolitan France is divided into 22 regions, 96 departments and 36 600 municipalities. Since the "decentralization laws" in the early eighties, greater power has been granted by the central government to regions, departments and municipalities. Each has its own budget that is mainly financed by grants from the central government (about 25 %) and by local tax resources (about 50 %)1. In this paper, we will concentrate on the business tax rate voted by the departments, the
intermediate level of local governments in France.
A department is composed of several counties ("cantons" in French) and of several constituencies ("circonscription" in French). There are in metropolitan France 3,809 counties2 and 555 constituencies.
In constituencies, voters elect their representatives at the National Assembly and in counties, voters elect their representatives at the General Council3. The General Council has the executive power at the
departmental level. Finally, each constituency and each canton are made up of several municipalities.
Voters elect one general councillor ("conseiller général" in French) by county, at the majority vote with two rounds, for a six years term. In each department, half the General Council is going into election every three years. After every election, the General Council elects a president. In the case where there is no majority, the councillor with the longest seniority on the Council presides over the assembly.
To be elected in the first round, a candidate must get at least half of the vote plus one and a number of votes equal to at least 25% of the registered voters. To be a candidate in the second round,
it is necessary to have obtained in the first round a number of votes at least equal to 10% of the registered voters. However, if only one candidate clears this threshold, the candidate ranked second can remain candidate. The candidate who gets the biggest number of votes in the second round is elected4. The dates of the last cantonal elections are the following: March 22 and 29, 1992, March 20
and 27, 1994, March 15 and 22, 1998, March 11 and 18, 2001, March 21 and 28, 2004.
To analyse the possible impact of the local political market features on the departments' fiscal choices in 1999, we have then retained the characteristics of the political equilibrium observed within the General Council after the cantonal elections of March 15 and 22, 1998, and partially stemming from the elections of March 20 and 27, 1994, since the majority after the 1998 ballot is composed for one half, of general councillors elected in 1994, and for the other half of general councillors elected in 1998.
2.2. Political competition in departments and the related literature
Two sets of political variables are available at the department level for the year 1999. The group I is made of variables describing the features of the president of the General Council: her possible plurality of electoral mandates, her partisan proximity with the other levels of local or national administration, her seniority in office. We use these variables to test the hypothesis that the president of the General Council uses theses characteristics to reduce the degree of local political competition.
The plurality of assignments is one of the specificities of the French political system even though others European countries as Germany, Spain or Italy share this institutional characteristic (Debrenne and Revel, 1998). According to Quid 2000, there were, in whole France5, in 1999, 504,129
electoral seats distributed this way: 4,214 general councillors, 1,829 regional councillors, 497,188 municipal councillors, 321 senators and 577 members of the national assembly (MNAs) (the European MPs are excluded of this numbering). In other words, there is, in France, close to one elected representative for 100 inhabitants against one for 397 in Italy and one for 2605 in United Kingdom (Caille, 2000, pp. 1736-1737). In 1997, on the 577 MNAs sitting at the National Assembly, only 48 did not have another assignment. In the same way, 262 of the 321 senators had a second mandate (Hoeffel, 1998, p. 15).
A first explanation of this plurality of assignments resides in the multiplication of the positions caused by the decentralization of responsibilities to three levels of local government, few countries offering as much opportunity of assignments to their citizen as France. A complementary explanation would be the weakness of political parties not finding enough militants to provide each elective function individually (Knapp, 1991).
The phenomenon of plurality of assignments essentially generated a literature in the field of Law carrying on the discussion of legal arrangements6 or on international comparisons (see, among others,
Knapp, 1991; CREAM, 1998; Caille, 2000). The main exceptions are Olivier (1998) that examines the perception of the plurality of assignments by voters through an opinion poll and Foucault (1999) studies the impact of the plurality of mandates on the vote. To our knowledge, its impact on the economy and on the budgetary behaviours of the local governments has not been studied in France yet.
In this article, the plurality of mandates of the president of the General Council is taken by three dummies. The first, noted MNA, is equal to 1 if the president of the general Council is also MNA, and 0 otherwise. The second, noted SENATOR, is equal to 1 if the president of the General Council is also senator, and 0 otherwise. Finally, the third, noted MAYOR, is equal to 1 if the president of the General Council is also mayor, and 0 otherwise.
Besides the variables characterizing the plurality of mandates, the group I contains two other variables describing the president of the General Council. The first is a dummy variable denoted POLITICAL PROXIMITY, equal to 1 if the General Council is headed by an elected representative close to the majority of the regional Council or the National Assembly, and 0 otherwise. It allows us to test the possibility of collusion between the General Council and another assembly, the source of collusion being partisan proximity. For example, the president would negotiate fiscal advantages for economic activities in her department or negotiate new localizations of (public or private) jobs in her
department. One can also conceive that the president uses information from her national assignment
(for example fiscal reforms considered by the government), what would differentiate her from a president without national assignment.
The last variable of the group I characterizing the president of the General Council is the number of presidency years (denoted SENIORITY) in order to test a possible tendency by a long time elected president to increase tax rates because of a lower political competition in the department. Note that in France, the president of the General Council is not constrained by a limit for the number of his/her successive mandates. Therefore, one cannot verify the effect of this limit on the propensity to imitate the neighbouring fiscal policies as for example Bordignon, Cerniglia and Revelli (2003) do it in the Italian case7.
The group II consists of variables that characterize the majority of the General Council. First of all, in accordance with comparable works available for Spain (Solé Ollé, 2006) and Italy (Bordignon et al., 2003) we construct a variable measuring the intensity of the political competition that might constraint the fiscal choices of the local elected representative. In the literature, this indicator is measured by the electoral margin, measured as the percentage of vote received by the incumbent majority in the last local elections minus 50%. In the Leviathan local government hypothesis, the expected effect is: the weaker the margin, the stronger the political competition is, and thus the lower the tax rates chosen by the local elected representative are, other things being equal. Therefore, a positive and significant effect of the margin on tax rates is interpreted as empirical evidence in favour of a Leviathan fiscal choice model.
In the French case, the use of electoral margins expressed in seats rather than in vote is recommended for several reasons. First it is the consequence of the electoral rules concerning the cantonal elections with a General Council renewed by half every three years. So the composition of the General Council after county elections in year t reflects both the election results in year t and in year t-3. The general councillors elected in t-3 have not been renewed in t and are still in office. At date t, a president may keep her seat majority in spite of a electoral defeat in t if the seats margin resulting from the elections in t-3 is sufficient.
The second specificity that complicates the computation of vote margins in France is the importance of the extreme right. The left or the moderate right obtain a majority of seats with less of 50% of the votes. Indeed, considering the scores of the extreme right, the left and moderate right total is about 90% of the total ballot in the first round of the county elections8.
Finally, a third difficulty that prevents us from providing a simple definition of a vote margin concerns the correct choice of the relevant electoral round to calculate the margin. Do we have to consider that the first round better reflects the voters' preferences when those vote "with their heart" or do we have to consider that the second round really "makes the election" considering that in the vast majority of cantons a second round is usually necessary to determine a winner? There is no clear response in the literature to this question yet.
In order to construct a margin without avoiding any difficulty, we do not use the results in terms of total vote but instead we use the results in terms of number of seats. Then, the three problems mentioned above disappear. Indeed, the choice of the relevant elections and of the relevant round does not exist anymore. Regarding the disruptive effect of the extreme right, it is attenuated by the fact that the extreme right obtains only very few elected representatives: 5 elected representatives out of 3,805 general councillors after the county elections of 19989. Thus, we kept the percentage of seats held by the majority in the General Council. The extreme right elected representatives have been systematically included in the opposition. Furthermore, over the considered period, no seat was held by an elected representative without any partisan attachment. All general councillors have been politically polarized.
Besides the effect of the seats margin, we also study the link between tax rates and the
department president ideology. More precisely, we allow the impact of the margin to be different
depending on her ideology ("left" or "right"). To examine this question, we constructed a crossing variable by multiplying the seats margin previously defined by the LEFT dummy variable (equal to 1 if leftwing parties have a majority and 0 otherwise). Finally, a direct effect of the ideology on the tax rate levels is also possible. According to the literature, the effect of the LEFT variable would be positive, all other things being equal, indicating that the partisan local fiscal policies drive the leftwing local elected representatives to develop public services or social expenditures more than the rightwing local elected representatives. In order to test this hypothesis in France, we also introduced the LEFT variable alone in the regression equations (see table 1). Significance of any ideology variable would add empirical evidence in favour of the hypothesis that local governments in France adopt a partisan-type model when they choose their tax rates.
Table 1
III. THE ECONOMETRIC MODEL
Our first empirical purpose is to investigate the effect of politics on the choice of tax rates by local government in France. Secondly, we want to provide evidence of the effects of political competition on tax choices. We thus attempt to test whether local officials tend to adopt a Leviathan behaviour, for example by increasing tax rates when the political competition is low, or whether they tend to adopt a partisan behaviour, their ideology being a significant explanatory variable of differences in tax rates. To do so we include various political variables into the tax-setting equation. Following the existing but scarce literature (Solé Ollé, 2003; Bordignon et al., 2003), we will estimate a tax-setting equation in which the dependent variable is the local tax rate while the explanatory variables are socio-demographic, economic and political factors. We will also take into account one major aspect of the determination of tax rates, that is the possible influence of tax choices set by nearby jurisdictions which can bias regression results if it is not included as explanatory variables. The existence of such horizontal fiscal interactions is a common prediction of both tax competition and yardstick competition literatures (Brueckner, 2003). Indeed, policy-makers may mimic the tax policies of their neighbours by fear of tax base mobility (tax competition hypothesis) or not being reelected (yardstick competition hypothesis). Consequently, the empirical study of political determinants of local tax setting must be conducted by controlling the possible existence of horizontal tax interactions. Econometrically, we will test the existence of such spatial dependence and use the appropriate specification and estimation procedure based on spatial econometrics developed by Anselin (1988). As is well known from this literature, ignoring such spatial dependence would lead to biased and inefficient estimators. Assessing the magnitude of these horizontal externalities has been the purpose of a growing empirical literature. Many articles such as those of Ladd (1992), Case (1993), Case et al. (1993), Buettner (2001), Heyndels and Vuchelen (1998), Brueckner (1996), Brueckner and Saavedra (2001), Feld and Reulier (2002), Feld et al. (2003) and Solé Ollé (2003) find empirical evidence of
fiscal mimicking among local governments using various data sets. Following this literature and more particularly the article of Leprince et al. (2005) which provides evidence of tax interactions between French departments in a fiscal model but without including the political factors, we will take into account this possible mimicking behaviour by estimating a spatial autoregressive or “spatial lag” model, that includes a weighted average of the tax rates of competing departments in the tax setting function.
The tax setting equation (1) can be written as follows:
i i i i j j ij i w t P X t
(1)In equation (1), the index i refers to the department (i=1,…,93)10. ti represents the business tax rate
set by the department i. Thus, the parameter measures the magnitude of horizontal tax interactions between neighbouring departments. Pi is a vector of political controls and Xi is a vector of explanatory
socio-economic variables also used as control variables.
The estimation of the magnitude of horizontal interactions requires specifying which departments the
department i compete with. This is done by choosing the nature of the (93x93) spatial weight matrix W
included in (1), where wi denotes its i
th
row. Basically, the simple contiguity weight matrix W attributes neighbours to each department. This geographical criterion is adopted in the sense that two
departments are treated as neighbours if they share a border. The element wij is equal to 1 if
departments i and j share a common border, and equal to zero otherwise. Matrix W is then
standardized so that elements of each row sum to one. Note that as it is usual in this literature these weights are arbitrary (Brueckner and Saavedra, 2001)11.
As is well known from the literature on spatial econometrics (Anselin, 1988), several econometric issues must be confronted in estimating equation (1). These are the endogeneity of the tax rates voted by competing departments and the possible spatial error dependence (Brueckner, 2003).
First, equation (1) cannot be consistently estimated by standard ordinary least squares (OLS) because there is an endogeneity problem which is well known in the spatial econometrics literature (Cliff and Ord, 1973). On the one hand, a given department’s tax setting behaviour is influenced by tax rates voted by neighbouring departments. On the other hand (and at the same time) the tax setting behaviour of neighbouring departments is also influenced by the tax setting behaviour of its neighbours, one of whom being the given department. The coefficient is then correlated with the error term ( ) (Anselin, 1988) and using OLS would lead to a biased and inefficient estimation of this parameter. Different approaches to tackle spatial simultaneity have been suggested such as maximum likelihood (ML) and instrumental variables (IV) estimation techniques. Under the first method, the parameter enters nonlinearly in equation (1) and a nonlinear optimisation routine must be used to estimate it. In the current paper, we have implemented the ML approach basically following Case, Rosen and Hines (1993), Besley and Case (1995ab), Brueckner (1996), Saavedra (2000) and Brueckner and Saavedra (2001).
Second, the error term in (1) may exhibit spatial dependence, i.e. it may be correlated across
departments. When spatial error dependence is present, the error vector satisfies the following the relationship:
W (2)
where is an unknown parameter, W is a weight matrix which is often assumed to be the same as in (1) and is a well-behaved error vector. Spatial error dependence is likely to arise when includes omitted variables that are themselves spatially dependent. Case et al. (1993) point out that when this spatial error dependence is ignored (0), estimation of (1) might provide false evidence of strategic interaction. Several approaches exist for dealing with this problem (see Brueckner and Saavedra, 2001). One of them is to estimate (1) taking account of the error structure given by (2) as is done by
Case et al. (1993). However, as Anselin (1988) claims that reliable estimation of the two separate parameters may be difficult, we turn to another method. This method is to separately test the hypotheses 0 and 0 using the robust Lagrange multiplier tests developed by Anselin et al. (1996). First, for , the usual LM test would evaluate the increase in the likelihood function as diverges from zero, rejecting the hypothesis 0 when the increase is sufficiently large. The test statistic is adjusted in order to take into account the influence of , but this adjustment does not require the knowledge of its true value. This is called a robust test. We also use the same kind of procedure to test for the hypothesis 0.
IV. DATA SET AND RESULTS
In order to test the impact of political competition on local taxation, we use data corresponding to the business tax rates set by the French departments for the year 1999. We focus on the business tax because this tax plays an important role in capital and employment decisions since firms may look at the level of the business tax rate to choose their settlement. Despite the fact that local economic development is also a regional and not only a departmental responsibility, many case studies in France show that departments have increasingly awarded grants to firms and tend to develop strong local economic programs to maintain or attract some new firms. Furthermore, even if firms do not vote, local incumbents pay attention to this tax because they know that a change in its level may affect unemployment and consecutively their re-election probability. Unemployment is indeed one of the key factors of the vote (see, among others, Auberger and Dubois, 2005). Another argument to justify the choice of the business tax is that the amount of tax receipts collected through this tax represents the main tax resource of departments, with about 32% of their total tax receipts in 1999.
The data of the business tax rates come from the publications by the Direction Générale des Collectivités Locales (DGCL, Ministère de l’Intérieur) and INSEE (Institut National des Statistiques et des Etudes Economiques). Our sample is composed of the 96 French metropolitan departments except
the three following departments: Haute-Corse, Corse-du-Sud, and Paris. The two Corsican
departments were excluded because the allocation of responsibilities in these departments differs
significantly from what is observed in common departments, and because they do not vote any business tax rates since 1995. Paris being at the same time a municipality and a department do not vote a business tax rate at the departmental level. We therefore use a sample of 93 metropolitan French
departments.
As mentioned earlier, we include two sets of political variables:
The first one is composed of the features of the president of the department council: his SENIORITY, that is the number of years being president of the council, his possible other mandates (SENATOR or MNA, or MAYOR) and finally his POLITICAL PROXIMITY with the political majority in the National Assembly or the Regional Council.
The second one represents the department council’s characteristics: the seats MARGIN obtained by the majority in the previous election and the ideology of the majority (left or right).
Political data are very difficult to gather at the local level in France. Data for the first group was mainly collected on the Internet. Our main reliable source was the website of the French National Assembly. For the second group, data were much more difficult to gather, especially the MARGIN variable. To our knowledge, no computerization was made regarding the seats obtained by parties at county elections. The French Home Office, that rules elections in France, is unable to provide these data. We have then reconstituted the composition of each General Council, seat by seat. Each of the 3,805 counties has been examined and then attributed to the Left or to the Right. Our sources were the two main daily French newspapers, “Le Monde” and “Le Figaro”. For this particular reason, while we know that using a panel data model would probably be the best specification to test the impact of political variables on tax choices, we were not able to gather time-series data and had to deal with the cross-sectional nature of our sample.
We thus ran the usual tests when using cross-section data such as the White test for homoskedasticity whose results guarantee that none of the explanatory variables is correlated with the error term, the Jarque-Bera test (which tests for the normality of regression of residuals) and the spatial tests (Moran test and Lagrange multiplier tests). As the latter detected the existence of spatial dependence, we then use the appropriate specification of the model (a spatial lag model) and the appropriate estimation method (maximum likelihood method). We finally tried to control for cost factors by using the appropriate socio-demographic and economic control variables.
However, using more elections would address another issue for the following reason. Unfortunately, in France, demographic and sociologic variables are not yearly available. They are known for the census years only that is, on the three last decades, for 1982, 1990, and 1999. Analysis of tax rates setting is then possible for census years only. This is also why a panel data set is not easy to construct. We finally retain 1999 as the studied year.
As noted above, department tax policies also reflect the impact of differences in economic and demographic factors grouped in the vector X. Following the empirical literature and knowing that
departments are in charge with specific competences such as economic development, social assistance, department roads maintenance and building and secondary schools, we include two sets of control
variables:
The first one is composed of economic resource variables, such as the PERSONAL INCOME PER CAPITA and the BLOCK GRANTS PER CAPITA. The PERSONAL INCOME PER CAPITA is included to capture its positive effect on the demand in department public services, hence on business tax rates. The expected sign remains however uncertain because this variable is also known to be a proxy for the business tax base, omitted in estimated equation to avoid endogeneity problem, and might thus have a negative effect on tax rate. The expected effect of BLOCK GRANTS is positive on public spending but remains an empirical question on tax rates.
The second data set is composed of “expenditure needs” variables, such as the size of the POPULATION, the department AREA, the URBANISATION RATE, THE SHARE OF OLD PEOPLE and the RATE OF UNEMPLOYMENT. The expected signs are somewhat controversial. Some find that the higher these expenditure needs variables, the heavier the fiscal burden, the higher the tax rates. However, these variables could alternatively exhibit a negative sign because of the existence of economies of scale in the supply of public goods and services. The coefficients of both variables SHARE OF OLD PEOPLE and RATE OF UNEMPLOYMENT are expected to be positive. They represent two categories of people who have specific needs in public spending and benefit from
department programs.
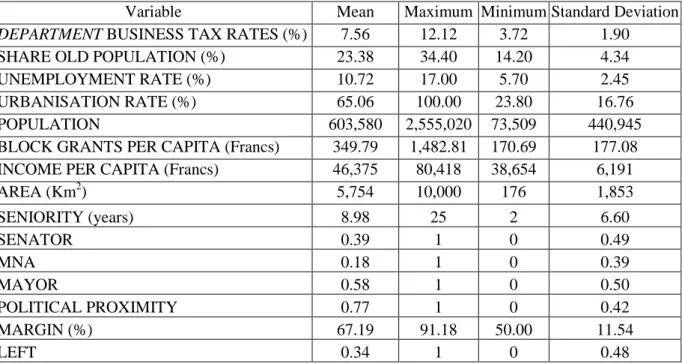
Table 2 provides some descriptive statistics for each variable used.
Table 2
The estimation results are presented in table 312. Column 1 presents OLS estimates of equation (1)
with no horizontal tax effects, that is setting the autoregressive coefficient equal to zero in the specification. Columns 2 to 5 show ML estimates of equation (1) with horizontal effects and the various political variables.
The specification used in columns 2 to 5 has been chosen after having performed various tests on the nature of spatial interdependencies. The Lagrange multiplier tests are based on the OLS results and use the simple contiguity weight matrix Wcont. As the slope parameter may be statistically different from zero when 0 holds in the true model but there is spatial error dependence, we first performed a robust Lagrange multiplier test of the 0 hypothesis. This test remains valid in the presence of uncorrected spatial error dependence. The results showed that the slope parameter is significantly different from zero at the 5 percent level (see column 1), leading us to use ML technique for the
following estimations. The robust Lagrange multiplier test of the spatial error dependence also shows that is not significantly different from zero. We therefore conclude that the error term in (1) does not exhibit spatial dependence.
Table 3
The column 2 shows the results obtained without including the political variables while columns 3 to 5 correspond to the estimation of the spatial tax choice model extended to test the influence of political competition on tax rates. First, the results in column 3 show that none of the political variables of the first group gathering the features of the president of the department council are significant. Although one might think that characteristics such as seniority, proximity with other local or national assemblies, and/or a plurality of local and national mandates make it possible for the president of the
department assembly to reduce the intensity of political competition to increase tax rates or to advance
its platform, empirical evidence suggests this is not the case13. The plurality of mandates might thus be
exploited by local politicians before the election to reduce the competition in the party and obtain the nomination.
However, the political variables of the second group which correspond to the characteristics of the
department council itself are both significant (see columns 4 and 5). Basically, the coefficient of the
seats MARGIN exhibits a negative sign suggesting that governments with high margin tend to set lower tax rates. For example, when the seats margin increases by 10%, the business tax rates in rightwing departments decreases by 1.4%, ceteris paribus.
This result also means that when party competition is low (or when MARGIN is high), officials tend to set lower business tax rates. Hence we interpret this evidence in the French local public sector as suggesting that the hypothesis of a Leviathan behaviour by local incumbents can be rejected since this hypothesis predicted a positive effect of MARGIN on tax rates.
Besides, even if the ideology of local governments does not influence the sign of the coefficient of the seats MARGIN, it influences its level. Indeed the coefficient of the variable LEFT X MARGIN takes a positive sign which means that the tendency to set lower tax rates when the seats margin increases is
weaker for left-wing governments. We interpret the high significance of the coefficient as evidence in favour of the partisan government hypothesis. Note that Solé Ollé (2006) also concludes that empirical evidence supports the partisan model in Spain, but the sign of the effect of margin on budget outcomes is positive for leftwing governments and negative for rightwing governments. We therefore demonstrate that ideology has in France a specific effect on the link between political competition and local tax rates: differences due to ideology exist but this does not lead to different sign of the effect of the margin on tax rates.
Moreover, the results in column 5 show that the coefficient of the dummy variable LEFT takes a significant and positive sign. We then confirm the hypothesis according to which leftwing governments tend to set higher tax rates that rightwing parties ceteris paribus. This result is also observed by Solé Ollé (2003) in Spain.
These three previous results provide empirical evidence that local governments in France (departments) choose their tax rates in a way that is more in line with the partisan government hypothesis than the Leviathan one. This evidence is the first available in France and is in line with evidence in Spain, although with specificities.
Concerning spatial dependence, the results show that in the fiscal model extended by political controls horizontal tax interactions between departments are quite strong. The estimate of the spatial coefficient is large and statistically significant. In the specification of columns 2 to 5, the estimates of range from 0.87 to 0.89 with ML method. This implies that an average business tax increase of 10% in the neighbouring departments induces an increase of 8.7 to 8.9% in the department business tax rate. This gives additional evidence that even in tax models extended to account for the effect of political competition and ideology, tax mimicking between local governments in France is a robust finding.
This result can be explained by a standard tax competition argument or by a yardstick competition argument. Indeed, departments might want to "copy cat" their neighbours either because of the spatial mobility of tax bases and/or because they fear an electoral defeat. Unfortunately, our test can not discriminate between these two hypotheses as we can not allow for different reactions to neighbours’
tax rates by government’s ideology (see Solé Ollé, 2003). Indeed Solé Ollé (2003) provides evidence of yardstick competition between Spanish municipalities by showing that the reaction to neighbours’ tax rates is lower when left-wing parties control the government.
Finally, concerning the socio-economic features, the results in table 2 show that POPULATION and AREA always exhibit a negative sign, which can be explained by the existence of economies of scale. However the URBANISATION RATE takes a positive sign. Both the coefficients of the UNEMPLOYMENT RATE and the SHARE OF OLD PEOPLE take a positive sign, suggesting that these categories of population need specific public spending. When significant, BLOCK GRANTS exhibit a positive sign while the expected negative sign of the INCOME PER CAPITA is confirmed.
V. CONCLUSIONS
This paper has investigated the hypothesis that local politics has an impact on local taxation in the French public sector by using a cross section data set on departments in 1999. We studied the choice by departments of the tax rate of the main local tax in France: the business tax called "taxe professionnelle". For this purpose, we first gathered political data on seats in the General Council of each department and on partisan and personal characteristics of its president, and then estimated tax-setting equations to establish the possible political determinants of local business taxation choices. This allows us to give original empirical insights from French local governments in the political economy literature that distinguishes two alternative models of government behaviours, that is the Leviathan government hypothesis and the partisan government hypothesis.
Our estimation results mainly show that the wider the seats margin, the lower the tax rates, and that this cut is weaker in the case of a leftwing local majority than when the local majority belongs to the right. Therefore we conclude that the partisan government hypothesis is more supported by our French local government data than the Leviathan one. Importantly, the estimated local business tax equations suggest these results after controlling both for socio-economic factors and the presence of
tax interdependencies between departments as recommended by the recent literature (see Brueckner, 2003) on the determinants of local taxation. Such empirical evidence in the French local public sector context is the first concerning how the intensity of political competition influences the tax rate choices and how ideology interacts with this political competition. However, we also show that none of the political variables including the characteristics of the local incumbent is significant. Features such as seniority, proximity with other local or national assemblies, and/or a plurality of local and national mandates have no impact on local tax decisions.
This first evidence suggests that the link between local taxation and politics might have been under-estimated by the literature available in France. Further insights are thus needed. One direction of study would be to analyse more in depth the reason why local tax behaviours exhibit differences related to local politics. One suggestion would be to study the way voters choose between candidates to document how local governments might use budget outcomes to influence election outcomes. Therefore, this is the interplay between elections and tax behaviours at the local level of government that should be modelled more precisely and explicitly.
REFERENCES
ALESINA, A. (1987) Macroeconomic policy in a two-party system as a repeated game, Quarterly
Journal of Economics, 102, pp. 651-678.
ALESINA, A. (1988) Macro-economics and politics, in S. Fischer (ed.) NBER Macroeconomics
Annual, MIT Press, Cambridge, MA, pp. 13-52.
ALESINA, A. and DRAZEN A. (1991) Why are stabilization delayed?, American Economic Review, 81, pp. 1170-1188.
ALESINA, A., ROUBINI, N. and COHEN, G. (1997) Political cycles and the Macroeconomy, Cambridge MA: The MIT Press.
ALT, J.E. and LOWRY, R. (1994) Divided government, fiscal institutions and budget deficits,
American Political Science Review, 88, pp. 811-828.
ALT, J.E. and LOWRY, R. (2000) A dynamic model of state budget outcomes under divided partisan government, Journal of Politics, 62, pp. 1035-1069.
ANSELIN, L. (1988) Spatial econometrics: Methods and models, Kluwer Academic Publishers, Dordrecht.
ANSELIN, L., BERA, A., FLORAX, R. and YOON, M. (1996) Simple diagnostic tests for spatial dependence, Regional Science and Urban Economics, 26, pp. 77-104.
AUBERGER, A. and DUBOIS, E. (2005) The influence of local and national economic conditions on French legislative elections, Public Choice, 125, pp. 363-383.
BESLEY, T. and CASE, A. (1995a) Incumbent behaviour: Vote seeking, tax setting and yardstick competition, American Economic Review, 85, pp. 25-45.
BESLEY, T. and CASE, A. (1995b) Does electoral accountability affect economic policy choices? Evidence from gubernatorial term limits, Quarterly Journal of Economics, 150, pp. 769-798.
BESLEY, T. and SMART, M. (2001) Electoral accountability and competition among governments, Unpublished manuscript, London School of Economics.
BINET, M.E. and PENTECÔTE, J.S. (2001) Is there a French municipal political business cycle?, CERESUR Working paper, University of La Réunion.
BORDIGNON, M., CERNIGLIA, F. and REVELLI, F. (2003) In search of yardstick competition: A spatial analysis of Italian municipality property tax setting, Journal of Urban Economics, 54, pp. 199-217.
BOYNE, G. (1994) Party competition and local spending decisions, British Journal of Political
Science, 35, pp. 210-222.
BRENNAN, G. and BUCHANAN, J.M. (1980) The power to tax: Analytical foundations of fiscal
constitution, Cambridge University Press.
BRUECKNER, J.K. (1996) Testing for strategic interaction among local governments: The case of growth controls, Journal of Urban Economics, 44, pp. 438-467.
BRUECKNER, J.K. (2003) Strategic interaction among governments: an overview of empirical studies, Working paper, University of Illinois at Urbana-Champaign.
BRUECKNER, J.K. and SAAVEDRA, L. (2001) Do local governments engage in strategic property-tax competition?, National Tax Journal, 54, pp. 203-229.
BUETTNER, T. (2001) Local capital income taxation and competition for capital: The choice of the tax rate, Regional Science and Urban Economics, 31, pp. 215-245.
CAILLE, P.O. (2000) Le cumul des mandats au regard des expériences étrangères, Revue du Droit
Public, 6, pp. 1701-1743.
CAPLAN, B. (2001) Has Leviathan been bound? A theory of imperfectly constrained government with evidence from the states, Southern Economic Journal, 76, pp. 825-847.
CASE, A.C. (1993) Interstate tax competition after TRA86, Journal of Policy Analysis and
Management, 12, pp. 136-148.
CASE, A.C., ROSEN, H.S. and HINES, J.R. (1993) Budget spillovers and fiscal policy interdependence: Evidence from the states, Journal of Public Economics, 52, pp. 285-307.
CLIFF, A. and ORD, J. (1973) Spatial autocorrelation, London, Pion.
CREAM (1998) Le cumul des mandats et des fonctions, La Documentation Française, Paris.
DEBRENNE, E. and REVEL, S. (1998), L'état du cumul en Europe, Pouvoirs Locaux, 36, pp. 30-33. DOWNS, A. (1957) An Economic Theory of Democracy. New York, Harper and Row.
FELD, L., JOSSELIN, J.M. and ROCABOY, Y. (2002) Le mimétisme fiscal : une application aux régions françaises, Economie et Prévision, 156, pp. 43-49.
FELD, L.P and REULIER, E. (2002) Strategic tax competition in Switzerland: Evidence from a panel of the Swiss Cantons, CESifo Working Paper series.
FOUCAULT, M. (1999) Le cumul des mandats : un atout supplémentaire pour gagner les élections ? Une analyse empirique à partir des élections législatives françaises de 1997, mimeo, LAEP, université de Paris 1.
de HAAN, J. and STURM, J.E. (1994) Political and institutional determinants of fiscal policy in the European Community, Public Choice, 80, pp. 157-172.
von HAGEN, J. (1992) Budgeting procedures and fiscal performance in the European Community, Economic Papers, Commission of the European Community, n° 96.
HEYNDELS, B. and VUCHELEN, J. (1998) Tax mimicking among Belgian municipalities, National
HIBBS, D.A. (1977) Political Parties and Macroeconomic Policy, American Political Science Review, 71, pp. 1467-1487.
HOEFFEL, D. (1998) Le cumul des mandats : mythe ou réalité ?, Pouvoirs Locaux, 36, pp. 15.
HOGGART, K. (1985) Political party control and the sale of local authority dwellings, 1974-83,
Government and Policy, 3, pp. 464-474.
KNAPP, A. (1991) The cumul des mandats, local power and political parties in France, Western
European Politics, 14, pp. 18-40.
KNEEBONE, R.D. and MCKENZIE, K.J. (2001) Electoral and partisan cycles in fiscal policy: An examination of Canadian provinces, International Tax and Public Finance, 8, pp. 753-774.
LADD, H.F. (1992) Mimicking of local tax burdens among neighbouring countries, Public Finance
Quarterly, 20, pp. 450-67.
LEPRINCE, M., PATY, S. and REULIER, E. (2005) Choix d’imposition et interactions spatiales entre collectivités locales : un test sur les départements français, Recherches économiques de Louvain, 71, 67-93.
MADIES, T., PATY, S. and ROCABOY, Y. (2005), Horizontal and vertical externalities: An overview of theoretical and empirical studies, Urban Public Economics Review, 2, pp. 63-93.
MILESI-FERRETTI, G.M., R. PEROTTI and ROSTAGNO, M. (2002) Electoral systems and public spending, Quarterly Journal of Economics, 117, pp. 609-657.
NORDHAUS, W.D. (1975) The Political Business Cycle, Review of Economic Studies, 42, pp. 169-190.
OLIVIER, L. (1998) La perception du cumul des mandats, restrictions contextuelles et politiques à un apparent consensus, Revue Française de Science Politique, 48, pp. 756-771.
PERSSON, T. and TABELLINI, G. (1999) The Size and Scope of Government: Comparative Politics with Rational Politicians, European Economic Review, 43, pp. 699-735.
PERSSON, T. and TABELLINI, G. (2003) The Economic Effects of Constitutions, Cambridge, MA, MIT Press.
PETTERSSON-LIDBOM, P. (2000) Elections party politics and economy politics, monograph No. 40, Institute for International Economics Studies, Stockholm University.
PETTERSSON-LIDBOM, P. (2005) Does the size of the legislature affect the size of government? Evidence from two natural experiments, working paper.
POTERBA, J. (1994) State responses to fiscal crises: The effects of budgetary institutions and politics,
Journal of Political Economy, 102, pp. 799-821.
REVELLI, F. (2001) Spatial patterns in local taxation: tax mimicking or error mimicking ?, Applied
Economics, 33, pp. 1101-1107.
REVELLI, F. (2002) Testing tax mimicking versus expenditure spill over hypothesis using English data, Applied Economics, 34, pp. 1723-1731.
ROGERS, D. and ROGERS, J. (2000) Political competition and state government size: Do tighter elections produce looser budgets?, Public Choice, 105, pp. 1-21.
ROGOFF, K. (1990) Equilibrium political budget cycles, American Economic Review, 80, pp. 21-36. ROGOFF, K. and SIBERT, A. (1988) Elections and macro-economic policy cycle, Review of
Economic Studies, 55, pp. 1-16.
ROUBINI, N. and SACHS, J. (1989a) Government spending and budget deficits in the industrial countries, Economic Policy, n°8, pp. 100-132.
ROUBINI, N. and SACHS, J. (1989b) Political and economic determinants of budget deficits in the industrial democracy, European Economic Review, 33, pp. 903-938.
SAAVEDRA, L.A. (2000) A model of welfare competition with evidence from AFDC, Journal of
Urban Economics, 47, pp. 248-279.
SALMON, P. (1987) Decentralisation as an incentive scheme, Oxford Review of Economic Policy, 3, pp. 24-43.
SPOLAORE, E. (2004) Adjustments in different government systems, Economics and Politics, 16, pp. 117-146.
SOLÉ OLLÉ, A. (2003) Electoral accountability and tax mimicking: The effects of electoral margins, coalition government, and ideology, European Journal of Political Economy, 19, pp. 685-713.
SOLÉ OLLÉ, A. (2006) The effects of party competition on budget outcome: Empirical evidence from local governments in Spain, Public Choice, 126, pp. 145-176.
Table 1. The political variables
Group Nature of the variables List of the political variables in the
department i
Group I Features of the president of the General (or department) Council
SENATOR = 1 if the president is also a senator, 0 otherwise
MNA = 1 if the president is also a MNA, 0 otherwise
MAYOR = 1 if the president is also a mayor, 0 otherwise
POLITICAL PROXIMITY = 1 if the president is close to the political majority of the National Assembly or the regional Council
SENIORITY: number of years of presidency
Group II Features of the majority of the General (or department) Council
MARGIN: seats margin in favour of the majority
LEFT = 1 if the majority is left-wing, 0 otherwise
Table 2. Summary statistics
Variable Mean Maximum Minimum Standard Deviation
DEPARTMENT BUSINESS TAX RATES (%) 7.56 12.12 3.72 1.90
SHARE OLD POPULATION (%) 23.38 34.40 14.20 4.34
UNEMPLOYMENT RATE (%) 10.72 17.00 5.70 2.45
URBANISATION RATE (%) 65.06 100.00 23.80 16.76
POPULATION 603,580 2,555,020 73,509 440,945
BLOCK GRANTS PER CAPITA (Francs) 349.79 1,482.81 170.69 177.08
INCOME PER CAPITA (Francs) 46,375 80,418 38,654 6,191
AREA (Km2) 5,754 10,000 176 1,853 SENIORITY (years) 8.98 25 2 6.60 SENATOR 0.39 1 0 0.49 MNA 0.18 1 0 0.39 MAYOR 0.58 1 0 0.50 POLITICAL PROXIMITY 0.77 1 0 0.42 MARGIN (%) 67.19 91.18 50.00 11.54 LEFT 0.34 1 0 0.48
Table 3. Estimates of the business tax model
Variables 1. MCO 2. MV 3. MV 4. MV 5. MV DEPARTMENT BUSINESS TAX RATE ( ) 0.89** (75.4) [0.00] 0.88** (70.5) [0.00] 0.87** (58.7) [0.00] 0.87** (52.8) [0.00]
POLITICAL PROXIMITY 0.00 (0.05) [0.80] SENIORITY 0.02 (0.90) [0.34] SENATOR -0.05 (2.18) [0.14] MNA -0.01 (0.09) [0.76] MAYOR -0.02 (0.63) [0.42] MARGIN -0.14* (2.87) [0.09] LEFT*MARGIN 0.03** (13.2) [0.00] LEFT 0.12** (11.6) [0.00]
BLOCK GRANT PER CAPITA 0.15*
(1.7) [0.08] 0.11 (2.55) [0.11] 0.12* (2.64) [0.10] 0.09 (1.89) [0.17] 0.09 (1.62) [0.20] POPULATION -0.05 (-1.1) [0.27] -0.06 (2.11) [0.14] -0.05 (1.42) [0.23] -0.06 (2.48) [0.11] -0.06 (2.47) [0.11]
SHARE OLD POPULATION 0.58**
(3.5) [0.00] 0.39** (8.01) [0.00) 0.45** (10.1) [0.00] 0.32** (6.06) [0.01] 0.31** (5.52) [0.01] UNEMPLOYMENT RATE 0.16 (1.4) [0.16] 0.15* (2.58) [0.10] 0.15* (2.63) [0.10] 0.07 (0.59) [0.44] 0.10 (1.31) [0.25]
INCOME PER CAPITA -0.63**
(-2.4) [0.01] -0.63** (7.98) [0.00] -0.60** (6.36) [0.01] -0.51** (5.97) [0.01] -0.50** (5.53) [0.01] URBANISATION RATE 0.27** (2.41) [0.01] 0.22** (5.38) [0.02] 0.23** (5.72) [0.01] 0.16* (3.11) [0.07] 0.15 (2.53) 0.11 AREA -0.13** (-4.2) [0.00] -0.13* (23.0) [0.00] -0.12** (18.5) [0.00] -0.11** (16.9) [0.00] -0.11** (16.4) [0.00] Constant 6.57** (2.21) [0.03] 5.82** (5.22) [0.02] 4.97* (3.32) [0.06] 5.78** (5.76) [0.01] 5.1* (4.47) [0.03] Adjusted R2 0.527 - - - - Log likelihood 34.89 43.37 45.09 50.35 48.85
LM robust test of spatial lag dependence
[0.00] - - - -
LM robust test of spatial error dependence
[0.65] - - - -
Notes: The dependent variable is the DEPARTMENT BUSINESS TAX RATE. All variables are log-transformed. Student values (resp. Wald statistics) are reported in parentheses with OLS (resp. ML) estimation techniques. Probability values are given in brackets. **: significant at 5% ; * : significant at 10%. Number of observations: 93; Year: 1999.
1
Basically, fiscal resources are determined as follows: B
tR tD tM
where B is the tax base, tR, tD,M
t are the tax rates voted by the region, the department, and the municipality respectively. Tax payments are
collected by the central government that pays back one part to the region, one part to the department and one part to the municipality according to the tax rates they have voted.
2 In 2001. This figure may vary due to county boundary changes.
3 Then, due these two different electoral levels, constituencies are not divided in counties and the geographical
limits of constituencies and counties do not coincide. 4
There are no county elections in Paris. The Council of Paris serves at the same time as a General Council and as a municipal Council. These Paris political particularities, as those of budgetary nature (the budget of the city and the budget of the department are strongly overlapped), impose the exclusion of Paris department of the metropolitan departments analyzed in what follows.
5
Whole France is Metropolitan France plus overseas territories.
6 The main rules dealing with the limitation of the plurality of electoral assignments and elective functions have
been settled by three laws: the organic law No. 2000-294 of April, 2000, 5 relative to the incompatibilities between electoral assignments (for the MNA), the law No. 2000-295 of April, 2000, 5 relative to the limitation of the plurality of electoral assignments and elective functions (that concerns local elected representatives, European MPs and the incompatibilities between local executive functions), and the law No. 2003-327 of April, 2003, 11 relative to the election of regional councillors and European MPs. See the following site for more
detailed informations on these three laws: http://www.interieur.gouv.fr
7
They show that mayors of cities of Lombardy who cannot be reelected have no incentive to mimic the fiscal policies of the neighbouring elected representatives.
8 The extreme right achieved 10.21% at the first round and 2.64% at the second round in 1994 and 14.10% at the
first round and 7.45% at the second round in 1998 (Sources: BDSP – Home Office). 9
An elected representative in each of the following departments: Eure-et-Loir, Manche, Oise, Haut-Rhin, and Var.
10 See the data section for details on the sample.
11 Since weights are arbitrary, this specification of the nature of horizontal interactions has been tested against an
alternative. Results were similar and are therefore not presented here. This second scheme is given by Wd and
imposes a smooth distance decay, with weights given by 1/dij where dij is the distance between departments i
and j for ji. 12
All the estimates have been conducted with MATLAB. The specific program used to take into account spatial dependence has been courteously provided by Prof. Hubert Jayet (University of Lille) but is also freely
downloadable on the James P. LeSage's website www.spatial-econometrics.com
13 Since BLOCK GRANTS is a budgetary variable set by the Central Government, we may think that there is a
correlation between this variable and the characteristics of the President or the General Council (a political proximity for example may help to have more subsidies). The inspection of the correlations shows that this is not the case, all the correlations between the political variables and BLOCK GRANTS being below 0.3 in absolute value.