HAL Id: hal-02345184
https://hal.archives-ouvertes.fr/hal-02345184
Submitted on 7 Dec 2020
HAL is a multi-disciplinary open access
archive for the deposit and dissemination of
sci-entific research documents, whether they are
pub-lished or not. The documents may come from
teaching and research institutions in France or
abroad, or from public or private research centers.
L’archive ouverte pluridisciplinaire HAL, est
destinée au dépôt et à la diffusion de documents
scientifiques de niveau recherche, publiés ou non,
émanant des établissements d’enseignement et de
recherche français ou étrangers, des laboratoires
publics ou privés.
Morphology
Godefroy Leménager, Sandrine Tusseau-Nenez, Maud Thiriet, Pierre-Eugène
Coulon, Khalid Lahlil, Eric Larquet, Thierry Gacoin
To cite this version:
Godefroy Leménager, Sandrine Tusseau-Nenez, Maud Thiriet, Pierre-Eugène Coulon, Khalid Lahlil,
et al.. NaYF4 Microstructure, beyond Their Well-Shaped Morphology. Nanomaterials, MDPI, 2019,
9 (11), pp.1560. �10.3390/nano9111560�. �hal-02345184�
NaYF
4
microstructure, beyond their well-shaped
morphology
Godefroy Leménager1 , Sandrine Tusseau-Nenez1, Maud Thiriet1, Pierre-Eugène Coulon2, Khalid Lahlil1, Eric Larquet1, Thierry Gacoin1
1 Laboratoire de Physique de la Matière Condensée,
École Polytechnique, CNRS, Université Paris Saclay, 91128 Palaiseau, France 2 Laboratoire des Solides Irradiés,
École Polytechnique, CNRS, Université Paris Saclay, 91128 Palaiseau, France.
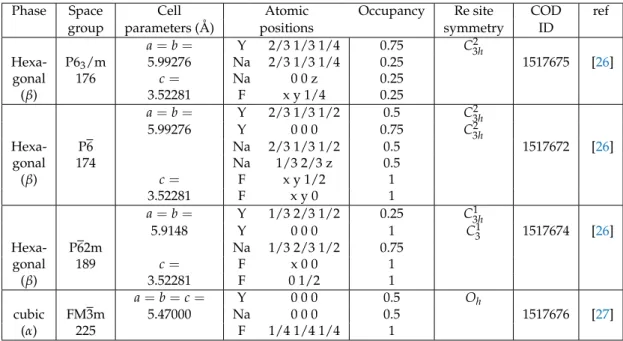
* Correspondence: [email protected], [email protected] Version August 18, 2019 submitted to Nanomaterials
Abstract: Lanthanide doped nanoparticles are widely investigated for their optical properties.
1
However, the sensitivity of the lanthanide ions to the local symmetry, useful when investigating
2
structural environments, becomes a drawback for optimized properties in the case of poorly controlled
3
crystallinity. In this paper, we focus on β-NaYF4 nanorods in order to provide a detailed description
4
of their chemical composition and microstructure. The combination of detailed XRD analysis and
5
TEM observations show that strong variation may be observed from particles from a same batch of
6
synthesis, but also when considering small variations of synthesis conditions. Moreover, also the
7
nanorods observed by SEM exhibit a very nice faceted shape, they are far from being monocrystalline
8
and present significant local deviation of crystalline symmetry and orientation. All these structural
9
considerations, sensitively probed by polarized emission analysis, are crucial to be analyzed for the
10
development of optimal systems toward the targeted applications.
11
Keywords:X-ray diffraction; crystalline structure; polarized luminescence
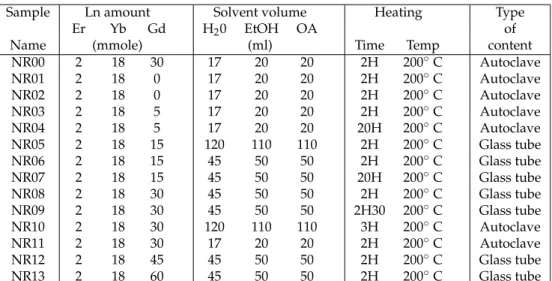
12
1. Introduction
13
The lanthanide doped NaYF4nanoparticles (NPs) are a unique class of luminescent nanoparticles
14
that focus increasing attention due to their efficient up-conversion properties and the ability, through
15
colloid chemistry, to nicely play on a variety of shapes[1–3], length[4,5], doping[6]. In the last decade,
16
these particles have been considered for a large variety of innovative applications such as biological
17
labeling, nanothermometers[7,8], rheometry[9], anti-counterfeiting [10,11].
18
As in all rare-earth doped luminescent compounds, optical properties (emission efficiency, spectral
19
shapes) are known to result from the intrinsic properties of sensitizing ions modulated by their
20
environment within the host matrix. The effect on spectral shape is of primary importance when d
21
orbitals are involved (Eu2+, Ce3+), but remains significant for transitions implying only f-electron
22
states. This is well documented in the case of Eu3+doped compounds, this ion being considered as
23
a very good probe of local environment, providing good indications on site symmetry through the
24
hypersensitive5D
0−7F2transition[12]. Much less is known and understood on structure/property
25
relationships in the case of up-conversion compounds, which involve more complex emission scheme
26
and energy levels [12]. NaYF4, which is the emblematic compound for up-conversion, is known to
27
exist in two different polymorphs: cubic α -NaYF4and hexagonal β -NaYF4. The impact of the host
28
crystal on optical properties is directly evidenced by the poor emission properties of the α -NaYF4as
29
compared to the β -NaYF4[ref]. As revealed by a literature survey, the exact structure of the hexagonal
30
β-NaYF4phase is not so clear [13–17] since three slightly different crystalline structures (see table2)
31
have been reported, with small but significant variations of their cell parameters and structures, but
32
also different host site symmetries.
33
Following our recent study on LaPO4:Eu nanorods[18], the initial purpose of the present work
34
was to investigate structure/property relationship in the case of NaYF4:Yb-Er nanoparticles, with
35
the objective of understanding and optimizing emission properties including emission yield, spectral
36
shape of the emission lines and polarization properties. On this way, polarization characterization
37
rapidly provided evidences that such an investigation would be first limited by the fact that NaYF4
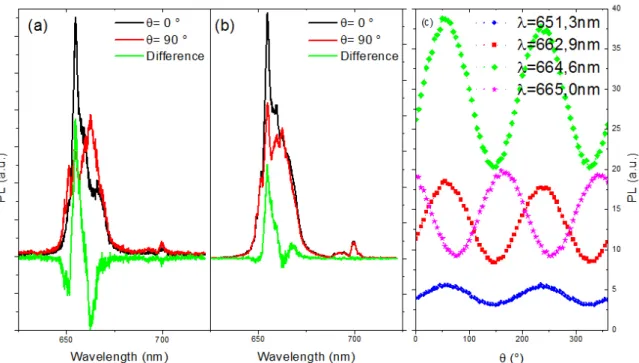
38
nanorods are apparently not monocrystalline and present a significant microstructure. We found that
39
structural investigations of NaYF4 nanoparticles have never been discussed in details despite the
40
numerous works done on this kind of particles, all obtained following similar routes. We attribute
41
this lack of interest to the very nice shape of the particles as revealed by SEM pictures, which suggest
42
an excellent quality of their structure thus hiding interest for such studies. Moreover, polarization
43
of the emission is not so commonly characterized, and appears to be a very sensitive probe of the
44
microstructure[18]. All these points motivated the present study, aiming in providing new insights on
45
the particles microstructure in order to understand and optimize optical properties that are the basis of
46
increasing number of very exciting applications [19–22].
47
2. Experimental section
48
2.1. Typical synthesis of the Er3+/Yb3+/Gd3+-NaYF
4nanorods
49
GdCl3.6H2O (99.99%), YCl3.6H2O (99.99%), YbCl3.6H2O (99.99%), ErCl3.6H2O (99.99%), NaOH
50
(98%), NH4F (98%), NaF (98%) and oleic acid (90%) were all purchased from Sigma-Aldrich and used
51
as starting materials without any further purification.
52
Synthesis where adapted from the protocols of [23] and [24], which consists in solvothermal
53
precipitation of chloride lanthanide salts and NH4F in a water/ethanol/oleic acid mixture.
54
Experimental conditions are shown on table1for samples labeled NRXX for nanorods sample N◦XX.
55
In a typical experiment (eg sample NR11), 30 mmol (1.2 g) of NaOH in 5.6 mL of water were mixed
56
with 20 mL of ethanol (EtOH) and 20 mL of oleic acid (OA) under stirring. To the resulting mixture
57
were selectively added 0.75 mmol (228 mg) of YCl36H2O, 0.27 mmol (104.6 mg) of YbCl36H2O, 0.03
58
mmol (11.4 mg) of ErCl36H2O, 0.45 mmol (167 mg) of GdCl36H2O and 7.7 mmol (278 mg) of NH4F
59
dissolved in 12 mL of water. The solution was then transferred into a 75 mL autoclave and heated
60
at 200◦C for 2 h under stirring. In some cases, the NPs were heated for a longer time (24h instead
61
of 2h) to remove the α-NaYF4NPs and also a sealed glass tube has been used to test higher pressure
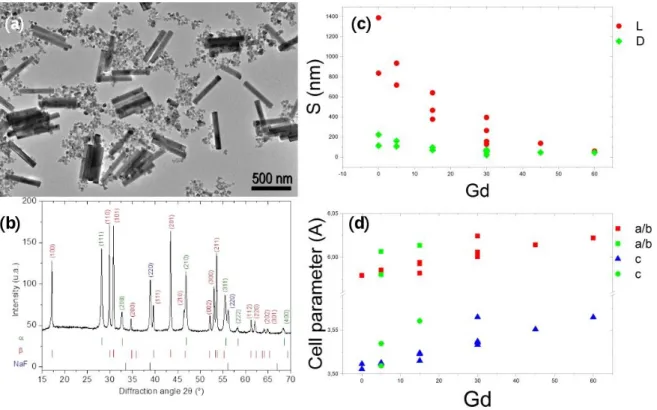
62
synthesis. After cooling down to ambient temperature, the resulting nanoparticles were precipitated
63
by addition of 50 mL of ethanol, collected by centrifugation, washed with water and ethanol several
64
times. They were finally dried and kept as a powder. For the optical experiments, we manipulate
65
the nanorods (NRs) as aqueous dispersion to ease the manipulation and observations. In this case,
66
a functionalization by ligand exchange is needed to ensure the good dispersion in water. About 20
67
mg of NaYF4@oleic acid NPs are sonicated and centrifuged several times with 2 mL aqueous citrate
68
solution (0.2 M), washed with EtOh and water to remove remaining oleic acid molecules, finally the
69
nanorods are well dispersed in water.
70
2.2. Confocal microscopy
71
The NPs were analyzed by a confocal microscopy system from Nikon (Nikon Eclipse Ti with
72
confocal module C2 Si). A nanomolar solution of citrate functionalized NPs in water is first sonicated 4
73
times 45s (450W Branson) to ensure the perfect dispersion of the NRs and then drop-casted on a glass
74
coverslip. A Tsunami Ti-Saphire pulsed laser was focused on the NPs with a 60x oil objective. The
75
polarized resolved spectroscopy was performed by means of a spectrometer (IsoPlane SCT320 from
76
Princeton Instrument) coupled to CCD (Pixis-400-BX) and a motorized polarizer.
Sample Ln amount Solvent volume Heating Type Er Yb Gd H20 EtOH OA of Name (mmole) (ml) Time Temp content NR00 2 18 30 17 20 20 2H 200◦C Autoclave NR01 2 18 0 17 20 20 2H 200◦C Autoclave NR02 2 18 0 17 20 20 2H 200◦C Autoclave NR03 2 18 5 17 20 20 2H 200◦C Autoclave NR04 2 18 5 17 20 20 20H 200◦C Autoclave NR05 2 18 15 120 110 110 2H 200◦C Glass tube NR06 2 18 15 45 50 50 2H 200◦C Glass tube NR07 2 18 15 45 50 50 20H 200◦C Glass tube NR08 2 18 30 45 50 50 2H 200◦C Glass tube NR09 2 18 30 45 50 50 2H30 200◦C Glass tube NR10 2 18 30 120 110 110 3H 200◦C Autoclave NR11 2 18 30 17 20 20 2H 200◦C Autoclave NR12 2 18 45 45 50 50 2H 200◦C Glass tube NR13 2 18 60 45 50 50 2H 200◦C Glass tube
Table 1.Summary of all the synthesis parameters
2.3. TEM observation
78
Transmission Electron Microscopy (TEM) experiments were performed using a field emission gun
79
JEOL JEM-2010F microscope operating at 200 kV with a high-resolution HR polar piece (Cs = 1.0 mm,
80
Cc= 1.4 mm, point resolution = 0.24 nm, with a dose of≈20 electrons Å at 50,000 magnification and≈
81
100 electrons Å at 250,000 magnification). Chemical mapping was performed by XEDS (Cliff-Lorimer
82
methods) using a FEI Titan Themis probe-corrected microscope operating at 200kV and equipped with
83
a Scanning Transmission Electron Microscopy (STEM) module at 115,000 and 225,000 magnification
84
(probe size 1 Å) and "Super-X" detectors (beam convergence angle : 24.6 mrad).
85
During the ions quantification, an amorphization of the NPs may be observed. The loss of the
86
crystalline structure can increase the ion mobility and change the doping repartition in the NP but not
87
the average doping of a NP. For this reason, we present only global measurements on whole NPs.
88
2.4. X-Ray diffraction: ESRF
89
The synchrotron X-Ray powder diffraction experiments were carried out at the Swiss-Norwegian
90
Beam-Lines (BM1A station) of the European Synchrotron Radiation Facility (ESRF), France. A
91
monochromatic beam of wavelength λ = 0.7129 Å was focused onto the sample by sagittal bending of
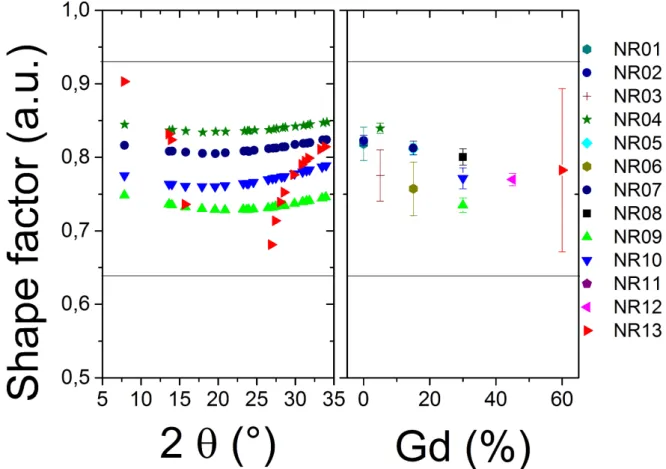
92
the second crystal of a double-crystal Si(111) monochromator using additional slits of 272.26∗327.34
93
µm2. X-Ray Powder Diffraction (XRPD) data were collected in transmission geometry using a
94
pixel-array detector (PILATUS 2M, Dectris Ltd). Samples were sealed in 0.4 mm diameter glass
95
capillaries and rocked by 10◦during data collection. The instrumental resolution was determined
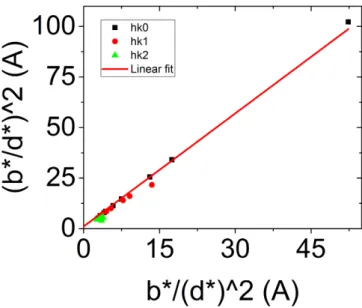
96
using a LaB6NIST standard (Standard Reference Material 660a, cell parameter = 0.41569162 nm±
97
0.00000097 nm at 22.5◦C).
98
The selected patterns for the identification of phases by XRPD and the crystallographic data (COD
99
database [25]) for the line profile analysis are summarized in Table2.
100
3. Results and discussion
101
3.1. Confocal microscopy and polarized luminescence
102
With our confocal set-up, the polarized spectra of our NPs deposited by drop-casting of diluted
103
NaYF4NPs in water are measured. The low concentration coupled to a sonication of the solution just
104
prior deposition leads to dispersed NPs on the glass coverslip. Without reference, the orientation of the
105
NP cannot be known nor the expected orientation of the polarization. We measured the spectra for a
Phase Space Cell Atomic Occupancy Re site COD ref group parameters (Å) positions symmetry ID
a=b= Y 2/3 1/3 1/4 0.75 C23h Hexa- P63/m 5.99276 Na 2/3 1/3 1/4 0.25 1517675 [26] gonal 176 c= Na 0 0 z 0.25 (β) 3.52281 F x y 1/4 0.25 a=b= Y 2/3 1/3 1/2 0.5 C23h 5.99276 Y 0 0 0 0.75 C2 3h Hexa- P6 Na 2/3 1/3 1/2 0.5 1517672 [26] gonal 174 Na 1/3 2/3 z 0.5 (β) c= F x y 1/2 1 3.52281 F x y 0 1 a=b= Y 1/3 2/3 1/2 0.25 C1 3h 5.9148 Y 0 0 0 1 C31 1517674 [26] Hexa- P62m Na 1/3 2/3 1/2 0.75 gonal 189 c= F x 0 0 1 (β) 3.52281 F 0 1/2 1 a=b=c= Y 0 0 0 0.5 Oh cubic FM3m 5.47000 Na 0 0 0 0.5 1517676 [27] (α) 225 F 1/4 1/4 1/4 1
Table 2.Crystallographic data on synthesized phases of NaYF4for phase identification and rare-earth (Re) ion site symmetry
wide range of polarization angle. In these conditions, the axes of the two orthogonal electric dipoles will
107
be given by the least brilliant and the brightest spectra. In Fig.1.a we present the photoluminescence
108
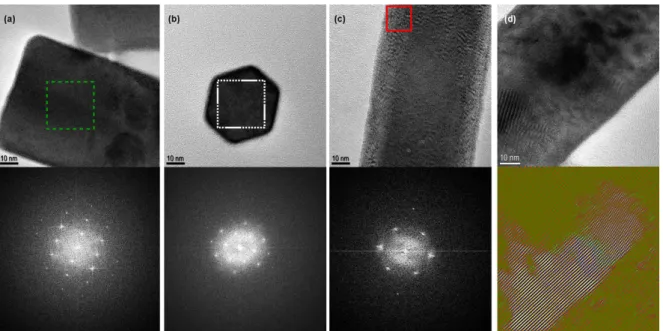
(PL) spectrum for two orthogonal polarizations (red and blue) and the difference between them in
109
green. Moreover, by plotting the PL intensity versus the polarization angle (see Fig.1.b), the typical
110
dipole-like behavior expected from lanthanide ions appears to be in good approximation with the
111
Malus law.
112
However, if we look in detail this dependence for several wavelengths, the extreme values are
113
not obtained for the same angles as expected. Indeed, the polarization is due to the site symmetry
114
of the lanthanide ion and the electrons can optically relax by emitting α, σ or π photons [28] with
115
orthogonal polarization. Then a PL dependence can only present two angles for the PL optima values
116
for all measured transitions, which is not the case: the 665.0 nm transition has a maximum shifted
117
of 20◦as compared to another transitions at 662.9 nm. This observation leads to conclude that the
118
local symmetry orientation is not the same for all the emitters. To understand this observation, we
119
investigated the microstructure of the particles in more details.
120
3.2. TEM observation and doping homogeneity
121
The doping of the NaYF4 NPs (nature and concentration of the rare earth ions) plays an
122
unquestionable part in the shape and structure of the NPs[3]. Several batches of NPs were synthetized
123
with different nominal doping concentrations. The effective doping of NPs was measured by EDX
124
analysis. The table3presents the expected and effective doping of particles obtained from different
125
syntheses and shown in figure2.
126
The three first samples were prepared under similar conditions (doping concentration, heating
127
temperature and time). However, the effective dopings are found to be different: NRs are less rich in
128
Y of about 20 mol%, more than 3 times more rich in Er whereas Yb and, in a minor way, Gd doping
129
are close to the expected values. This shows the sensitivity of the synthesis to some parameters that
130
can be associated to the volume of solvent and the type of container, that could affect for example the
131
pressure during the synthesis.
132
TEM observations evidences two situations. On one hand, we sometime observe in the same
133
batch two (or more) populations of NPs, each one having a relatively low size dispersion. However,
Figure 1.(a-b) Spectrum for two orthogonal polarizations (red and black) and the difference between them (green) for two different NPs of the same batch NR07. (c) PL intensity versus polarization for different wavelengths.
Sample TEM size (nm) Aspect Expected doping (mol%) Measured doping (mol%) Area in name L D Ratio Y Er Yb Gd Y Er Yb Gd Fig.2
NR00 300 50 6 50 2 18 30 40.2 9.4 18.2 32 NR09 150 60 2.5 50 2 18 30 40.0 6.9 15.6 38.6 NR11 200 30 6.6 50 2 18 30 41.5 8.4 17.5 32 1 640 100 6.4 56 6.7 13.4 18 2 NR13 55 40 1.4 20 2 18 60 13.3 14.5 13.5 58 4 130 35 3.7 23.9 14.6 13.9 47.6 3
Table 3.Expected and effective doping concentration of different NPs measured by EDX. Two lines in the tabular correspond to two population measured by EDX. The NPs sizes given come from the measured NPs and can differ from the mean values.
the size of each population can be very different as it is illustrated in Fig.2for two syntheses (NR11
135
and NR13). The EDX measurements of the delimited area give us the chemical composition as reported
136
in the table3. For each population, we measure a strong difference in the gadolinium concentration
137
(and in consequence the yttrium concentration) while erbium and ytterbium concentrations present
138
only small variations. In Fig.2.a, the NP in the area (1) delimited by the dotted green line area has a
139
concentration of gadolinium of 32 mol% and its size is typical from this synthesis (50 * 260 nm), while
140
the NP shown by the continuous red line (area 2) has a concentration of only 18 mol% and its size is
141
twice the average size (110 * 650 nm) with a similar aspect ratio. Another example for the batch NR013
142
is presented in Fig.2.b where the same behavior is observed with a complete different aspect ratio.
143
While the experimental conditions are exactly the same, one (NR00) or two populations of particle
144
sizes (NR11) are observed, with identical aspect ratios (about 6). At this stage, no clear parameter can
145
explain these results but this is probably an evidence that the two kind of particles formed at different
146
time during the synthesis, probably because the kinetic of formation of Gd rich or Gd poor particles is
147
different.
148
On the other hand, the expected doping and the effective doping can differ strongly. Depending
149
on the synthesis, the gadolinium concentration expected to be around 30%, is found to vary from
Figure 2.Two TEM images of NaYF4NPs from the two batches presenting two NPs populations ((a) NR11 and (b) NR13)
18% to 38%. Two samples share a population with the same doping while the first sample presents
151
a different doping. The two last experiments were done with another solvent ratio compared to the
152
first experiment resulting in a different pressure during the synthesis. These differences in pressure,
153
solvent composition and the correlated solubility can explain the doping difference between the first
154
and the two last syntheses.
155
3.3. Phase identification and doping dependence
156
In Fig. 3.b, we present one typical diffraction pattern obtained for a mixture of α-NaYF4and
157
β-NaYF4phases. The mixture of these two types of structure can easily be studied independently
158
since they exhibit clearly different diffraction patterns. Not all of our syntheses result in a mixture
159
of α-NaYF4and β-NaYF4nanoparticles - we focused our work on β-NaYF4nanorods as this phase
160
provides the interesting optical properties. As previously mentioned, the β-NaYF4NPs can adopt three
161
different crystalline structures, with space groups depending on the synthesis parameters known to be
162
P63/m, P6 and P62m (see Fig.3) [26]. The main difference between the powder diffraction patterns
163
lies in an extra peak from the (001) planes for the P6 and P62m compared with the P63/m patterns at
164
2θ = 11.70◦in our experimental conditions. The intensity of this peak is very low, estimated around 2%
165
of the maximum diffraction peak intensity and below 0.1% respectively for P6 and P62m. This small
166
difference is usually not visible in XRPD done with a usual laboratory diffractometer and was at the
167
origin of long discussions in the literature [13,14]. The P6 and P-62m can only be distinguished by a
168
quantitative analysis of the peak intensities. A synchrotron facility is required to properly determine
169
the symmetry of NaYF4NPs.
170
For the β-NaYF4NRs, among the thirteen studied samples, only one of them presents a detectable
171
specific peak of the P6 or P62m structure. Furthermore, the intensity of this peak is very low (0.1% of
172
the maximum intensity) indicating that only a negligible portion or region of the particles was obtained
173
with this structure. For these reasons, only the P63/m structure was considered in the following for
174
our NPs.
175
After the phase identification, the Fullprof software [29,30] was used in profile matching mode
176
with a constant scale factor in order to perform a microstructural analysis. The XRPD patterns were
177
fitted with a Thompson-Cox-Hastings function [31] (a modified pseudo-Voigt function) to extract, for
178
each phase (α and/or β-NaYF4), the cell parameters and the width and breadth (full width at half
Figure 3. NaYF4nanoparticles (a) TEM image with small cubes (α-NaYF4) big nanorods (β-NaYF4) (b) typical X-Ray pattern of these particles (c) TEM NPs sizes S (L = lenght, D = diameter) and (d) cell parameter dependences vs Gd nominal doping with blue triangles and red squares for the main set of cell parameters of each batch and green stars and green circles for the second set of cell parameters
maximum FWHM and integral breadth IB) of the Bragg peaks. Our study focuses on profile fitting
180
and diffraction line broadening analysis. As said previously, the particles are doped with a constant
181
nominal concentration of ytterbium (18 mol %) and erbium (2%) and we only changed the gadolinium
182
concentration (from 0% to 60%). On the contrary to EDX focusing on single or few NPs, XRPD gives a
183
global and averaged analysis of the sample.
184
Fig.3.d presents the evolution of the cell parameters with the nominal gadolinium content of the
185
β-NaYF4phase. In some samples (NR03, NR 04 and NR06), two β-NaYF4phases are identified, a main
186
peak is observed at the expected position and a second one slightly shifted (shoulder or separated
187
peak, associated to other set of cell parameters shown in Fig. 3.d with a green star or circle). It is not
188
possible to associate the two phases observed here with the two populations previously observed with
189
the EDX. However, the two results are similar and result reinforce themselves. Moreover, both sets
190
present in parallel a linear dependence with the amount of gadolinium (even with the poor statistic
191
of the second group). The second set of cell parameters cannot be explained by a population with a
192
higher gadolinium concentration as observed previously. Yet, the linear dependency is expected due
193
to the higher ionic radius of the gadolinium compared to yttrium.
194
3.4. Microstructural analysis
195
For all the 13 studied samples, all XRPD patterns exhibit peaks broader than the instrumental
196
resolution (typically the FWHM for the samples was above 0.050◦2θ to be compared with 0.029◦2θ for
197
the LaB6standard pattern). This broadening is known to be due to size effect and/or microconstrain
198
in the system. From our previous fit, the shape factors (φ) can be defined by φ = IBvo/FW HMvo
199
with IBvothe observed integral breath (IB) and the observed Full Width at Half-Maximum (FWHM).
200
The Lorentzian and Gaussian limits for the shape factors are respectively φ = 2/π ≈ 0.6366 and
201
φ=2(logepi(2))1/2 ≈0.93949 [32]. Shape factor with φ<0.6366 and φ>0.9394 can be referred as super
Lorentzian and super Gaussian respectively [32]. Otherwise, it implies that the profile is a convolution
203
of both shapes and justifies the use of a pseudo-Voigt.
204
It is well admitted now that, for small geometrical effects of a single line instrument, the
205
instrumental profile is approximately Lorentzian, whereas the profile arising from lattice strain is more
206
Gaussian [33,34]. The broadening due to defaults or small crystallite size depends respectively on
207
their nature of the shape and the size distribution of the crystallites, and is assumed to be Lorenztian.
208
These components can be taken as Voigtian, the Lorentzian and Gaussian parts are the limiting cases.
209
If two or more reflections are available, size and strain effects can be determined from the variation of
210
Lorentzian and Gaussian contributions in the IB depending on the hkl Miller indices [35].
211
We followed the procedure recommended by Langford [32], computing the FWHM and IB of a
212
pseudo-Voigt profile from the broadened profile to give the shape factor, calculating the breadths of
213
the constituent profiles corrected by the instrumental broadening and analyzing the Williamson-Hall
214
[36] and Halder-Wagner [37,38] plots. The empirical procedure derived by de Keijser et al.[35] for
215
calculating the Lorentzian and Gaussian components (betaL, betaG) and the integral breadth (IB) has
216
been used in the Fullprof software.
217
The figure4.a presents the dependence of the shape factor for four typical samples (NR 04-07-09-10)
218
and the most different one (NR13), all the peaks show a shape factor between Gaussian and Lorentzian
219
limits. The shape factor may not correlated with the Gd concentration (Fig4.b) To understand
220
the origin of the broadening of our peaks, possibly due to both size and microstrain contribution,
221
the Halder-Wagner method [37,38] is recommended with such profile parameters instead of a
222
Williamson-Hall approach [36], as the peaks have not a pure Lorentzian shape. Note that the fit
223
is not so dependent on the 2θ range, even if Halder-Wagner plot insists on the small 2θ values (however
224
the most intense peaks).
225
Figure 4.(a) Shape factor for each peak of four typical samples (NR04, NR07, NR09, NR10) and the most different sample (NR13) (b) Mean shape factor versus the expected gadolinium concentration
TEM size (nm) AR Gd y=ax+b shape Crystallite microstrain L D (mole %) a b factor size (nm)
NR01 835 113 7.4 0 1.16 1.69 0.89 85 2.5e-4 NR02 1390 234 5.9 0 0.92 0.42 0.82 108 1.3e-4 NR03 718 108 6.6 5 1.35 0.29 0.77 74 1e-4 NR04 935 160 5.8 5 0.98 0.46 0.83 102 1.35e-4 NR05 375 70 5.4 15 1.69 0.79 0.81 59 1.7e-4 NR06 465 70 6.6 15 1.44 2.9 0.76 69 3.4e-4 NR07 640 100 6.4 15 1.3 0.8 0.81 77 1.8e-4 NR08 400 55 7.2 30 2.01 0.36 0.8 50 1.2e-4 NR09 156 62 2.5 30 2.01 -0.21 0.73 50 n.s. NR10 130 70 1.9 30 2.04 0.53 0.77 49 1.5e-4 NR11 260 55 4.7 30 2.21 1.08 0.80 45 2e-4 NR12 137 45 3 45 2.83 0.72 0.77 35 1.7e-4 NR13 60 45 1.3 60 3.9 -6 0.78 26 n.s.
Table 4.Main parameters of the studied NPs (with L for Length, D for Diameter, AR for Aspect Ratio) and the parameters from the Halder-Wagner graph with the apparent size and microstrain obtained for each of them. Here only the expected gadolinium concentration is given. (n.s. negative microstrain even if the value is very close to zero)
To distinguish between size and microstrain respective contributions, the Halder-Wagner equation
226
is written as(IB∗/d∗)2= IB∗/(d∗)2. By plotting this equation a linear behavior is observed for all
227
our samples (Fig. 5). The intercept of the linear regression in the Halder-Wagner plot is related to
228
the importance of microstrain in the material and, on the other hand, the slope is related to a mean
229
apparent size (in volume) of the NPs.
230
Figure 5.Halder-Wagner plot for a typical sample
In Fig.5, here for NR08, a clear linear regression is observed, with an origin close to zero. This
231
behavior is common to all our synthesized NPs, as summarized in table4. Whatever the sample the
232
microstrains are close to zero. For the rest of the study, the broadening of the Bragg peaks is then
233
considered to be the broadening of a size effect only, and the microstrain effect can be neglected. One
234
can also notice that the characteristic size of the NPs obtained from the Halder-Wagner plot is smaller
235
that the one obtained by TEM imaging. In first approximation, it appears that the size obtained by
236
XRD is close to the diameter of the NPs observed by TEM. This lead us to study more carefully the
237
crystallinity of our NPs to understand the meaning of this characteristic size.
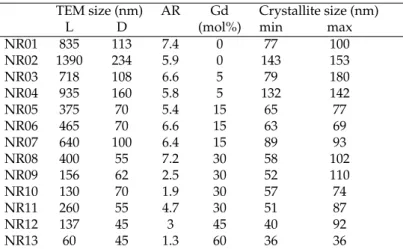
TEM size (nm) AR Gd Crystallite size (nm) L D (mol%) min max NR01 835 113 7.4 0 77 100 NR02 1390 234 5.9 0 143 153 NR03 718 108 6.6 5 79 180 NR04 935 160 5.8 5 132 142 NR05 375 70 5.4 15 65 77 NR06 465 70 6.6 15 63 69 NR07 640 100 6.4 15 89 93 NR08 400 55 7.2 30 58 102 NR09 156 62 2.5 30 52 110 NR10 130 70 1.9 30 57 74 NR11 260 55 4.7 30 51 87 NR12 137 45 3 45 40 92 NR13 60 45 1.3 60 36 36
Table 5. Main parameters of the studied NPs (with L for Length, D for Diameter, AR for Aspect Ratio) and the apparent size obtained by the anisotropic model. Here only the nominal gadolinium concentration is given.
The previous observation was assuming an isotropic NPs shape, supposed to be spherical. Now
239
a Scherrer-type analysis was used, where only the Lorentzian contribution is considered for each
240
individual reflection in order to take into account eventual anisotropic broadening, to obtain the size
241
of the crystallite, a needle-like model was applied - with a main axis along the c axis or [OOl] direction.
242
Remember that by this method it is at best a mean value of the size of the coherent domains of a
243
supposedly unimodal distribution of crystallites which is obtained for each (hkl) Bragg peak.
244
From this analysis, the three dimensions of the crystallites in our NPs can be extracted. All of them
245
present a longer length along the [OOl] direction and a smaller size in the corresponding orthogonal
246
[hk0] directions. Moreover, in most cases, the length along this direction [hk0] is slightly smaller than
247
the apparent size observed by TEM. We summarized the crystallite sizes in the table5with again the
248
apparent size for an easier comparison.
249
As previously said, the smallest length of the crystallites is associated to the directions orthogonal
250
to c-axis. Moreover, for NPs with a diameter below 100 nm, this length is almost always slightly
251
smaller of few nanometers than the diameter of the NPs. This fact was explained with the HRTEM
252
observation. In Fig.6.a or b, we observed an amorphous phase or a less crystallized shell around the
253
NPs. Another observation, more surprising from our point of view, is the possibility to have a well
254
crystallized phase in an orthogonal direction surrounding the core of the NPs. The inset of Fig.6.a
255
shows the FFT of the area delimited by the dotted green line. This FFT presents a rectangular signal
256
characteristic from an hexagonal structure seen orthogonally of the c-axis. Even though the NPs in Fig.
257
6.c is a rod well defined, the FFT of the area delimited by the continuous red line is characteristic from
258
an hexagonal phase through the c-axis. Note that the crystallinity of the NPs presented is not altered
259
by the electron beam of the TEM.
260
This observation is important if we want to analyze the luminescence of the NPs. It is well
261
known that lanthanide ions have a specific luminescence correlated with their local environment. For
262
a structure like P63/m, the doping ions have access to only one type of site as mentioned in table
263
2. The luminescence and in particular the polarized properties will be depending of this site (here
264
C23h)[28]. But if the crystallinity of the NPs is not good meaning polycrystallines nanorods instead
265
of monocrystalline and the lanthanide-site are not well aligned with a well-defined c-axis along the
266
whole rod, the optical properties will be affected starting with a reduction of the polarization degree.
267
Moreover, for singles NPs studies, due to statistical variation from one NP to another, it will be difficult
268
to analyze the optical properties.
Figure 6. (a-c) HRTEM of NPs with below the FFT of the indicate area (a) NR09 with a typical FFT orthogonal to the c-axis (b) NR13 with a typical FFT parallel to the c-axis (c) NR11 with a FFT characteristic from an hexagonal phase trough the c-axis but observed orthogonally to the c-axis. (d) HRTEM of a NR06 with various defects below same image filtered with false color.
4. Conclusion
270
Many works have reported the synthesis, optical properties and application of Na(Gd)YF4:Yb, Er
271
nanoparticles. The large interest for this systems comes both from their highly appealing emission
272
properties, and the ability to synthesis particles with different size and shapes. In particular, very nice
273
facetted nanorods can be obtained with adjustable aspect ratio playing on the particles composition
274
such as some Gd3+ions in substitution to Y3+. Nevertheless, characterizations of polarized emission
275
from single nanorods evidence that the particles are not monocrystals, which motivated this study to
276
get a deeper insight in the particles microstructure. This work has been done using TEM and XRD
277
analysis on a set of 13 samples obtained under various conditions. We could show that in a given
278
batch of synthesis, and focusing on particles with the β-NaYF4structure, different populations of
279
particles may coexist with different size and shape, but also with strong deviations from the nominal
280
composition. XRPD analysis using the Halder-Wagner approach, combined with HRTEM point
281
out an anisotropic polycrystalline structure of the nanorods with important local variations of the
282
crystallites orientations. This is clearly at the origin of the polarization spectra, which is very sensitive
283
to crystallites orientation.
284
As NaYF4NPs are now widely used for their interesting optical properties, these observations
285
show that an exhaustive structural and chemical analysis is compulsory in the aim to understand and
286
optimize this system for the targeted applications.
287
Author Contributions:Conceptualization, Godefroy Leménager and Sandrine Tusseau-Nenez; Data curation,
288
Godefroy Leménager and Sandrine Tusseau-Nenez; Formal analysis, Godefroy Leménager and Sandrine
289
Tusseau-Nenez; Funding acquisition, Thierry Gacoin; Investigation, Godefroy Leménager; Methodology, Godefroy
290
Leménager and Sandrine Tusseau-Nenez; Project administration, Godefroy Leménager; Resources, Godefroy
291
Leménager, Sandrine Tusseau-Nenez, Maud Thiriet, Pierre-Eugène Coulon, Khalid Lahlil, Eric Larquet and
292
Thierry Gacoin; Software, Sandrine Tusseau-Nenez; Supervision, Godefroy Leménager; Validation, Godefroy
293
Leménager, Sandrine Tusseau-Nenez and Thierry Gacoin; Visualization, Godefroy Leménager; Writing – original
294
draft, Godefroy Leménager and Sandrine Tusseau-Nenez; Writing – review editing, Godefroy Leménager,
295
Sandrine Tusseau-Nenez and Thierry Gacoin.
296
Funding:Funding for this project was provided by the French National Research Agency in the frame-work of
297
the FiPlaNT project (ANR-12-BS10-012).
This work was supported by the French ANR research programm "Investissements d’avenir"
299
(ANR-10-EQPX-50).
300
Acknowledgments:We acknowledge the European Synchrotron Radiation Facility for provision of synchrotron
301
radiation facilities and we would like to thank Adeline Adam, Lucio Martinelli and Isabelle Maurin for the help
302
during the experiment.
303
Conflicts of Interest:The authors declare no conflict of interest.
304
References
305
1. Li, C.; Quan, Z.; Yang, J.; Yang, P.; Lin, J. Highly Uniform and Monodisperse β-NaYF4:Ln3+ (Ln = Eu, Tb,
306
Yb/Er, and Yb/Tm) Hexagonal Microprism Crystals Hydrothermal Synthesis and Luminescent Properties.
307
Inorganic Chemistry 2007, 46, 6329–6337.
308
2. Zhou, J.; Chen, G.; Zhu, Y.; Huo, L.; Mao, W.; Zou, D.; Sun, X.; Wu, E.; Zeng, H.; Zhang, J.; Zhang, L.; Qiu,
309
J.; Xu, S. Intense multiphoton upconversion of Yb3+–Tm3+ doped β-NaYF4 individual nanocrystals by
310
saturation excitation. Journal of Materials Chemistry C 2014, 3, 364–369.
311
3. Liang, X.; Wang, X.; Zhuang, J.; Peng, Q.; Li, Y. Synthesis of NaYF4 Nanocrystals with Predictable Phase
312
and Shape. Advanced Functional Materials 2007, 17, 2757–2765. doi:10.1002/adfm.200600807.
313
4. Shi, F.; Zhao, Y. Sub-10 nm and monodisperse β-NaYF4:Yb,Tm,Gd nanocrystals with intense ultraviolet
314
upconversion luminescence. Journal of Materials Chemistry C 2014, 2, 2198–2203. doi:10.1039/C3TC32303J.
315
5. Wang, F.; Han, Y.; Lim, C.S.; Lu, Y.; Wang, J.; Xu, J.; Chen, H.; Zhang, C.; Hong, M.; Liu, X.
316
Simultaneous phase and size control of upconversion nanocrystals through lanthanide doping. Nature
317
2010, 463, 1061–1065. doi:10.1038/nature08777.
318
6. Zhang, Y.; Huang, L.; Liu, X. Unraveling Epitaxial Habits in the NaLnF4 System for Color
319
Multiplexing at the Single-Particle Level. Angewandte Chemie International Edition 2016, 55, 5718–5722.
320
doi:10.1002/anie.201511626.
321
7. Vetrone, F.; Naccache, R.; Zamarrón, A.; Juarranz de la Fuente, A.; Sanz-Rodríguez, F.; Martinez Maestro, L.;
322
Martín Rodriguez, E.; Jaque, D.; García Solé, J.; Capobianco, J.A. Temperature Sensing Using Fluorescent
323
Nanothermometers. ACS Nano 2010, 4, 3254–3258. doi:10.1021/nn100244a.
324
8. Brites, C.D.S.; Lima, P.P.; Silva, N.J.O.; Millán, A.; Amaral, V.S.; Palacio, F.; Carlos, L.D. Lanthanide-based
325
luminescent molecular thermometers 2011. 35, 1177–1183. doi:10.1039/C0NJ01010C.
326
9. Rodríguez-Sevilla, P.; Zhang, Y.; de Sousa, N.; Marqués, M.I.; Sanz-Rodríguez, F.; Jaque, D.; Liu, X.;
327
Haro-González, P. Optical Torques on Upconverting Particles for Intracellular Microrheometry. Nano
328
Letters 2016. doi:10.1021/acs.nanolett.6b04583.
329
10. Wang, L.; Li, Y. Na(Y1.5Na0.5)F6 Single-Crystal Nanorods as Multicolor Luminescent Materials. Nano
330
Letters 2006, 6. doi:10.1021/nl060684u.
331
11. Zhang, Y.; Zhang, L.; Deng, R.; Tian, J.; Zong, Y.; Jin, D.; Liu, X. Multicolor Barcoding in a Single
332
Upconversion Crystal. Journal of the American Chemical Society 2014, 136, 4893–4896. doi:10.1021/ja5013646.
333
12. Binnemans, K. Interpretation of europium(III) spectra. Coordination Chemistry Reviews 2015, 295, 1–45.
334
doi:10.1016/j.ccr.2015.02.015.
335
13. Tu, D.; Liu, Y.; Zhu, H.; Li, R.; Liu, L.; Chen, X. Breakdown of Crystallographic Site Symmetry
336
in Lanthanide-Doped NaYF4 Crystals. Angewandte Chemie International Edition 2013, 52, 1128–1133.
337
doi:10.1002/anie.201208218.
338
14. Karbowiak, M.; Cichos, J.; Rudowicz, C. Spectroscopic determination of site symmetry and space group in
339
lanthanide-doped crystals: Resolving intricate symmetry aspects for β-NaLnF4. Polyhedron 2016, 105, 42–48.
340
doi:10.1016/j.poly.2015.11.044.
341
15. Dinic, I.Z.; Mancic, L.T.; Rabanal, M.E.; Yamamoto, K.; Ohara, S.; Tamura, S.; Koji, T.; Costa, A.M.L.M.;
342
Marinkovic, B.A.; Milosevic, O.B. Compositional and structural dependence of up-converting rare earth
343
fluorides obtained through EDTA assisted hydro/solvothermal synthesis. Advanced Powder Technology
344
2016. doi:10.1016/j.apt.2016.09.021.
345
16. Szefczyk, B.; Roszak, R.; Roszak, S. Structure of the hexagonal NaYF4 phase from first-principles molecular
346
dynamics. RSC Adv 2014, 4, 22526–22535. doi:10.1039/C4RA00211C.
17. Hudry, D.; Abeykoon, A.M.M.; Dooryhee, E.; Nykypanchuk, D.; Dickerson, J.H. Probing the Crystal
348
Structure and Formation Mechanism of Lanthanide-Doped Upconverting Nanocrystals. Chemistry of
349
Materials 2016, 28, 8752–8763. doi:10.1021/acs.chemmater.6b04140.
350
18. Chaudan, E.; Kim, J.; Tusseau-Nenez, S.; Goldner, P.; Malta, O.L.; Peretti, J.; Gacoin, T. Polarized
351
Luminescence of Anisotropic LaPO4:Eu Nanocrystal Polymorphs. Journal of the American Chemical Society
352
2018, 140, 9512–9517. doi:10.1021/jacs.8b03983.
353
19. Shalav, A.; Richards, B.S.; Trupke, T.; Krämer, K.W.; Güdel, H.U. Application of NaYF4:Er3+ up-converting
354
phosphors for enhanced near-infrared silicon solar cell response. Applied Physics Letters 2005, 86, 013505.
355
doi:10.1063/1.1844592.
356
20. Wen, S.; Zhou, J.; Zheng, K.; Bednarkiewicz, A.; Liu, X.; Jin, D. Advances in highly doped upconversion
357
nanoparticles. Nature communications 2018, 9, 2415.
358
21. Balabhadra, S.; Debasu, M.L.; Brites, C.D.; Ferreira, R.A.; Carlos, L.D. Upconverting nanoparticles working
359
as primary thermometers in different media. The Journal of Physical Chemistry C 2017, 121, 13962–13968.
360
22. Zhou, J.; Liu, Q.; Feng, W.; Sun, Y.; Li, F. Upconversion luminescent materials: advances and applications.
361
Chemical reviews 2014, 115, 395–465.
362
23. Wang, L.; Li, Y. Na (Y1. 5Na0. 5) F6 single-crystal nanorods as multicolor luminescent materials. Nano
363
letters 2006, 6, 1645–1649.
364
24. Wang, F.; Han, Y.; Lim, C.S.; Lu, Y.; Wang, J.; Xu, J.; Chen, H.; Zhang, C.; Hong, M.; Liu, X. Simultaneous
365
phase and size control of upconversion nanocrystals through lanthanide doping. nature 2010, 463, 1061.
366
25. Gražulis, S.; Chateigner, D.; Downs, R.T.; Yokochi, A.F.T.; Quirós, M.; Lutterotti, L.; Manakova, E.; Butkus,
367
J.; Moeck, P.; Le Bail, A. Crystallography Open Database – an open-access collection of crystal structures.
368
Journal of Applied Crystallography 2009, 42, 726–729. doi:10.1107/S0021889809016690.
369
26. Grzechnik, A.; Bouvier, P.; Mezouar, M.; Mathews, M.D.; Tyagi, A.K.; Köhler, J. Hexagonal Na1.5Y1.5F6 at
370
High Pressures. Journal of Solid State Chemistry 2002, 165, 159–164. doi:10.1006/jssc.2001.9525.
371
27. Roy, D.M.; Roy, R. Controlled Massively Defective Crystalline Solutions with the Fluorite Structure. Journal
372
of The Electrochemical Society 1964, 111, 421–429. doi:10.1149/1.2426145.
373
28. Górller-Walrand, C.; Binnemans, K. Chapter 155 Rationalization of crystal-field parametrization; Elsevier,
374
1996; Vol. 23, pp. 121–283.
375
29. Rodríguez-Carvajal, J. Recent advances in magnetic structure determination by neutron powder diffraction.
376
Physica B: Condensed Matter 1993, 192, 55–69. doi:10.1016/0921-4526(93)90108-I.
377
30. Rodríguez-Carvajal, J. Recent developments of the program FULLPROF. Commission on powder diffraction
378
(IUCr). Newsletter 2001, 26, 12–19.
379
31. Thompson, P.; Cox, D.E.; Hastings, J.B. Rietveld refinement of Debye–Scherrer synchrotron X-ray data
380
from Al2O3. Journal of Applied Crystallography 1987, 20, 79–83. doi:10.1107/S0021889887087090.
381
32. Langford, J.I. A rapid method for analysing the breadths of diffraction and spectral lines using the Voigt
382
function. Journal of Applied Crystallography 1978, 11, 10–14. doi:10.1107/S0021889878012601.
383
33. Langford, J.I.; Wilson, A.J.C. Scherrer after sixty years: A survey and some new results in the determination
384
of crystallite size. Journal of Applied Crystallography 1978, 11, 102–113. doi:10.1107/S0021889878012844.
385
34. Guinier, A. X-ray Diffraction in Crystals, Imperfect Crystals, and Amorphous Bodies; Courier Corporation, 1994.
386
35. de Keijser, T.H.; Langford, J.I.; Mittemeijer, E.J.; Vogels, A.B.P. Use of the Voigt function in a single-line
387
method for the analysis of X-ray diffraction line broadening. Journal of Applied Crystallography 1982,
388
15, 308–314. doi:10.1107/S0021889882012035.
389
36. Williamson, G.K.; Hall, W.H. X-ray line broadening from filed aluminium and wolfram. Acta Metallurgica
390
1953, 1, 22–31. doi:10.1016/0001-6160(53)90006-6.
391
37. Halder, N.C.; Wagner, C.N.J. Analysis of the Broadening of Powder Pattern Peaks Using Variance, Integral
392
Breadth, and Fourier Coefficients of the Line Profile. In Advances in X-Ray Analysis; Springer, Boston, MA,
393
1966; pp. 91–102.
394
38. Halder, N.C.; Wagner, C.N.J. Separation of particle size and lattice strain in integral breadth measurements.
395
Acta Crystallographica 1966, 20, 312–313. doi:10.1107/S0365110X66000628.
396
c
2019 by the authors. Submitted to Nanomaterials for possible open access publication
397
under the terms and conditions of the Creative Commons Attribution (CC BY) license
398
(http://creativecommons.org/licenses/by/4.0/).