HAL Id: tel-00672940
https://tel.archives-ouvertes.fr/tel-00672940
Submitted on 22 Feb 2012HAL is a multi-disciplinary open access archive for the deposit and dissemination of sci-entific research documents, whether they are pub-lished or not. The documents may come from teaching and research institutions in France or abroad, or from public or private research centers.
L’archive ouverte pluridisciplinaire HAL, est destinée au dépôt et à la diffusion de documents scientifiques de niveau recherche, publiés ou non, émanant des établissements d’enseignement et de recherche français ou étrangers, des laboratoires publics ou privés.
Habilitation à diriger des recherches. Debregeas Georges
Georges Debregeas
To cite this version:
Georges Debregeas. Habilitation à diriger des recherches. Debregeas Georges. Biophysique [physics.bio-ph]. Université Pierre et Marie Curie - Paris VI, 2010. �tel-00672940�
1
Université Pierre et Marie Curie
Paris
HABILITATION A DIRIGER DES RECHERCHES
GEORGES DEBREGEAS
JURY :
Mme Martine Ben Amar
Mme Isabelle Cantat (rapporteur)
Mme Christiane Caroli
M. Antoine Chateauminois (rapporteur)
M. Jean-Pierre Munch
M. Olivier Pouliquen (rapporteur)
Laboratoire de Physique Statistique - CNRS/ENS/UPMC UMR 8550 24, rue Lhomond 75231 Paris cedex 05
3 Résumé :
Ce travail vise à décrire la réponse mécanique de matériaux divisés tels que les mousses aqueuses et les matériaux granulaires. Ces systèmes ont un comportement de type élastique à faible déformation et plastique au-delà d’une déformation seuil. Le caractère localisé des événements de plasticité et la longue portée des interactions élastiques conduisent à des phénomènes comparables de localisation d’écoulement, d’intermittence et de vieillissement induit par le cisaillement. Nous avons cherché à les étudier au moyen d’approches expérimentales et numériques variées associant des mesures aux échelles locales et globales. Nous avons par ailleurs développé des mesures, résolues spatialement, des déformations et contraintes mécaniques aux interfaces de frottement. Nous avons notamment développé un capteur tribologique, utilisant des micro-capteurs de force de type MEMS, qui permet une mesure dynamique des contraintes à la base d’un film élastique en frottement. Ce senseur, qui constitue un analogue rudimentaire du système mécanorécepteur/peau, a été mis à profit dans le cadre d’une étude de la transduction de l’information tactile dans le toucher humain par une approche de type bio-mimétique.
Abstract :
This work aims at describing the mechanical response of divided materials such as aqueous foams and granular materials. These systems exhibit a solid-like behavior under moderate shear, and flow plastically beyond a threshold strain. The local nature of plastic events and the long range elastic interactions are responsible for the existence of characteristic mechanisms such as strain localization, intermittency or strain-induced aging. We have probed them using various experimental and numerical approaches that combine local and global measurements. We have also developed spatially resolved measurements of interfacial deformations at frictional joints. Among them, we have developed a tribological sensor, based on the use of MEMS micro-force sensors, which allows one to monitor the friction-induced stress at the bottom of a thin elastic film. This sensor, which provides a rudimentary analogue of the mechanoreceptor/skin system, was used to study the transduction of tactile information in human touch, through a bio-mimetic approach.
4 Sommaire Curriculum vitae ... 5 Activité de recherche ... 6 Introduction ... 6
Thème 1 : Plasticité et écoulement dans les milieux divisés (Empilements granulaires et mousses aqueuses) ... 8
Thème 2 : Micro-plasticité dans les milieux granulaires... 12
Thème 3 : Processus dissipatifs locaux dans les mousses aqueuses ... 15
Thème 4 : Mécanique du contact et frottement solide ... 17
Thème 5 : Approche biomimétique de la perception tactile... 20
Projet de recherche ... 24
Publications, conférences et seminaires ... 29
Encadrement et enseignement. ... 32
5
CURRICULUM VITAE
Georges Debrégeas
Chargé de Recherche de 1ère classeLaboratoire de Physique Statistique CNRS/ENS/UPMC UMR 8550 24, rue Lhomond 75231 Paris cedex 05
+ 33 1 44 32 35 90 / + 33 1 44 32 34 33 / georges.debregeas@lps.ens.fr http://www.lps.ens.fr/recherche/systemes-biologiques-integres
Né le 11 janvier 1971 - nationalité française
Formation universitaire
Doctorat de Physique, Université Paris 6 - 1997 DEA de Physique des Solides, Paris 6 - 1994 Diplômé de l’Ecole Polytechnique - 1993
Expérience professionnelle
CR au CNRS depuis Janvier 1999
Laboratoire de Physique Statistique - ENS, Paris, 2005-2009
Laboratoire des Fluides Organisés, Collège de France, Paris, 2002-2005 Institut Charles Sadron, Strasbourg, 1999-2002
Grainger Postdoctoral Fellow, James Frank Institute, University of Chicago, 1997-1999 Thèse de physique au laboratoire PCC, Institut Curie, Paris, 1994-1997
Principaux thèmes scientifiques
• Physique de la perception tactile.
• Mécanique du frottement et du contact solides.
• Rhéologie des matériaux divisés (milieux granulaires, mousses, colloïdes, etc.) • Dynamique des réseaux de forces dans les empilements granulaires
• Hydrodynamique des films minces. • Mouillage et capillarité.
6
ACTIVITE DE RECHERCHE
INTRODUCTION
J’ai effectuée ma thèse au laboratoire de Physico-Chimie de l’Institut Curie, sous la direction de Françoise Brochard Wyart (94-97). A la suite de cette thèse, qui portait sur l’hydrodynamique des films minces, j’ai effectué un stage post-doctoral au James Frank Institute, à l’Université de Chicago, dans l’équipe de Heinrich Jaeger et Sidney Nagel (97-98). J’y ai étudié l’écoulement de milieux granulaires par imagerie par résonance magnétique (IRM), tomographie X et particle image
velocimetry (PIV). Ce travail expérimental a permis d’établir l’existence d’un phénomène de
localisation des écoulements (bande de cisaillement) et de mesurer les profils d’écoulement en géométrie de Couette 3D.
Recruté au CNRS, j’ai rejoint en Janvier 1999 l’équipe de Jean-Marc di Meglio à l’Institut Charles Sadron à Strasbourg. J’ai développé des expériences d’imagerie sur des mousses aqueuses confinées entre deux plaques parallèles sous cisaillement. L’analyse de la forme des bulles et de leur mouvement a permis de comprendre certains aspects de la rhéologie complexe de ces matériaux et en particulier le phénomène de localisation. Ce travail expérimental s’est doublé d’une simulation numérique permettant de reproduire la plupart des observations expérimentales. Un modèle mécano-statistique d’écoulement a été proposé permettant de relier la cinématique de l’écoulement à la dynamique de fluctuations des contraintes au sein du matériau. J’ai par ailleurs développé plusieurs expériences pour étudier la dynamique d’évolution des contraintes au sein de systèmes granulaires ou colloïdaux soumis à de faibles sollicitations mécaniques. Ces expériences utilisaient la diffusion multiple de la lumière (DWS) mais aussi la tomographie X (expériences menées lors d’un séjour de deux mois à l’Université de Canberra, Australie). Une large part de ces travaux a constitué la thèse d’Alexandre Kabla soutenue en 2003.
Fin 2002, j’ai rejoint le Laboratoire des Fluides Organisés (LFO), dirigé par Pierre-Gilles de Gennes, au Collège de France. J’ai mis au point, dans le cadre de la thèse de Sébastien Besson, une expérience originale de mesure des propriétés adhésives de deux bulles de savon en contact. Ces mesures à l’échelle de la bulle ont permis de comprendre le comportement rhéologique de mousses aqueuses macroscopiques sous cisaillement rapide. J’ai initié par ailleurs un programme de recherche sur la mécanique du contact et le frottement solide dont l’objectif était d’obtenir des mesures mécaniques résolues spatialement à l’interface de frottement. Alexis Prevost, qui avait été recruté en 2003 au LFO dans l’équipe de Liliane Léger, m’a rejoint sur ce projet.
Lors de la fermeture du LFO, nous avons poursuivi ce travail au sein de l’équipe qui s’est formée en 2005 au Laboratoire de Physique Statistique de l’ENS à Paris, autour de Didier Chatenay, Jérôme Robert, Alexis Prevost et moi-même. Nous avons développé une méthode d’imagerie des interfaces rugueuses permettant d’extraire optiquement les champs de déformation de l’interface. Cette technique permet, à partir de ces champs, de mesurer de manière non invasive les contraintes interfaciales en régime de frottement (thèse de Julien Scheibert).
L’une des motivations de cette étude était de comprendre les aspects physiques de la transduction de l’information tactile dans le toucher humain. La perception tactile par le doigt repose en effet sur une exploration dynamique des surfaces au cours de laquelle l’information de texture est transmise, via la peau, à des cellules mécanoréceptrices situées sous l’épiderme. Afin de comprendre ce processus, nous avons développé un capteur bio-mimétique du doigt humain fondé sur l’utilisation de micro-capteurs de force de type MEMS (Micro-Electro Mechanical Systems, développés dans le cadre d’une collaboration avec le CEA-LETI à Grenoble) permettant de simuler le fonctionnement de ces cellules mécanoréceptrices. Ces capteurs sont recouverts d’une « peau » constituée d’une membrane élastomère, puis frottés contre des substrats solides texturés. Ce travail a permis de comprendre les
7
propriétés de filtrage de l’organe tactile, et en particulier de montrer le rôle essentiel de la texturation de la peau (les empreintes digitales) pour la transduction de l’information tactile.
Je suis impliqué depuis deux ans dans un projet de création d’un nouveau laboratoire (FRE Jean Perrin, UPMC) sur le campus de Jussieu, supposé regrouper plusieurs équipes de physiciens de la région parisienne travaillant sur des thématiques à l’interface de la physique et de la biologie. L’avenir de ce projet est aujourd’hui suspendu à l’affectation de locaux et de moyens par l’UPMC.
Dans la suite du document, les principaux thèmes abordés au cours de ces 12 années (depuis la fin de ma thèse) sont décrits en quelques pages suivies d’une ou plusieurs publications significatives. Chaque thème débute par un encadré résumant les principaux résultats obtenus. Les références indiquées dans le texte (en exposant) renvoient à la liste des publications donnée en fin de chaque thème (les références bibliographiques pouvant être trouvées dans les articles insérés).
L’ensemble de mes publications est listée chronologiquement au chapitre suivant (« publications, conférences et séminaire »), chacune d’entre elle étant par ailleurs téléchargeable à l’adresse :
8
THEME 1 : PLASTICITE ET ECOULEMENT DANS LES MILIEUX DIVISES
(EMPILEMENTS GRANULAIRES ET MOUSSES AQUEUSES)
Résumé : Nous avons caractérisé de manière détaillée la dynamique d’écoulement dans un empilement 3D granulaire sous cisaillement, en géométrie de Couette cylindrique. Cet écoulement est caractérisé par l’existence d’une bande de cisaillement à la paroi du cylindre tournant. Un processus de localisation d’écoulement similaire a été démontré dans le cas d’une mousse aqueuse 2D (confinée entre deux plaques) sous cisaillement. Ce résultat a été confirmé par simulation numérique en géométrie plan parallèle.
Ce second système (mousses aqueuses 2D) nous a permis en outre de mesurer simultanément la dynamique du champ des contraintes et de plasticité au sein du matériau par une analyse de l’évolution de la structure des films liquide séparant les bulles. Nous avons ainsi pu montrer que l’instabilité de localisation résulte d’un couplage entre le champ des contraintes internes et la réponse mécanique du matériau : les évènements plastiques produisent localement un élargissement de la distribution des contraintes piégées associé à un abaissement du seuil de plasticité effectif.
Les systèmes divisés – tels que les milieux granulaires, les mousses, les émulsions concentrées – forment une classe de matériaux importante du point de vue industriel. Ils sont présents dans des domaines aussi variés que l’agro-alimentaire, l’industrie pharmaceutique, les cosmétiques ou encore les peintures. Les milieux granulaires sont également impliqués dans l’essentiel des phénomènes géologiques de surface. Pour de tels systèmes, l’énergie thermique est plusieurs ordres de grandeur inférieure à l’énergie nécessaire pour induire des réarrangements de la structure. En l’absence de contrainte externe, ils se trouvent piégés dans une configuration métastable et présentent, sous faible contrainte, un comportement de type solide élastique. Au-delà d’une contrainte seuil, des réarrangements plastiques peuvent être induits conduisant à un écoulement effectif du matériau qui présente cependant des caractéristiques très différentes de celles observées dans les liquides moléculaires. La courbe force/déformation présente ainsi un maximum (ou overshoot) qui révèle l’existence d’hétérogénéités spatiale de l’écoulement. En régime d’écoulement permanent, le signal de force montre de larges fluctuations qui sont la signature du caractère intermittent des événements de plasticité. La description de ces écoulements se heurte à la nécessité de modéliser tout à la fois les processus locaux de plasticité, dont l’échelle caractéristique est celle de la micro-structure, et les interactions élastiques de longue portée qui contrôlent la transmission des contraintes dans le matériau. D’un point de vue expérimental, il est donc impératif d’obtenir une mesure résolue à l’échelle de la micro-structure pour des écoulements macroscopiques.
A ) M I L I E U X G R A N U L A I R E S S O U S C I S A I L L E M E N T .
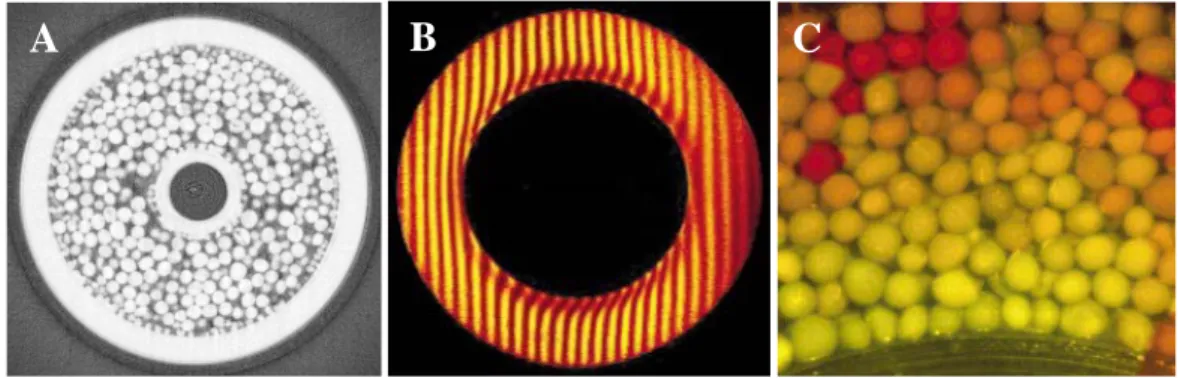
C’est dans cette optique que j’ai abordé, dans le cadre de mon stage post-doctoral, l’étude d’un écoulement granulaire tri-dimensionnel en géométrie de Couette cylindrique. J’ai fait appel à 3 techniques complémentaires – l’IRM, la tomographie X, et la PIV (particle image velocimetry) - afin d’étudier le mouvement des grains sous cisaillement lent1 (Figure 1). Ce travail a permis de caractériser quantitativement les profils d’écoulements moyens sous différentes pression de confinement, ainsi que les profils de densité granulaire. Il a permis de montrer que la largeur de la bande de cisaillement - la région subissant l’essentiel des événements plastiques - était contrôlée par la taille des grains, et relativement indépendante des autres paramètres. La localisation de l’écoulement est par ailleurs associée à une réduction de la fraction volumique granulaire dans la bande de cisaillement.
9
Figure 1: Expérience d’écoulement granulaire en cellule de Couette cylindrique. (A) image par tomographie X d’une tranche au sein de la cellule, permettant d’évaluer les profils radiaux de densité de grains. (B) Image par IRM du profil d’écoulement. La technique utilisée, dite de marquage de spin, permet d’identifier le mouvement moyen des grains se produisant dans une tranche de la cellule de Couette au cours d’un court intervalle de temps, au travers des déformations de lignes initialement parallèle. (C) image fixe extraite d’un enregistrement vidéo pris sous l’échantillon et servant à l’expérience de PIV.
Avec Christophe Josserand, j’ai proposé un modèle d’interprétation des profils d’écoulement observés fondé sur l’hypothèse d’une dynamique auto-similaire2. Ce modèle reposait sur l’observation que la longueur de corrélation des vitesses des grains semblait croître avec la distance à la paroi mobile. Ce modèle décrivait dès lors l’écoulement moyen comme résultant du mouvement intermittent de clusters de grains liés à la paroi mobile.
B ) M O U S S E S B I D I M E N S I O N N E L L E S C O N F I N E E S E T M O U S S E S N U M E R I Q U E S .
De retour en France, j’ai souhaité étendre ce travail au cas des mousses aqueuses sous cisaillement. Pour permettre une observation directe de la dynamique à l’échelle des bulles, celle-ci est confinée entre deux vitres parallèles dont l’espacement permet d’accommoder une seule couche de bulles (Figure 2A). Cette mousse bidimensionnelle est cisaillée entre deux anneaux concentriques (géométrie de Couette cylindrique). Pour réduire l’effet de friction des bulles sur les parois de confinement, nous nous sommes limités à de très faibles taux de déformation. Cette expérience nous a permis de mettre en évidence un phénomène de localisation d’écoulement très similaire à celui observé dans les systèmes granulaires : après une déformation homogène transitoire, l’essentiel de la plasticité se concentre dans une bande de cisaillement large de quelques diamètres de bulle à proximité du disque interne. Nous avons pu établir la forme précise des profils d’écoulement pour des mousses humides et sèches. Nous avons également mis en évidence l’existence de corrélations spatiales du champ des vitesses instantanées, la longueur de corrélation étant proportionnelle à la distance au disque interne3.
La grande similarité entre les comportements observés dans les milieux granulaires et les mousses sous cisaillement lent a constitué un résultat important car il laissait envisager un cadre de description commun pour ces deux systèmes. Mais le système modèle de mousse bidimensionnelle confinée offrait en outre la possibilité d’obtenir des informations au delà de ces seules mesures cinématiques : dans la limite d’écoulements quasistatiques, l’analyse de la forme des bulles permet en effet d’extraire directement le champ des contraintes au sein de la mousse à chaque instant. Par ailleurs, dans le cas de mousses sèches, les événements plastiques sont facilement identifiables puisqu’ils sont associés à une transformation topologique de la structure (processus T1, voir Figure 3A). Ce système est enfin propice à une modélisation numérique exacte. En effet, la configuration de la mousse à chaque instant correspond à la configuration minimale d’énergie de surface. Nous avons ainsi mis au point une expérience numérique de cisaillement de mousses 2D à partir d’un programme de minimisation de surface (Surface Evolver) que nous avons adapté à une situation d’écoulement sous cisaillement plan parallèle (Figure 2B). La mousse numérique possède des conditions limites périodiques dans l’une des directions, et est rigidement fixée sur ses deux autres frontières. Le cisaillement est obtenu en faisant
B
C
10
glisser ces deux murs rigides l’un par rapport à l’autre, par incrément infinitésimal. Nous avons observé là-encore l’apparition d’une bande de cisaillement le long d’une des parois après un régime transitoire de déformation uniforme de l’ordre de 1. Les caractéristiques mécaniques et d’écoulement (profil d’écoulement plastique, fluctuation des vitesses, état statistique des contraintes internes) ont montré un accord quantitatif avec les observations expérimentales réalisées en cellule de Couette4.
Figure 2 : (A) Détail d’une mousse bidimensionnelle confinée sous cisaillement de Couette. Le disque intérieur (en bas) tourne à vitesse constante, tandis que l’anneau extérieur (en haut) est fixe. Le code couleur traduit l’état de contrainte de cisaillement de chacune des bulles de l’échantillon, extraite de la structure du réseau de film, à l’instant de la prise d’image. (B) mousse numérique obtenue par minimisation de la surface totale des films, sous contrainte de volume constant dans chaque bulle. Le cisaillement de cette mousse est obtenu en déplaçant l’un des murs rigide (en rouge) de manière incrémentale. A chaque pas de temps, la structure d’équilibre de la mousse est recalculée.
Ce résultat numérique a permis de montrer que l’instabilité d’écoulement conduisant à la localisation pouvait apparaître même dans une géométrie qui garantissait l’homogénéité de la contrainte appliquée (ce qui n’est pas le cas de la géométrie de Couette cylindrique pour laquelle celle-ci décroit radialement avec la distance à la paroi du cylindre). Cette instabilité ne pouvait dès lors être expliquée que par l’existence d’un couplage entre l’écoulement plastique et une caractéristique structurelle du matériau qu’il nous fallait identifier. Dans cette optique, nous nous sommes intéressés aux distributions statistiques des contraintes piégées mesurées à l’échelle des bulles individuelles, dans différentes régions de l’échantillon. Nous avons pu montrer, dans l’expérience et la simulation numérique, que l’apparition de la bande de cisaillement s’accompagnait d’un élargissement de cette distribution dans la zone où se concentraient les événements plastiques. Cette observation était cohérente avec l’idée que l’hétérogénéité des contraintes piégées contrôle localement le seuil plastique effectif du matériau. Plus cette hétérogénéité est importante, plus le matériau est fragile c'est-à-dire susceptible de céder plastiquement en réponse à un accroissement de la contrainte globale appliquée.
Figure 3 : (A) Image d’un événement plastique au sein d’une mousse bidimensionnelle. Cet événement se traduit par un changement topologique de la structure. (B) Variation du champ des contraintes de cisaillement associée à un tel processus TI et obtenue grâce à la simulation numérique. Les couleurs bleu et rouge indiquent respectivement un abaissement et un accroissement de la contrainte de cisaillement locale.
Il restait dès lors à comprendre comment les processus plastiques successifs contrôlaient à l’inverse l’évolution des distributions de contraintes piégées dans le matériau. Pour cela, nous avons tout d’abord déterminé, grâce à la simulation numérique, la déformation de la mousse associée à un réarrangement unique (Figure 3). Nous avons montré que la symétrie quadrupolaire de cette
A
B
11
perturbation mécanique élémentaire était à l’origine d’une corrélation spatiale à temps court des évènements plastiques suivant la direction d’écoulement. Ces événements très corrélés peuvent s’identifier à une fracture qui laisse une trace structurelle sous la forme d’un plus fort désordre de contrainte associé à un élargissement des distributions. Nous avons ensuite modélisé la dynamique d’évolution à temps long du champ des contraintes en régime d’écoulement permanent en évaluant l’effet cumulés de ces multiples événements plastiques distribués à travers l’échantillon. Ce modèle mécano-statistique a permis de reproduire correctement la dynamique du champ des contraintes mesuré dans les expériences et dans les simulations à partir de la seule donnée des profils d’écoulement5,6.
Références :
1. Signatures of granular microstructure in dense shear flows. D. Mueth, G. Debregeas, G. Karczmar, P. Eng, S. Nagel & H. Jaeger, Nature 406, 385-388 (2000)
2. A self-similar model for shear flows in dense granular materials. G. Debrégeas and C. Josserand, Europhys. Lett., 52 (2), pp. 137-143 (2000)
3. Deformation and Flow of a Two-Dimensional Foam under Continuous Shear. G. Debrégeas, H. Tabuteau, and J.-M di Meglio, Phys. Rev. Lett. 87(17) 178305 (2001)
4. Local Stress Relaxation and Shear Banding in a Dry Foam under Shear. A. Kabla and G. Debrégeas, Phys. Rev. Lett. 90(25) 258303 (2003)
5. Quasi-static rheology of foams. Part 1. Oscillating strain, A. Kabla and G. Debrégeas,
Journal of Fluid Mechanics, 587 (2007), pp 23-44
6. Quasi-static rheology of foams. Part 2. Continuous shear flow, A. Kabla, J. Scheibert and G. Debrégeas, Journal of Fluid Mechanics 587 (2007), pp 45-72
letters to nature
NATURE|VOL 406|27 JULY 2000|www.nature.com 385
damage5), and is strongly model-dependent4. Tougaard’s approach3
(quantitative analysis of signal-to-background correlation) requires minimal interference of neighbouring lines across a wide spectral range, and is therefore less effective with small signals. CSC is basically non-destructive, allowing fast and convenient data collection. It enables differentiation of spectrally identical atoms at different locations. It is applicable to thicker structures than ARXPS, as the signal is not subject to increased attenuation associated with off-normal measurements. Substrate roughness, severely affecting ARXPS depth analysis by smearing the angular scale, would only have a minor effect on CSC depth profiling. The linear dependence on depth, found in the present systems, is an attractive feature of CSC. Note, however, that other systems may involve more elaborate conduction processes, possibly causing deviations from linearity. Such deviations may allow the explora-tion of addiexplora-tional characteristics of the systems, such as charge distribution and conduction mechanisms.
As a high-resolution depth-profiling method, CSC is applicable to a large variety of non-conducting layers less than about 10 nm thick. Moreover, the present results suggest applications of CSC as a contactless electrical probe, capable of direct detection of local potentials in thin overlayers. In the light of recent progress in enhancing XPS lateral resolution, CSC may be an effective tool
for studying three-dimensional nanostructures and molecular
architectures. M
Received 14 March; accepted 26 May 2000.
1. Briggs, D. & Seah, M. P. (eds) Practical Surface Analysis Vol. 1, 2nd edn (Wiley, New York, 1990). 2. Hofmann, S. in Practical Surface Analysis Vol. 1, 2nd edn (eds Briggs,D. & Seah, M. P.) 143–199
(Wiley, New York, 1990).
3. Tougaard, S. Quantitative analysis of the inelastic background in surface electron spectroscopy. Surf.
Interface Anal. 11, 453–472 (1988).
4. Tyler, B. J., Castner, D. G. & Ratner, B. D. Regularization—A stable and accurate method for generating depth profiles from angle-dependent XPS data. Surf. Interface Anal. 14, 443–450 (1989). 5. Frydman, E., Cohen, H., Maoz, R. & Sagiv, J. Monolayer damage in XPS measurements as evaluated by
independent methods. Langmuir 13, 5089–5106 (1997).
6. Seah, M. P. in Practical Surface Analysis Vol. 1, 2nd edn (eds Briggs, D. & Seah, M. P.) 541–554 (Wiley, New York, 1990).
7. Tielsch, B. J., Fulghum, J. E. & Surman, D. J. Differential charging in XPS. 2. Sample mounting and x-ray flux effects on heterogeneous samples. Surf. Interface Anal. 24, 459–468 (1996).
8. Barr, T. L. Studies in differential charging. J. Vac. Sci. Technol. A 7, 1677–1683 (1989). 9. Lewis, R. T. & Kelley, M. A. Binding energy reference in XPS of insulators. J. Electron Spectrosc. Relat.
Phenom. 20, 105–115 (1980).
10. Miller, J. D., Harris, W. C. & Zajac, G. W. Composite interface analysis using voltage contrast XPS.
Surf. Interface Anal. 20, 977–983 (1993).
11. Beamson, G. et al. Characterization of PTFE on silicon wafer tribological transfer films by XPS, imaging XPS and AFM. Surf. Interface Anal. 24, 204–210 (1996).
12. Barr, T. L. in Practical Surface Analysis Vol. 1, 2nd edn (eds Briggs, D. & Seah, M. P.) 370 (Wiley, New York, 1990).
13. Shabtai, K., Rubinstein, I., Cohen, S. & Cohen, H. High-resolution lateral differentiation using a macroscopic probe: XPS of organic monolayers on composite Au-SiO2surfaces. J. Am. Chem. Soc.
122, 4959–4962 (2000).
14. Hatzor, A. et al. Coordination-controlled self-assembled multilayers on gold. J. Am. Chem. Soc. 120, 13469–13477 (1998).
15. Moav, T. et al. Coordination-based symmetric and asymmetric bilayers on gold surfaces. Chem. Eur. J.
4, 502–507 (1998).
16. Yang, H. C. et al. Growth and characterization of metal(II) alkanebisphosphonate multilayer thin-films on gold surface. J. Am. Chem. Soc. 115, 11855–11862 (1993).
17. Hatzor, A. et al. A metal-ion coordinated hybrid multilayer. Langmuir 16, 4420–4423 (2000). 18. Umemura, Y., Yamagishi, A. & Tanaka, K.-I. X-ray photoelectron spectroscopic study of alternately
layered zirconium and hafnium phosphate thin films on silicon substrates. Bull. Chem. Soc. Jpn 70, 2399–2403 (1997).
Acknowledgements
This work was supported by the Israel Science Foundation, and the Tashtiot Infrastructure Program of the Israel Ministry of Science.
Correspondence and requests for materials should be addressed to I.R. (e-mail: israel.rubinstein@weizmann.ac.il). or H.C. (e-mail: cphagai@wis.weizmann.ac.il). 0.4 0.8 1.2 1.6 0 2 4 6 8 10 Zr multilayer Ce multilayer V0 (V)
Number of repeat units slope = 0.148
slope = 0.051 0
Figure 3 Plot ofV0versus overlayer thickness.V0is the total potential difference across the overlayer, and the overlayer thickness is given as the number of molecular layers.V0is derived from the low-binding-energy side of the peaks of the respective ions. Inset, the electrical analogue of the overlayer, with a simple parallel-plate capacitor and a shunt resistor. 0 0.2 0.4 0.6 0.8 1 1.2 -5 -4 -3 -2 -1 0 1 2 4 6 8 10 12 V(Hf)/V(P) V(P)/V(Zr) ln[I(Hf)/I(P)] ln[I(Hf)/I(Au)] Marker position VM /V 0 0 In(intensity ratio)
Figure 4 Depth profiling with accurately positioned markers. Solid lines show the
normalized local potential of the ‘moving’ marker,VM/V0, versus marker position, for P and Hf markers in the multilayers shown in Fig. 1b and c, respectively (linear scale). Dashed lines show depth analysis via line intensities for the multilayers shown in Fig. 1c (log scale). The films with Hf(IV) in position 2 (Fig. 1c, left) displayed weak Hf signals that
required second-derivative data processing for reliable determination of the energy shifts.
...
Signaturesofgranular microstructure
in dense shear flows
Daniel M. Mueth*, Georges F. Debregeas*, Greg S. Karczmar†, Peter J. Eng‡, Sidney R. Nagel* & Heinrich M. Jaeger*
* The James Franck Institute and Department of Physics, †Radiology Department, ‡Center for Advanced Radiation Sources (CARS), University of Chicago,
5640 South Ellis Avenue, Chicago, Illinois 60637, USA
... ... ... ... ... Granular materials and ordinary fluids react differently to shear stresses. Rather than deforming uniformly, materials such as dry sand or cohesionless powders develop shear bands1–5—narrow
zones of large relative particle motion, with essentially rigid adjacent regions. Because shear bands mark areas of flow, material failure and energy dissipation, they are important in many industrial, civil engineering and geophysical processes6. They
are also relevant to lubricating fluids confined to ultrathin molecular layers7. However, detailed three-dimensional
informa-tion on moinforma-tion within a shear band, including the degree of particle rotation and interparticle slip, is lacking. Similarly, very little is known about how the microstructure of individual grains affects movement in densely packed material5. Here we combine
letters to nature
386 NATURE|VOL 406|27 JULY 2000|www.nature.com
magnetic resonance imaging, X-ray tomography and high-speed-video particle tracking to obtain the local steady-state particle velocity, rotation and packing density for shear flow in a three-dimensional Couette geometry. We find that key characteristics of the granular microstructure determine the shape of the velocity profile.
In order to probe the role of microstructure inside the narrow granular shear zone, independent determinations are required of the velocity and density profiles with spatial resolution well below the size of individual particles. Non-invasive measurements of this type so far have been limited to two-dimensional (2D) geometries where optical tracking of all particle positions is straight-forward2,4,8–11. In a three-dimensional (3D) Couette cell, as sketched
in Fig. 1a, a steady-state shear flow can be set up by confining granular material between two concentric, vertical cylinders and turning the inner cylinder at constant velocity vwallwhile keeping the
outer wall at rest. Unlike 2D Couette cells9,10,12, where particles are
confined to a single layer with constant volume, there is a free upper surface allowing the packing density to adjust via feedback between shear-induced dilation and gravity.
The difficulty of imaging the interior has restricted studies of 3D granular Couette systems; such studies have probed only the surface (including its velocity fluctuations)13, or tracked coloured tracers in
very narrow (a few particles wide) cells14, or measured global
quantities, such as the total applied torque. Here we use magnetic resonance imaging (MRI) to obtain flow velocities from the interior of a 3D system15,16. We have used oil-rich seeds as a source of free
protons that can be traced using MRI15. Two kinds of seeds were
used to explore the role of microstructure: mustard seeds (spherical with mean diameter d = 1.8 mm) and poppy seeds (kidney-shaped
with mean diameter d = 0.8 mm). The wall friction was controlled by gluing a layer of seeds on both cylinders. Using a spin-tagging technique, horizontal slices were imaged, as sketched in Fig. 1a. In the resulting MRI image (Fig. 1b), the shear band shows up as the narrow region of deformed stripes near the inner, moving, cylinder. Imaging slices at different heights, h, we measured these deforma-tions, from which the azimuthal velocity profiles were calculated throughout the cell. Similarly, 3D X-ray tomography (Fig. 1d) allowed us to calculate packing-fraction profiles at various heights. At the transparent cell bottom, additional velocity and packing-fraction information was gathered by direct, high-speed-video particle tracking (Fig. 1c).
Before each set of measurements, the cell was run until steady state was reached (as determined by the fact that the packing density profiles became stationary). High-resolution images revealed the long-time average local displacements during a time interval,dt = 100 ms. Figure 1b represents such displacements averaged over a 17-min acquisition time. The azimuthal velocity at a given distance r from the inner wall was obtained by exploiting the cylindrical symmetry of the Couette geometry: we calculated the MRI inten-sities along a circle of radius r, Iturning(v) and Istopped(v), for the cell
turning and at rest, respectively. The position of the central peak in the cross-correlation between Iturning(v) and Istopped(v) corresponds
to the average azimuthal distance travelled by the material duringdt. This technique yielded the angle- and time-averaged radial profile of the steady-state azimuthal mass flow velocity, v(r), resolving v(r) to within 0.1 mm s−1and r to within 0.1mm. We note that this high-resolution mass flow velocity is the average velocity of all material at radius r and thus not only contains information about particle translation, but also about particle spin. This differs from the
d c
a b
h
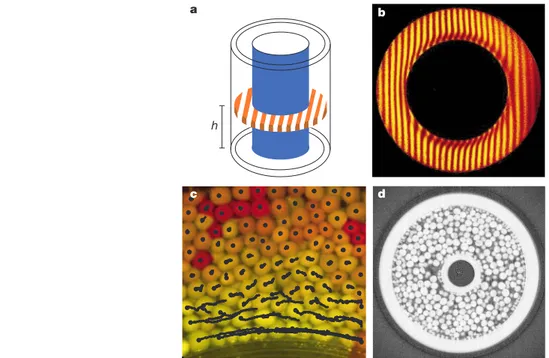
Figure 1 Non-invasive MRI, X-ray tomography and high-speed-video probes of granular
Couette flow. a, Sketch of the Couette-type shear cell consisting of two concentric cylinders with diameters 51 mm and 82 mm, and filled to a level of 60 mm. The inner cylinder was rotated at velocities 0.6 mm s−1,v
wall, 120 mm s−1. The flow velocity was measured using an MRI spin-tagging technique14,15. Before imaging, proton spins were encoded (spin-tagged) so as to display parallel stripes when imaged. Images were taken of 5-mm-thick horizontal slices at various heights,h. b, When the inner cylinder was rotated, distortion of the stripe pattern revealed the displacement of the material that occurred during the 100-ms interval between spin-tagging and imaging. 2,048 spin-tag-image steps were used to assemble each complete spin-tag-image. c, High-speed-video frame, taken at 1/1,000 s, of mustard seeds observed through the cell’s transparent bottom. To
indicate the movement history of individual particles, their centre positions over the preceding 200 frames are traced by black lines. The particle colouring reflects the magnitude of each particle’s average velocity during this 0.2-s interval: fast particles (yellow) near the inner wall appear to move smoothly, while slower particles (orange and red) display more irregular and intermittent motion. In the long-time average, measured by the MRI technique, the flow appears smooth everywhere. d, Two-dimensional, horizontal slice through the cell at half the filling height, taken from the X-ray tomography data set. Particles, in this case mustard seeds, appear bright (as do the walls of the cell). These measurements were performed at the Advanced Photon Source at Argonne National Laboratory in a Couette cell of slightly smaller size but under otherwise identical shearing conditions.
letters to nature
NATURE|VOL 406|27 JULY 2000|www.nature.com 387
average velocity of particle centres that typically is obtained by video particle-tracking techniques.
We found v(r) highly reproducible from run to run, even though on shorter timescales there are rapid velocity fluctuations from point to point within the material that, at the top and bottom boundaries, can be observed with high-speed video (Fig. 1c). Within the resolution of our measurements, v(r) for both types of seeds did not vary with height, including the regions near the top and bottom surfaces. (We note that this indicates that non-azimuthal, secondary flow was small and did not affect v(r), in accordance with tracer-bead studies13.) Apart from an overall scale
factor, we also did not detect any shear-rate dependence to the velocity profile over the entire range 5 mm s−1, vwall, 120 mm s−1
explored with MRI. (With video imaging we verified rate indepen-dence down to velocities as small as 0.6 mm s−1).
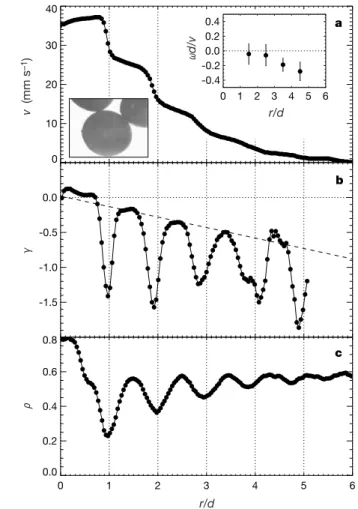
For (nearly) monodisperse smooth, spherical particles, the decay of v(r) away from the shearing wall is dominated by abrupt drops at integer multiples of r/d as shown in Fig. 2a for mustard seeds. In the normalized velocity gradient g(r); (d/v) ]v/]r (Fig. 2b) these drops appear as deep narrow valleys. They are correlated with pronounced oscillations in the packing density, r(r), which signal the presence of well defined, single-grain-wide layers near the moving wall (Fig. 2c).
(We note that the average density approaches the random close packing value at larger r in a manner that is consistent with an exponential form10.) The shear-induced layering is reminiscent of
that seen17in the collisional regime of dilute flows, but occurs here
in the high-density limit of rate-independent, frictional flow. Because the velocity drops are highly localized, we associate them with slipping at the interface between adjacent layers. Either directly from v(r) or by comparing the integrated areas of each valley in g(r) we find that across each slip zone the velocity decreases by approximately the same factor, b = 0.366 0.13.
In addition to slip between layers, MRI resolves a non-zero velocity gradient g(r) within each layer. This could be caused by either particle rotation or disorder in the layering along the radial direction. (Along the azimuthal and axial directions, particles within layers certainly show packing disorder—as can be seen from the maxima in r(r) in Figs 2c and 3c, whose values lie significantly below those for a crystalline configuration). For perfectly arranged layers, g(r) at the layer centres would be deter-mined solely by particle rotation (spin) within each layer. The presence of particles which do not lie perfectly within the layers (revealed by the non-zero values of r(r) between layers in Fig. 2c and seen directly from the tracks in Fig. 1c) reduces the gradient in the slip region and increases it at the layer centres. In the limit of complete disorder, we would expect the staircase shape of v(r) to vanish completely. Using information about the density, rc(r), and
velocity, vc(r), of the particle centres, as determined by the
high-speed-video and X-ray experiments, we find that approximately 90% of g(r) at the layer centres is due to the radial disorder. In order
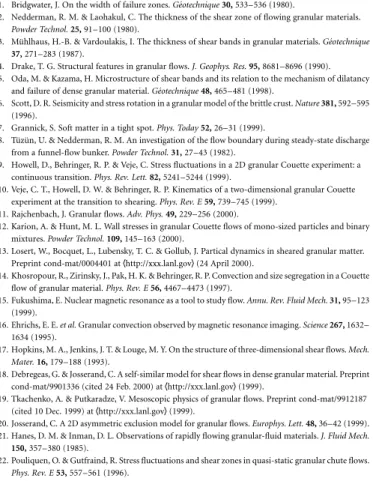
0 10 20 30 40 0 1 2 3 4 5 6 -0.4 -0.2 0.0 0.2 0.4 -1.5 -1.0 -0.5 0.0 0 1 2 3 4 5 6 r/d 0.0 0.2 0.4 0.6 0.8 a b c r/d r/d ργ v (mm s –1 ) ωd/v
Figure 2 Radial profiles of azimuthal velocity, spin and packing density for spherical
mustard seeds. a, Steady-state, angle-averaged azimuthal velocityv(r) across the shear band ath= 30 mm, halfway below the filling level. The layer of seeds glued to the inner cylinder wall extends to the dotted vertical line atr/d= 1. The lower inset shows a photograph of the seeds. The upper inset shows the normalized particle spin rate, qd/v, as a function of distance from the moving wall (where q is the angular velocity of a particle about its centre). b, Normalized velocity gradient g; (d/v)]v/]rfor the data in the main panel of a. c, Angle-averaged, steady-state radial packing density profile r(r) computed from X-ray tomography data as in Fig. 1d, measuring the volume fraction occupied by seed material. For 0,r/d, 1, the seeds glued to the wall contribute to r.
0 10 20 30 40 -1.0 -0.5 0.0 0 1 2 3 4 5 6 r/d 0.0 0.2 0.4 0.6 0.8 ργ v (mm s –1) a b c
Figure 3 Radial profiles of azimuthal velocity, spin and packing density for aspherical
poppy seeds. a, Steady-state, angle-averaged azimuthal velocityv(r) across the shear band ath= 30 mm. The inset shows a photograph of the seeds. b, Normalized velocity gradient for the data in a. c, Corresponding angle-averaged, radial packing density profile r(r) from X-ray data. For 0,r/d, 1, the seeds glued to the wall contribute to r.
letters to nature
388 NATURE|VOL 406|27 JULY 2000|www.nature.com
for the MRI and high-speed-video experiments to give the same g(r), particle spin must be considered, revealing the spin profile seen in the inset of Fig. 2a. We note that the spin is small, increasing slowly with distance from the shearing wall to a value at r/d = 4.5 of less than one full particle rotation per 13d translation.
The message of Fig. 2 is that the overall shape of v(r) across the shear band can be understood as arising from two main contribu-tions to the velocity gradient g(r): a slip contribution in the presence of layering, and a second contribution associated with radial disorder. These two pieces are distinguished by the characteristic
r-dependence they produce in v(r) on length scales larger than a
single grain. A constant slipping fraction,einterfacegslipðrÞdr ¼ 2 b,
across each interface leads (by itself) to a velocity profile with an exponential decay, v(r) = voexp(−br/d). The constant inter-layer
slip appears on a background due to radial disorder, gdisorder(r) =
−2c(r−ro)/d, that starts at rowithin the glued-on layer and increases
linearly in strength with slope 2c as indicated by the dotted line in Fig. 2b). Such linear r-dependence in g(r) results in a gaussian profile, vðrÞ ¼ voexpð2 cðr=d 2 ro=dÞ2). The sum of the two
con-tributions to g(r), after integration, leads to a product of an exponential and gaussian term for the overall, averaged velocity profile: vðrÞ ¼ voexp½2 br=d 2 cðr=d 2 ro=dÞ
2ÿ. Fits of this function
to mustard-seed data yield b = 0.366 0.13, c = 0.06 6 0.03 and
ro/d = 0.66 0.8 independent of height and shear rate.
The decomposition of g(r) allows the quantitative tracking of the slip inside the shear band for different particle types. We find a greatly reduced slip rate b when smooth spherical particles are replaced by roughened ones. More dramatic differences result from changes in the particle shape. For kidney-shaped poppy seeds we observe a comparatively smooth overall velocity profile (Fig. 3a). Much smaller modulations in g(r) (Fig. 3b) together with little layering in r(r) (Fig. 3c) indicate that interlayer slip is greatly reduced. The linear trend g(r) = −2c(r/d−ro/d) is still present,
however, and leads to the gaussian shape for v(r) seen in Fig. 4 over several orders of magnitude. These data also demonstrate explicitly that the shear rate fixed by vwall, while setting the overall scale, leaves
the shape of the profile unchanged. This allows for a collapse of all poppy-seed data for different shear rates and heights in the cell onto a single gaussian described by c = 0.116 0.02 and ro/d =−0.16 0.5.
Layering can also be suppressed and radial disorder be promoted in sphere packings if wide particle size distributions are used. We find that these, too, produce essentially gaussian velocity profiles.
From these results, the gaussian component of the velocity profile emerges as a robust, generic feature; slip, if it occurs, is seen to augment v(r) by an additional, exponential factor. In contrast to the translationally invariant slip, the explicit dependence of the gaussian on the distance from the shearing wall indicates correlations. There are several possible mechanisms for radial correlations5,9,10,18–20,
including the formation of stress chains5,9,10or particle clusters18,20,
both of which require high packing densities and the absence of slip or some degree of interlocking. However, a detailed mechanism that would explain the observed gaussian dependence does not exist at present. A successful theory must not only account for the linear increase in the magnitude of the velocity gradient with r, but also show how the gaussian shape is independent of the presence of layering. We speculate that both of these might be provided by a coupling of g(r) to the average packing fraction and its gradients (for 2D Couette systems, a coupling to the average density alone has been suggested9,10). A gaussian, then, arises naturally for a coupling
of type g(r) ~ r(ro)−r(r), considering first-order terms in r.
Because all stress-loading is driven by the seed layer glued to the inner wall, its location, ro, serves as a spatial reference point. This
argument carries over to the absence of a gaussian contribution to
v(r) in less-dense types of flow, where interlocking may be less
effective, such as rapid flows down inclines with free upper surface for which power-law forms have been reported4,15,21, or vertical
gravity-driven flows through 2D ‘pipes’, which appear to follow essentially exponential profiles2,22.
Our results show that, in this regime of high packing density and slow shearing rate, there is a direct connection between the micro-structure and the shape of the velocity profile. For equal-sized spherical particles, where considerable layering is found, a strong exponential contribution is observed. For aspherical seeds, which show no pronounced layering, the profile is almost completely described by a gaussian centred on the shearing wall. But despite the complicated nature of the grain–grain interactions, the steady-state velocity profile exhibits robust behaviour: its shape—characterized by the two length scales, l = d/b and j = d/c1/2—is found to be
independent of both height and shear-rate. M
Received 13 December 1999; accepted 7 June 2000.
1. Bridgwater, J. On the width of failure zones. Ge´otechnique 30, 533–536 (1980).
2. Nedderman, R. M. & Laohakul, C. The thickness of the shear zone of flowing granular materials.
Powder Technol. 25, 91–100 (1980).
3. Mu¨hlhaus, H.-B. & Vardoulakis, I. The thickness of shear bands in granular materials. Ge´otechnique
37, 271–283 (1987).
4. Drake, T. G. Structural features in granular flows. J. Geophys. Res. 95, 8681–8696 (1990). 5. Oda, M. & Kazama, H. Microstructure of shear bands and its relation to the mechanism of dilatancy
and failure of dense granular material. Ge´otechnique 48, 465–481 (1998).
6. Scott, D. R. Seismicity and stress rotation in a granular model of the brittle crust. Nature 381, 592–595 (1996).
7. Grannick, S. Soft matter in a tight spot. Phys. Today 52, 26–31 (1999).
8. Tu¨zu¨n, U. & Nedderman, R. M. An investigation of the flow boundary during steady-state discharge from a funnel-flow bunker. Powder Technol. 31, 27–43 (1982).
9. Howell, D., Behringer, R. P. & Veje, C. Stress fluctuations in a 2D granular Couette experiment: a continuous transition. Phys. Rev. Lett. 82, 5241–5244 (1999).
10. Veje, C. T., Howell, D. W. & Behringer, R. P. Kinematics of a two-dimensional granular Couette experiment at the transition to shearing. Phys. Rev. E 59, 739–745 (1999).
11. Rajchenbach, J. Granular flows. Adv. Phys. 49, 229–256 (2000).
12. Karion, A. & Hunt, M. L. Wall stresses in granular Couette flows of mono-sized particles and binary mixtures. Powder Technol. 109, 145–163 (2000).
13. Losert, W., Bocquet, L., Lubensky, T. C. & Gollub, J. Partical dynamics in sheared granular matter. Preprint cond-mat/0004401 athhttp://xxx.lanl.govi (24 April 2000).
14. Khosropour, R., Zirinsky, J., Pak, H. K. & Behringer, R. P. Convection and size segregation in a Couette flow of granular material. Phys. Rev. E 56, 4467–4473 (1997).
15. Fukushima, E. Nuclear magnetic resonance as a tool to study flow. Annu. Rev. Fluid Mech. 31, 95–123 (1999).
16. Ehrichs, E. E. et al. Granular convection observed by magnetic resonance imaging. Science 267, 1632– 1634 (1995).
17. Hopkins, M. A., Jenkins, J. T. & Louge, M. Y. On the structure of three-dimensional shear flows. Mech.
Mater. 16, 179–188 (1993).
18. Debregeas, G. & Josserand, C. A self-similar model for shear flows in dense granular material. Preprint cond-mat/9901336 (cited 24 Feb. 2000) athhttp://xxx.lanl.govi (1999).
19. Tkachenko, A. & Putkaradze, V. Mesoscopic physics of granular flows. Preprint cond-mat/9912187 (cited 10 Dec. 1999) athhttp://xxx.lanl.govi (1999).
20. Josserand, C. A 2D asymmetric exclusion model for granular flows. Europhys. Lett. 48, 36–42 (1999). 21. Hanes, D. M. & Inman, D. L. Observations of rapidly flowing granular-fluid materials. J. Fluid Mech.
150, 357–380 (1985).
22. Pouliquen, O. & Gutfraind, R. Stress fluctuations and shear zones in quasi-static granular chute flows.
Phys. Rev. E 53, 557–561 (1996).
Acknowledgements
We thank E. Fukushima, J. Jenkins, C. Josserand, D. Levine, M. Medved, V. Putkaradze,
0 20 40 60 80 0.1 1.0 10.0 100.0 (r/d)2 v (mm s –1)
Figure 4 Rate-independence of the velocity profiles. Shown is a log plot of poppy-seed
velocity profilesv(r) as a function of (r/d)2for four different shearing wall speeds (vwall= 120, 52, 33 and 14 mm s−
1
, top to bottom). Straight lines on this plot correspond to a gaussian with origin atr= 0. The slope,c, of these lines corresponds to half the average slope of the velocity gradient in Fig. 3b and characterizes the width j =d/c1/2of the shear band.
letters to nature
NATURE|VOL 406|27 JULY 2000|www.nature.com 389
M. Rivers and A. Tkachenko for discussions, and D. Stockwell for the donation of mustard seeds for the experiment. G.F.D. acknowledges a postdoctoral Grainger Fellowship. This work was supported by an NSF research grant and by the MRSEC program of the NSF. Correspondence and requests for materials should be addressed to H.M.J.
(e-mail: h-jaeger@uchicago.edu).
...
Oscillatory cluster patterns in a
homogeneous chemical
system with global feedback
Vladimir K. Vanag, Lingfa Yang, Milos Dolnik, Anatol M. Zhabotinsky & Irving R. Epstein
Department of Chemistry and Volen Center for Complex Systems, MS 015, Brandeis University, Waltham, Massachusetts 02454-9110, USA
... ... ... ... ... ... Oscillatory clusters are sets of domains in which nearly all elements in a given domain oscillate with the same amplitude and phase1–4. They play an important role in understanding
coupled neuron systems5–8. In the simplest case, a system consists
of two clusters that oscillate in antiphase and can each occupy multiple fixed spatial domains. Examples of cluster behaviour in extended chemical systems are rare, but have been shown to resemble standing waves9–13, except that they lack a
character-istic wavelength. Here we report the observation of so-called ‘localized clusters’—periodic antiphase oscillations in one part of the medium, while the remainder appears uniform—in the Belousov–Zhabotinsky reaction–diffusion system with photo-chemical global feedback. We also observe standing clusters with fixed spatial domains that oscillate periodically in time and occupy the entire medium, and irregular clusters with no peri-odicity in either space or time, with standing clusters transform-ing into irregular clusters and then into localized clusters as the strength of the global negative feedback is gradually increased. By incorporating the effects of global feedback into a model of the reaction, we are able to simulate successfully the experimental data.
The Belousov–Zhabotinsky (BZ) reaction is the best studied chemical oscillator; its dynamics resemble those of many important biological and physical nonlinear oscillators14–19. The reaction
con-sists of the oxidation of malonic acid by bromate, catalysed by metal ions or metallo-complexes in acidic aqueous solution.
Here we study pattern formation in the photosensitive Ru(bpy)3
-catalysed BZ reaction20–22 in a thin layer of silica gel23,24 with
photochemical global negative feedback imposed through illumi-nation (see Fig. 1). The average concentration of Ru(bpy)3+3, Zav,
taken over the working area of the gel, is employed to control the intensity I of actinic light (from lamp L2), according to I =
Imaxsin2(g(Zav−Zt)), where g is the feedback coefficient and Ztis a
target concentration. The target Zt is varied by changing the
reference voltage (RV) and is set close to the steady state value,
Zss, in such a way that the difference Zav−Ztis always positive. The
angle between polarizers P1 and P2 (that is, g(Zav − Zt)) is not
allowed to exceedp/2. The gain of amplifier A5 is used to control the feedback coefficient g. The actinic light produces bromide ion21,
which inhibits the oxidation of Ru(bpy)2+3.
We investigate how pattern formation depends on g. We choose the initial reagent concentrations in such a way that without any feedback the system generates bulk oscillations. Various travelling wave patterns are found when g is less than g*, a value that depends on the initial concentrations of reagents. In most cases,
13 104M−1, g* , 2×10⁴M−1. When the feedback coefficient is slightly above g*, either travelling wave patterns or cluster patterns are observed, depending on the initial conditions. The width of this bistability range depends on the initial reagent concentrations.
When g exceeds 2× 10⁴M−1, standing clusters arise. Figure 2 depicts several patterns of such clusters. Figure 2a shows one period of oscillation of a pattern that arose from initial conditions created by brief illumination of the gel through a striped mask. At t = 4 s, Zav
reaches a maximum. After this instant, the white domains start to fade and the system gradually evolves to the uniform reduced (dark) state. During the second half-period, the regions that were dark during the first half-period become bright, and at t = 29 s the pattern displays another maximum in Zav. As adjacent domains oscillate in
antiphase, the period, Tav, of oscillations of Zavis half the period of
the local oscillations. Figures 2b and 2c show patterns that devel-oped from a spiral wave and from uniform initial conditions, respectively. Other patterns of standing clusters can be obtained by varying the initial conditions. Standing clusters do not possess intrinsic spatial periodicity, because the global feedback is sensitive only to the spatially integrated characteristics of the patterns.
At larger g, two other types of patterns arise. If the initial reagent concentrations lie far from the boundary of the oscillatory region of the parameter space, we observe a transition from standing clusters
a light beam CFUR 9.5 mm 7 mm D b L2 F L3 FSLM P4 BS P3 IF L1 IF DCFUR to PC A5 AL3 PM A1 AD4 RV AD2 C C D IF BS P2 P1 BS DR PMT
Figure 1 Experimental set-up. a, The continuously fed unstirred reactor (CFUR)
consists of a 24-ml continuously stirred tank reactor thermostated at 258C and a thin layer of silica gel polymerized on the reactor optical window (grey circle). The 0.413-mm-thick gel has diameter 22 mm, and contains 1.5 mM of immobilized Tris(2,2 9-bipyridyl)ruthenium(II)(Ru(bpy)2+3. Diaphragm D selects an illuminated working area of gel (light grey circle). The rectangular frame shows the field of view of the CCD camera. A peristaltic pump injects stock solutions of KBr, malonic acid, NaBrO3and H2SO4into a pre-mixing chamber (not shown) and then into the CFUR. b, Low-intensity analysing light from the stabilized 45-W light source (L1) passes through the working area of the gel, and is collected by a lens and directed to the photomultiplier tube (PMT). AD2 and AD4 are differential amplifiers, AL3 is a logarithmic amplifier, A5 is a d.c. amplifier. The driver (DR) rotates polarizer P1, and controls the intensity of actinic light from the 450-W Xe arc lamp (L2). P1–P4 are polarizers, IFs are interference filters with lmax= 450 nm, Fs are bandpass filters (400–500 nm), BSs are beam splitters; lenses and collimators are not shown. The 150-W Xe arc lamp (L3) serves to set patterns of initial conditions. An image of the spatial light modulator (SLM) is focused in the plane of the silica gel. Actinic light intensity (I) is measured by the power meter (PM). Polarizers P2-P3 and P4-P3 are crossed to separate optical channels. The remaining parasitic signal from scattered actinic light is compensated electronically by amplifiers A1 and AD2, and stays below 1% of the photomultiplier working signal whenIvaries from 0 toImax= 4.3 mW cm−2. Uniformity of illumination of the working area is better than 2%.
VOLUME87, NUMBER17 P H Y S I C A L R E V I E W L E T T E R S 22 OCTOBER2001
Deformation and Flow of a Two-Dimensional Foam under Continuous Shear
G. Debrégeas,* H. Tabuteau, and J.-M di Meglio†
Institut Charles Sadron, CNRS UPR 022, 6 rue Boussingault, 67083 Strasbourg Cedex, France (Received 21 March 2001; published 9 October 2001)
We investigate the flow properties of a 2D foam (a confined monolayer of jammed bubbles) submitted to a continuous shear in a Couette geometry. A strong localization of the flow at the moving inner wall is evidenced. Moreover, velocity fluctuations measurements reveal self-similar dynamical structures consisting of clusters of bubbles moving coherently. A stochastic model is proposed where bubbles rearrangements are activated by local stress fluctuations produced by the shearing wheel. This model gives a complete description of our observations and is also consistent with available data on granular shear bands.
DOI: 10.1103/PhysRevLett.87.178305 PACS numbers: 82.70.Rr, 83.80.Iz
Disordered systems, such as foams, concentrated emul-sions, slurries, or granular materials, exhibit rheological properties that cannot be understood within the scope of standard solid or liquid mechanics [1 – 3]. For such sys-tems, thermal energies are orders of magnitude lower than the typical energy required to relax the structural arrange-ments of their components; under small forces, the ma-terial remains trapped in a metastable configuration and exhibits a solidlike behavior. However, when submitted to a large enough stress, it can be driven through a series of new metastable configurations, giving rise to a macro-scopic flow. But the resulting flow field may still differ a lot from what would be expected for a molecular liquid.
Dry sand slowly flowing down an hour glass provides a simple example of such abnormal flow behaviors: the flow splits into a pluglike central region and a strongly sheared thin layer at the wall — a few particles wide — where most of the dissipative process occurs [4]. This spontaneous localization of the strain in narrow regions (the so-called shear bands) can be observed in many other situations such as shear, surface or convective flows for instance [5–8]. Shear banding actually controls most of the practical situations encountered in soil mechanics and industrial handling of grains, and is also relevant to pyroclastic flows in geology (for a review on granular matter, see [9]). This question has recently received a lot of attention from physicists, both theoretically and experimentally [10,11], but a clear picture has not emerged yet.
By contrast, the possibility of shear banding in foams has been mostly ignored in the literature, and numerical or theoretical studies usually assume shear flows in foams to be uniform [2,12]. The assumption that shear banding is unique to granular matter can be misleading because it sug-gests that some peculiar aspects of granular flows, such as solid friction, particle rotation, or dilatancy, are essential.
In this Letter, we report the formation of shear bands in aqueous foams. We believe that foams may shed light on the dynamics of granular systems by evidencing the minimal set of ingredients needed to get shear banding. To that extent, foams constitute a much simpler model than granular systems since the basic bubble/bubble
in-teractions which control the mechanical properties of the material are well known: elastic (stored) energy is related to an increase of the total interfacial area when the bubbles are distorted, whereas dissipated energy is associated with neighbors swapping events (T1 processes) inducing flows
in the liquid films and vertices (for a review on foams, see [13]).
In order to probe the microdynamics of the foam, one needs to track the trajectory of each bubble. Since 3D foams are inherently diffusive to light, we used a 2D model foam — a confined monolayer of bubbles — submitted to a continuous slow shear in a wide-gap Couette geome-try. The setup was composed of an inner shearing wheel and an outer ring (of respective radius R0 苷 71 mm and R1苷 122 mm) confined between two transparent plates
separated by a 2 mm gap. To produce the foam, the cell was first held vertically and partially filled with a known volume of soap/water solution. Bubbles were formed by blowing nitrogen gas through two small injection holes at different flow rates until the resulting foam reached the top of the cell. Once set horizontally, the foam rapidly attained a uniform wetness characterized by its liquid fraction 0.01 , f , 0.3 (Fig. 1). This foaming proce-dure was chosen because it produces bidisperse disordered foams and therefore eliminates crystallization. The mean diameters within each of the two populations of bubbles were of the order of 2 and 2.7 mm, with a mean deviation of 0.2 mm. These bubbles were large enough compared to the gap height so that they would not overlap. To define a bubble scale, we measured the mean distance d between first neighbors in the foam. We kept 2.1 , d , 2.5 mm so that the gap between the wheel and the ring could accommodate from 20 to 25 rows of bubbles. The distance
d was evaluated several times during the experiment and found to be almost constant. Coarsening would eventually lead to a growth of the biggest bubbles at the expense of the smallest ones but over a longer time. We also checked the absence of shear induced size segregation that might have occurred during the experiment.
Shearing was induced by rotating the inner wheel at constant velocity Vwheel using a stepper motor. To avoid
VOLUME87, NUMBER17 P H Y S I C A L R E V I E W L E T T E R S 22 OCTOBER2001
FIG. 1. Close-up frames of dry and wet 2D foams under
continuous shear. The shearing wheel appears in black. Arrows indicate the inner wheel direction of rotation. (A) A dry
bidis-perse foam (f苷 0.05), showing deformed polygonal cells.
(B) A wet bidisperse foam (f苷 0.20). The bubbles are
circular and undeformed. (C) System of coordinates used to analyze the flow field.
slippage at the wheel and the ring, their sides were tooth shaped so that the first and last rows of bubbles would re-main irreversibly attached to the walls. To eliminate tran-sient effects, we ran the experiment a full round before taking data. The motion of 1000 to 1500 bubbles was then recorded using a CCD digital camera positioned over the setup. In a typical experiment, 3000 images were taken corresponding to a total displacement of 600d of the wheel edge. The apparent centers of mass of the bubbles were subsequently tracked by image analysis (IDL software). To reduce the effect of the viscous friction between the bubbles and the confining plates, we restricted our study to quasistatic flows. We focused on average velocity mea-surements as a probe of shear rate dependence: we found that in the range 0 , Vwheel, 0.7 mm ? s21, the
veloc-ity profiles were similar apart from an overall scale factor. All experiments were performed in the quasistatic regime at Vwheel 苷 0.25 mm ? s21. In the following, all velocities
and distances are normalized by Vwheeland d, respectively.
We note v0苷 Vwheel兾d the characteristic frequency of
the shear.
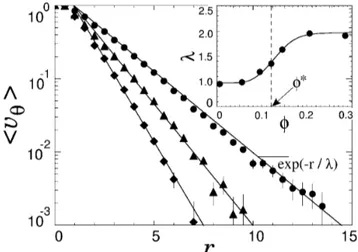
Figure 2(A) shows the decay of the average tangential velocity具yu共r兲典 with the distance r to the shearing wheel
for different liquid fractions f [see Fig. 1(C) for variables definition]. Averaging was performed over the tangential coordinate ruand time t, yielding smooth and reproducible
profiles, although the instantaneous flow is strongly in-termittent. The reduced velocity is found to approach 1 at r ! 0 confirming the absence of slip at the edge of the wheel. At larger r, the profiles exhibit an exponen-tial decay
具yu共r兲典 ⬃ exp共2r兾l兲, (1)
FIG. 2. Average tangential velocity profiles for different liquid
fraction (䉬: f 苷 0.05; 䉱: f 苷 0.12; ≤: f 苷 0.20), showing exponential decays with a width l共f兲. The small plateau for 0 , r , 1 corresponds to the first row of bubbles being at-tached to the shearing wheel. Inset: Dependence of l on liquid fractions f (the line is just a guide for the eyes). Two plateaus
can be distinguished on either side of fⴱ⯝ 0.12, which
sepa-rate polygonal and circular bubbles regimes.
with a width l depending on f. The curve l versus f, presented in Fig. 2 (inset), shows two plateaus at low and high volume fraction. The transition between these two regimes occurs around fⴱ苷 0.12, which qualitatively marks the limit between dry foams with polygonal bubbles for f , fⴱand wet foams with circular bubbles for f . fⴱ. In both cases, the rapid decay of the mean velocity over a few bubble diameters establishes the existence of shear banding in foams. The exponential shape of the velocity profile, observed in all experiments, appears as a robust feature which was also observed in comparable experiments performed on 2D granular materials [4,5,14]. Beyond these time averaged profiles, our setup allows measurements of the short time scale fluctuations of the bubbles velocities. A mere observation of the video sequences reveals brief oscillations of clusters of bubbles of various radial extension, rotating together as rigid bodies as shown in Fig. 3. These dynamical structures are ephemeral and disappear after the wheel edge has moved by roughly one bubble diameter (this was checked by measuring time correlations of the velocity which decay to 0 in a time of order 1兾v0). To quantitatively probe these
coherent moves, we studied the spatial correlations of the instantaneous velocity field. We focused on the radial component yr which has a zero time average and therefore
gives a better signal to noise ratio (qualitatively, similar results were found when using yu 2具yu典 instead of yr).
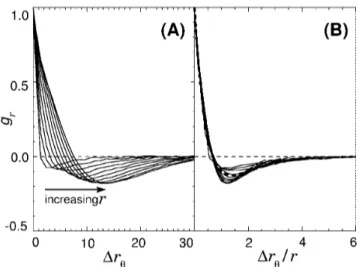
Figure 4(A) shows the correlation function gr共Dru兲 苷
具yr共r, ru兲 ? yr共r, ru 1 Dru兲典兾具y2r共r兲典 for different values
of r from 1 to 10, at a volume fraction f 苷 0.20. Regardless of r, gr decreases with Dru from 1 to a
negative value then slowly relaxes to 0. The length j共r兲