Design and Evaluation of Biomass Utilization
Systems
by
Valerie Peng
B.S., Mechanical Engineering, MIT (2017)
Submitted to the Department of Mechanical Engineering
in partial fulfillment of the requirements for the degree of
Master of Science in Mechanical Engineering
at the
MASSACHUSETTS INSTITUTE OF TECHNOLOGY
June 2019
@
Massachusetts Institute of Technology 2019. All rights reserved.
A uthor ...
Certified by...
Walter M. May & A.
Accepted by ...
MASS INTITUTE OF TECKNOLOGYJUN 1310
9
LIBRARIE$
Signature redacted
Department of Mechanical Engineering
May 19, 2019
Signature redacted
Alexander Slocum
Hazel May Professor of Mechanical Engineering
Signature redacted
Thesis Supervisor
I
Nicolas Hadjiconstantinou
Chairman, Department Committee on Graduate Theses
Design and Evaluation of Biomass Utilization Systems
by
Valerie Peng
Submitted to the Department of Mechanical Engineering on May 19, 2019, in partial fulfillment of the
requirements for the degree of
Master of Science in Mechanical Engineering
Abstract
This thesis designs and evaluates systems to utilize two problematic biomass sources, hurricane debris and invasive water hyacinth, and turn costly cleanup efforts into opportunities for biofuel conversion systems. A novel solution is proposed for each biomass source and techno-economic models accounting for economic, energy, and carbon costs are used to evaluate different options for utilization. Hurricane debris is a feedstock that gets generated in vast quantities in an unpredictable manner, thus its main challenge is its supply chain. We propose a 30MW barge-mounted biofuel conversion system, which travels to hurricane-hit ports and converts debris into biofuels. For a 30MW plant, the break-even per-gallon revenue for profitability was found to be $5.28 per gallon of jet fuel for Fischer-Tropsch synthesis, $0.88 per gallon of heating oil for pyrolysis, and $1.07 per gallon of ethanol for fermentation. Using May 2019 US national fuel prices, the pyrolysis and fermentation plants were found to operate at a profit of $363.87 and $166.40 per dry ton of consumed hurricane debris respectively. A supply chain model was also created to calculate debris transport costs and evaluate the economic benefits of chipping debris directly in the field, which was found to be 24% more efficient than status quo stationary chipping operations. Water hyacinth is generated predictably and in huge quantities; however, the weight of water hyacinth is up to 95% water and it is thus inefficient to work with. Thus, we propose a novel roller-crusher harvester which grabs, crushes, and directly bags aquatic plants into digesters in-situ on the water. We find that an anaerobic digestion system with the proposed mechanical harvesting system could make a profit of $5.81 per ton of hyacinth, turning a costly problem into an economic opportunity. Hardware designs, prototypes, and on-water tests then show the viability of the roller-conditioner as a boat-mounted in-situ harvester-crusher. Ultimately, this work shows that careful design and evaluation of utilization systems could turn government aid and charity spent every year on debris and waterway cleanup into a profitable investment.
Thesis Supervisor: Alexander Slocumn
Acknowledgments
I would like to give a huge thank you to Professor Alex Slocum for pushing me down a
path of precision engineering for the sake of human goodness, and for teaching me to turn problems (frowns) into opportunities (smiles). Thank you also for showing your students that it is not only possible to balance family, career, and self in harmony, but also possible to have all in full throttle. I have a lot to learn still, and can only hope I will continue to draw from your mens et manus.
Thank you also to Dr. Jason Prapas for wittingly drawing me into the world of using problematic plants as opportunities, and for your never-ending supply of technical insights and support. Your mentorship has helped me scratch the surface of
being a cognizant, entrepreneurial engineer, and I know I will continue to learn from your expertise.
Thank you to Circle C Rollers for your generous donation of the roller-conditioner
display unit, which was critical to the on-water tests of Chapter 5, and your patience in helping a student take a dive into agricultural equipment. Thank you to Country
Gardens of Rowley, Massachusetts, for your supply of water hyacinths at the outset
of this project.
Thank you also to Megan O'Brien for helping me start on the path of evaluating
biomass systems, and to Professor David Hsu for allowing me into the world of urban planning and community engagement when designing systems to help the people of Puerto Rico.
Thank you to my labmates in PERG, whose relentless curiosity and work ethic continue to push me to be a better engineer and a better friend, and thank you
for your never-ending supply of design reviews, gentle nudges, hard questions, and
bridge-loop runs. Thank you also to Ethan Lietch for your curiosity, commitment, and attitude on helping to design and test the bagging section of this thesis.
Thank you to Sarah Wright for the nudges when I needed them, and for your
confidence in me when I had none left.
to MIT, but thrive here. I would not be here without your years of commitment and
love. And finally thank you to my older sister Lauren, who has always been there to
cheer me on, console me, and laugh with me - you are truly the best sister anyone could ask for.
This material is based upon work supported by the National Science Foundation
Graduate Research Fellowship under Grant No. (1122374). Any opinions, findings, and conclusions or recommendations expressed in this material are those of the
au-thors and do not necessarily reflect the views of the National Science Foundation.
Contents
1 Introduction 23
2 Background 25
2.1 Conversion of Biomass into Energy . . . . 25
2.1.1 Biomass Feedstock Characteristics . . . . 25
2.1.2 Biomass Conversion Processes . . . . 27
2.1.3 Biomass Pretreatment Overview . . . . 28
2.1.4 Biomass Pretreatment Costs and Opportunities . . . . 30
2.1.5 Biofuel Types and Maturity . . . . 30
2.2 Current Utilization of Bioenergy . . . . 31
2.2.1 Utilization of Biomass Wastes . . . . 32
2.2.2 Biomass Debris and Invasive Plants . . . . 32
2.3 Biofuel Policy Incentives . . . . 34
2.3.1 US Renewable Fuel Standard (RFS) . . . . 34
2.3.2 Incentives for feed-in renewable electricity . . . . 35
3 Utilization of Hurricane Debris for Biofuel 37 3.1 Methods of Debris Disposal and Utilization . . . . 39
3.1.1 Landfilling . . . . 40
3.1.2 Incineration . . . . 41
3.1.3 Export . . . . 42
3.1.4 Conversion and Reuse . . . . 42
3.3
3.2.1 Debris Transport Model . . . .
3.2.2 Hurricane Debris Density . . . .
3.2.3 Puerto Rico Transport Modeling . . . .
3.2.4 Economic, Energetic, and Carbon Costs for
D ebris . . . ..
3.2.5 Mobile Debris Chipping . . . .. Model for Evaluating Biofuels from Hurricane Debris
3.3.1 Plant Sizing . . . ..
3.3.2 Economic Cost Accounting . . . ..
3.3.3 Energy Accounting . . . .. 3.3.4 Carbon Accounting . . . .
Hurricane Maria
3.4 Results of Biofuel Systems for Hurricane Debris Cleanup . . . .
4 Utilization of Water Hyacinth
4.0.1 Goals of the Techno-Economic Model . . . .
4.0.2 Criteria for Evaluation . . . .
4.1 Impact of Water Hyacinth on Ecosystems and Economies
4.1.1 Water Hyacinth Physical Properties . . . .
4.1.2 Reproduction and Survivability . . . .
4.1.3 Impact on Waterways and Ecosystems . . . .
4.1.4 Costs of Clearing Water Hyacinth . . . .
4.2 Methods of Clearing Water Hyacinth . . . .
4.2.1 No Removal . . . . 4.2.2 Manual Control . . . .
4.2.3 Chemical Control . . . .
4.2.4 Mechanical Control . . . .
4.3 Control Methods: Cost, Energy, and Carbon Accounting
4.3.1 Economic Costs of Control Methods . . . .
4.3.2 Energy Costs of Control Methods . . . .
4.3.3 Carbon Costs of Control Methods . . . .
46 47 50 . . . . 5 1 . . . . 52 . . . . 56 . . . . 57 . . . . 58 . . . . 60 . . . . 60 62 67 68 69 70 70 71 72 73 74 75 76 76 78 82 82 85 89
4.4 End Uses for Water Hyacinth . . . . 89
4.4.1 No utilization: decomposition . . . . 90
4.4.2 Bioethanol from Fermentation . . . . 90
4.4.3 Biogas from Anaerobic Digestion . . . . 91
4.4.4 Com post . . . . 92
4.4.5 Anim al Feed . . . . 92
4.4.6 Sum m ary . . . . 92
4.5 Utilization Methods: Anaerobic Digestion and Landfilling . . . . 93
4.5.1 Anaerobic Digestion of Water Hyacinth . . . . 94
4.5.2 No Utilization: Landfilling and Decomposition . . . . 100
4.6 R esults . . . . 102
5 Design of an Energy-Efficient and Cost-Effective Water Hyacinth System 107 5.1 Options for Simultaneous Collection and Pretreatment during Harvesting109 5.1.1 Performance of Current Mechanical Harvesters . . . . 110
5.1.2 Strategies for Optimizing Design . . . . 111
5.1.3 Agriculture References . . . . 112
5.1.4 Screw-Type Mechanism . . . . 113
5.1.5 Roller-Type Mechanisms . . . . 115
5.1.6 Strategy Selection of the Roller Crusher . . . . 119
5.2 Design of an On-Water Roller Crusher . . . . 120
5.2.1 Design Parameters and Initial Tests . . . . 121
5.2.2 Energy Requirements for Roller-Crushing Water Hyacinth . . 122
5.2.3 Prototype and Testing of a Gear-Tooth Roller Crusher . . . . 129
5.2.4 Mechanical Pretreatment Results . . . . 134
5.3 Large-Scale On-Water Roller-Crusher . . . . 137
5.3.1 Scale M odel Test . . . . 137
5.3.2 Bagging M odule . . . . 141
5.4 Optimization of Transportation Methods . . . .
5.4.1 Towing Hyacinth Mats . . . .
5.4.2 Towing on a Boat . . . .
5.4.3 Towing in a Bag . . . . 5.4.4 Methods for Cost Accounting . . . .
5.4.5 Economic, Energetic, and Carbon Cost Results
5.4.6 Future W ork . . . .
5.5 Maximizing System Efficiency and Financial Return on
5.5.1 Optimization of Methane Generation . . . .
5.5.2 Profit Maximization . . . . 5.5.3 Overall System Cost Evaluation . . . . 5.5.4 Future Work on AD System Optimization . . . 6 Conclusion
A Physical Properties of Water Hyacinth
B Experimental Methods for Roller-Crusher Prototype
C Models and Spreadsheets
Investment 149 149 151 152 153 154 156 156 157 158 163 165 167 171 173 175
List of Figures
2-1 The market prices for different RINs, reflecting the per-gallon ethanol
equivalent incentive that producers receive for producing renewable
fuels of different types [123]. . . . . 35
3-1 A picture showing part of the aftermath of Hurricane Maria, which
toppled electricity poles, trees, and lines across Puerto Rico and other
Caribbean islands. Photo by Carlos Giusti - AP, taken from Fortune
(2017) [98. . . . . 38
3-2 A qualitative assessment of conversion methods for hurricane debris.
Solutions range in complexity and in value of final produced product. 43
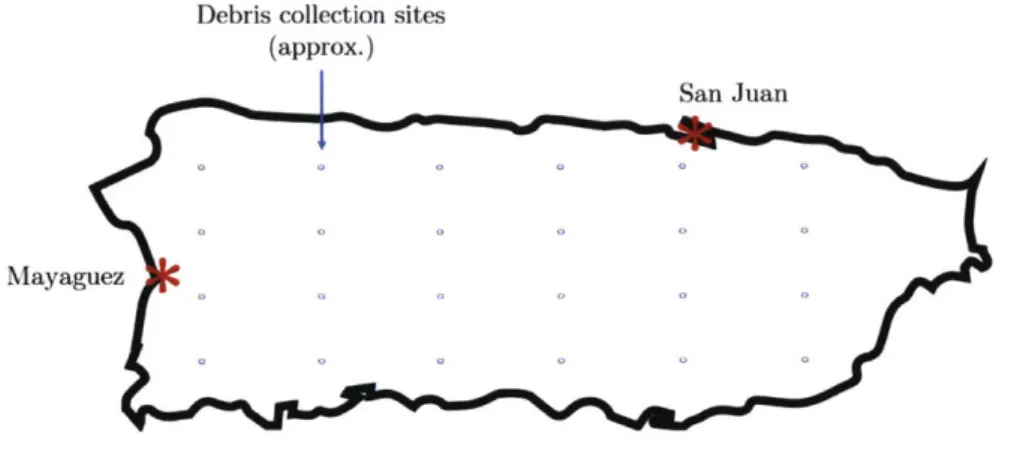
3-3 The model used to evaluate costs to transport hurricane debris from the vegetative collection sites spread throughout the island to the ports
of San Juan and Mayaguez. The collection sites were modeled to be
spread evenly throughout the island. Distances from the sites to the
ports were taken to be twice the direct-line distance, in order to account
for road winding and other unknowns. . . . . 51
3-4 The two debris cleanup scenarios being evaluated: (1) the status quo, wherein a front-loader and a truck operate in the field, and debris is
brought to a central gathering site. A second front-loader loads the
debris into the chipper. (2) A mobile chipper is brought to the field,
and N front-loaders are used to minimize operation costs. The debris
3-5 The results showing the specific transport cost for the status quo sce-nario, the mobile chipping scenario with N front-loaders, and the
mo-bile chipping scenario with only one front-loader allowed. . . . . 56 3-6 The results showing the balance of operations
($
per dry metric ton(dmt)) as a function of the summed fuel revenue
($
per gallon from the market fuel price and the renewable incentive). The range of summedrevenue is different for each fuel, as market prices for each fuel have
varied differently over the last ten years. The market value of heating
oil differs by region, so its fuel price was assumed to range from
$0-2.84 per gallon. For ethanol, the market value fuel prices have ranged
from $1.33-3.25 per gallon over the last ten years, with the May 2019
price being at the low of $1.33. For jet fuel, the price has ranged from
$0.85-3.29 per gallon over the last ten years, with the May 2019 price
being $1.97 per gallon [121]. . . . . 65
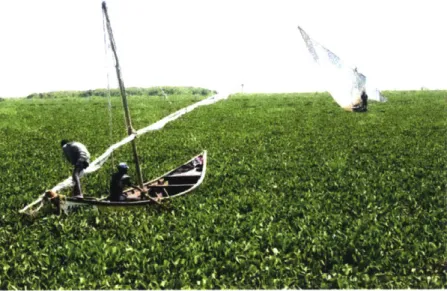
4-1 Fishermen stuck in a water hyacinth mat. Dense water hyacinth mats
float and blow with the wind, causing unpredictable movements and
stranding boats that get stuck in them. Picture credit to Denish
Ochieng, Standard Digital; taken from Onyango (2018) [87. . . . . . 68
4-2 A simple decision tree regarding the cleanup of hyacinth. Each decision
- whether to clean it, how to clean it, and what to do with it - should be carefully evaluated. . . . . 71
4-3 A picture of fishermen on Lake Victoria, manually inspecting and
cor-ralling water hyacinth. Picture credit to phys.org [24]. . . . . 77
4-4 A picture of a spray crew treating water hyacinth. Picture source from
Kimball Environmental Inc. webpage [65]. . . . . 78
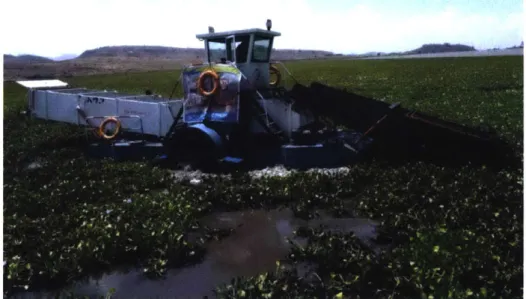
4-5 A typical aquatic hyacinth harvesting boat. These boats typically cost
more than $50,000, and have long maintenance down times due to
4-6 The relationship between plant length (stem height) and areal plant
density in kg/rn2. Data from Tucker (1981). . . . . 81
4-7 The areal cost (left) and specific mass cost (right) of shredding and
harvesting water hyacinth, as a function of reported stem height of the
hyacinth. Once changes in plant density are taken into account, the
spread between specific costs narrow significantly. Data taken from
Greenfield et al. (2006) and transformed using densities from Tucker
(198 1). . . . . 8 1
4-8 The effects of contract labor rates on mechanical control. Chemical
control costs are assumed to be $1500 per hectare across the board.
Original data obtained from Greenfield et al. (2005) and Lwasa et al.
(2002). . . . . 85
4-9 A picture of cattle eating water hyacinth. Often only the green leaves
and stems are eaten, and the roots and bulbs are left. Picture source
from http://www.inriodulce.com/ [57]. . . . . 93
4-10 A first-pass evaluation of different utilization pathways, rated as good
(green), neutral (yellow), or not ideal (red). . . . . 93
4-11 A summary of the inputs and outputs required to evaluate each control
method and utilization scheme. . . . . 94
5-1 A figure showing the main steps of the water hyacinth supply chain,
and potential strategies to achieve each step. . . . . 108 5-2 The integrated system of a John Deere combine harvester, which
di-rectly harvests and processes corn crops into clean corn kernels. Picture
source from John Deere webpage [60]. . . . . 112
5-3 Example of a single-screw extruder which conveys, melts, and extrudes plastic material through a die. Picture credit to Dr. Harold Giles, adapted from AZO Materials web page [30]. . . . . 114
5-4 CircleC rollers, which use spiral rubber rollers and high pressure for full
contact crushing. According to Mel Homer at Circle C Equipment, the
high pressure immediately crushes the plant cells and stops respiration.
Picture source from Circle C Equipment, LLC homepage [21]. . . . . 115 5-5 Alternative urethane and steel rolls, which crush rather than crimp the
incoming stems. Picture source from John Deere product brochure [59]. 115
5-6 Roller mechanisms are used in many types of volume reduction and pretreatment applications. (a) A diagram of a roller mill, which are
used to crush and reduce a wide variety of materials including biomass
or rock ore. Picture from Stedman Machine Company [107]. (b) A
figure taken from Tsapekos et al. (2018), which used steel conditioner
rollers (bottom rollers shown) to mechanically pretreat land grasses
for anaerobic digestion. A crimping conditioner roller used with a road
sweeping brush (top) enhanced methane production by 20% compared
to untreated grasses; a corrugated roller rotating in a corrugated shell
(bottom) enhanced methane production by 22-27% [112]. . . . . 116 5-7 A diagram of a four-roller conditioner, which uses a twined roller to
feed into the roller setup. Picture taken from Shinners [103]. . . . . . 117 5-8 A diagram of the roller crushing process and its main parameters: 0ni,,
the nip angle of the rollers (where friction pulls in the material), Pave, the average crushing pressure on the rollers, R, the roller radius, and
L, the arc length of contact. . . . .
5-9 The two main concepts considered are (a) an auger, which collects and shears the water hyacinth; and (b) a pair of roller-conditioners, which grabs and crushes the water hyacinth. The full system concept
is shown, wherein the harvester boat directly bags the water hyacinth
into anaerobic digester bags. This overall system concept is the subject
of this chapter. . . . . 5-10 The differences between flat rolling and meshed rolling on water
hy-acinth stem s. . . . .
118
119
5-11 The relationship between compression pressure and volume reduction
of water hyacinth, as reported by Bagnall (1982) [9]. . . . . 124
5-12 The model for a simple flat roller, and associated variable dimensions.
h(6) or A is the thickness of the biomass as it passes through the roller, 0 is the angle through which the biomass passes, with 6 = 0 at
the closest point between the rollers and =m.= 0ip, H, is the initial
thickness or height of the biomass, and H1 is the final thickness of the
biomass, equal to the roller gap spacing. . . . . 125 5-13 The torque required to compress water hyacinth on a one-meter geared
roller, as a function of the volume reduction. As can be seen, there is a
dramatic increase of required torque once volume reduction increases
above 80%. Torque requirements were calculated using pressure-volume
data from Bagnall (1982) [9] . . . . 126
5-14 A diagram showing the pressure distribution on the gear teeth as
biomass gets pulled through the gear-tooth roller and compressed. The
direction and magnitude of force varies greatly throughout the profile. 127 5-15 A diagram showing the two approximate zones of pressure regimes: (1)
the radial-only regime, where plants are compressed against the root
via the top land of the opposing roller tooth (and vice versa), and (2)
the pressure angle regime, where plants are compressed against the
tooth at pressure angle 4. . . . . 128 5-16 An isometric view of the Solidworks model of the designed geared roller
crusher. ... ... 129
5-17 Results from tests run on the geared roller crusher in water. (a) The
number of times a single leaf successfully fed through the rollers, as a
function of water level and travel speed. Three trials were performed
for each combination. (b) A diagram showing the relative water levels
from the experiments run in (a), which are above, at, or below the
mid-plane between the rollers. . . . . 131 5-18 A view of the crusher in the water. . . . . 131
5-19 The modeled and experimental power required to crush various
feed-stocks. Volume-pressure characteristics of lettuce and turnip tops were
assumed to be similar to water hyacinth above 65% volume reduction, i.e. that lettuce and turnip tops compress similarly to water hyacinth
without air gaps or roots [109]. . . . . 133 5-20 A diagram and picture of the water-displacement gas collection method
used to measure the methane generation of untreated, roller-crushed, and macerated water hyacinth . . . . . 135 5-21 The preliminary results from the anaerobic digestion of uncrushed,
roller-crimped, and shredded water hyacinth, showing the specific
bio-gas production from the three trials. The results show only slight
differences between the different methods. . . . . 136 5-22 The donated Circle C roller-conditioner display unit, before (a) and
after alterations and the addition of the chain drive (b). . . . . 138 5-23 The motorized display unit being drive through the water and hay
using a tractor. . . . . 139
5-24 A view of the loose hay that traveled through the roller, as well as a mat of hay which caused the rollers to clump. The overly-increased
preload force applied by the air bladders caused the key to push out, preventing the motor drive from operating the rollers. . . . . 140
5-25 A picture of a Versa silage bagger, which fills and simultaneously
un-rolls a silage bag. A rolled up bag is placed onto the back of the silage
bagger, and the silage bagger either drives forward or self-propels itself
forward as the bag gets filled. The bag thus unrolls itself as the silage
fills the bag. Picture from Versa Bagger website [128]. . . . . 141
5-26 A picture of the experimental test setup, wherein gradually increasing
number of weights were placed into a bag. The gradual increase
rep-resents the increase of drag forces on the bag as the bag unrolls in the
5-27 A CAD representation of the proposed large-scale roller crusher system.
The system shown is a 2m-wide roller system that is attached to a
14-foot long pontoon barge. The bag unrolls as the boat drives through the
water hyacinth, and collects the crushed hyacinth behind the rollers.
The hydraulics and other boat apparatus are not shown. . . . . 145
5-28 A comparison of specific energy requirements between towing water
hyacinth mats, towing smooth bags, towing biofouled net bags, and
towing on the back of a standard harvester boat. Results are shown
on a log scale. . . . . 155 5-29 A comparison of economic costs between towing water hyacinth mats,
towing bags, and towing on the back of a boat. . . . . 156 5-30 The calculated difference in profit from anaerobic digestion of cauliflower
leaves of different particle sizes. The assumed harvest cost is $4 per
fresh ton. Data from Sharma et al. (1988) [102]. . . . . 159
5-31 The calculated difference in profit from anaerobic digestion of cauliflower
leaves of different particle sizes. The assumed harvest cost is $40 per
fresh ton. Data from Sharma et al. (1988) [102]. . . . . 160
5-32 The average methane production for five different pretreatment stratgie
of Miscanthus grass: untreated, shredded, roller-milled, ground, and
extruded. Original regressed data from Frydendal-Nielsen et al. (2016)
[3 7]. . . . . 16 1
5-33 The daily profit from anaerobic digestion of Miscanthus with five
differ-ent pretreatmdiffer-ent strategies: untreated, shredded, roller-milled, ground, and extruded. Original regressed data from Frydendal-Nielsen et al.
(2016) [37]. . . . . 162
5-34 The daily profit from anaerobic digestion of untreated Miscanthus, with
differing harvest costs. Original regressed data from Frydendal-Nielsen
5-35 The annual profit expected from the anaerobic digestion of water
hy-acinth, as a function of volume reduction. The volume reduction
in-creases the mass loading rate, which is directly proportional to annual
revenues. An ultimate methane yield of 194 liters per kg volatile solids
is assum ed. . . . . 164 B-i An example of the measurements taken using a 1 Hz Watts Up Pro
power meter and Logger Lite. The peak power measurements were
used, and the mean and standard deviations of the trials (N=5) were
List of Tables
2.1 Typical yields from popular energy crops, taken from Mckendry (2002)
[76]. . . . . 26
3.1 The feedstock costs for shipping either unchipped or chipped hurricane debris from 24 vegetative debris collection sites spread evenly
through-out Puerto Rico. The mean travel distance is 78km. . . . . 52
3.2 The main parameters used in the mobile chipping model. Hourly ma-chinery costs are standard FEMA contract costs. The throughput
of the chipper is assumed to be the reported throughput of a 1000hp
Hogzilla chipper [52], and the theoretical throughput of the front-loader
is assumed to be the truck loading rate reported by Zomara-Cristales
et al. (2015) [141]. . . . . 55
3.3 A summary of the component costs for biofuel production as reported by Ekbom et al. and Dimitriou et al., amortized over the lifetime of
the plant. Additionally, Dimitriou et al.'s reported numbers scaled to
30MW show the importance of economies of scale in biofuel plants.
3.4 The results showing the net balance of operation for producing biojet
fuel, bio-oil, and ethanol from hurricane debris. The studies from
Ek-bom et al. (2009), Cambero et al. (2015), and Humbird et al. (2011) were scaled down to accept approximately 90,000 metric tons of
hur-ricane debris each year, which is approximately 56,000 dry tons and
30MW of biomass input, and US market values from May 2019 were
tabulated for all fuel products in order to directly compare the three
studies . . . . 62 3.5 The results showing the specific carbon emission offset per dry metric
ton (dmt) for producing biojet fuel, bio-oil, and ethanol from hurricane
debris. EPA emissions factors were used [116]. For each product, it is assumed that 1 GJ replaces 1 GJ of offset fuel. . . . . 63
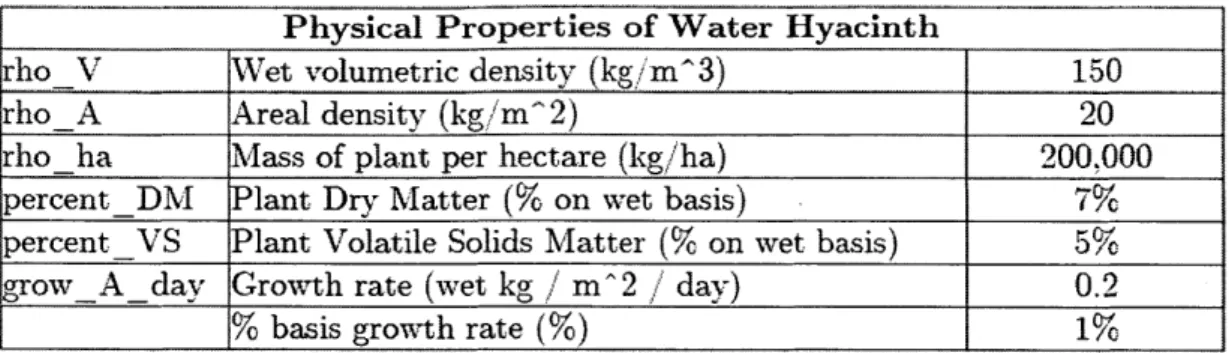
4.1 The primary physical properties of water hyacinth used in this model.
These assumed properties are derived from values reported in literature
- a full list of encountered values and sources are found in Appendix A. 72 4.2 A summary of the cost-effectiveness ratios found for manual, biological,
chemical, and mechanical control methods in a study conducted by
Lwasa and Mwanje (2002) [72]. . . . . 75
4.3 The assumptions used to construct the bottom-up cost estimates for
operating a generic mechanical harvester. . . . . 83
4.4 The transport, gathering, and conveying energy requirements for a
mechanical harvester. . . . . 87
4.5 The reported specific fuel consumption for two different mechanical
harvesters. . . . . 88
4.6 A summary of the production energy, application rate, specific
produc-tion energy (per mass of hyacinth treated), and specific carbon emission
4.7 A summary of studies on the anaerobic digestion of water hyacinth.
The methane potential shown to be a function of particle size and
pretreatm ent. . . . . 96
4.8 Emissions factors for different sources of energy. Data compiled from
EPA (2014). . . . . 97
4.9 The summary of the economic, energetic, and carbon revenues for the
anaerobic digestion of water hyacinth. The biogas is assumed to offset
wood energy, and fertilizer profits include costs required to transport. 100
4.11 Summary of the evaluated cleanup and harvesting methods, as well as
the utilization methods. . . . . 102 4.10 The summary of the economic, energetic, and carbon revenues for the
decomposition, open-air dumping, and landfilling of water hyacinth. . 102
4.12 A summary of the economic, energetic, and carbon costs for manual, chemical, and mechanical control methods paired with their respective
possible utilization (or non-utilization) scenarios. . . . . 103
4.13 The economic, energetic, and carbon emission cost results from the
case study of Lake Tana, with parameters shown. The results include
costs associated with no maintained coverage (total elimination of
wa-ter hyacinth), 50% of current hyacinth coverage maintained, and 100%
of current coverage maintained. . . . . 104
5.1 A summary of the main criteria and functional requirements of a
de-signed water hyacinth collecting system. . . . . 108 5.2 A summary of the differences between the roller and auger concepts. 120
5.3 A summary of the main design parameters for roller-crusher design. 121 5.4 The pretreatment energy input, approximate energy generated from
anaerobic digestion, and resulting energy balance for the untreated, roller-crimped, and food processed water hyacinth. The methane
5.5 The functional requirements, design parameters, and relevant analysis for the main modules of a roller-crusher system. . . . . 146
Chapter 1
Introduction
This thesis designs and evaluates systems to utilize two problematic biomass sources, hurricane debris and invasive water hyacinth, and turn costly cleanup efforts into opportunities for biofuel conversion systems. Both feedstocks present challenges for utilization - hurricane debris because of its unpredictable generation, and water hy-acinth because of its low solid density (95% weight in water). Both also cause great economic harm to the communities impacted by them. A novel solution is proposed for each biomass source and techno-economic models accounting for economic, energy, and carbon costs are used to evaluate different options for utilization. The goal of this work is to show that careful design and evaluation of utilization systems could turn government aid and charity spent every year on debris and waterway cleanup into a profitable investment. Chapter 2 gives background for biomass utilization and conversion technologies.
The motivation for evaluating the feasibility of using hurricane debris comes from the aftermath of Hurricane Maria, which hit Puerto Rico and surrounding Caribbean islands in Fall 2017. The hurricane caused dramatic damage throughout the region, including dumping 1 million tons of debris across Puerto Rico and contributing to almost 3000 deaths. In response, this thesis proposes a barge-mounted biofuel con-version system that travels to hurricane-hit ports and converts debris into biofuels. Chapter 3 presents techno-economic results for converting the debris into bio-jet fuel via Fischer-Tropsch synthesis, heating oil via pyrolysis, and ethanol via fermentation.
A generic debris transport model is also created, and is used to evaluate the economic
benefits of chipping debris directly in the field as a mobile system that loads, chips, and ships debris as a continuous unit.
The motivation to evaluate systems to clean up invasive water hyacinth comes
from the dramatic spread of water hyacinth throughout the world, which has caused
great economic and ecological harm to waterways and thus far has had costly and
inefficient cleanup methods. Chapter 4 evaluates the different ways to clean up and
use water hyacinth, and we present the costs and revenues associated with the most
promising and common options. An emphasis is given to mechanical harvesting
meth-ods, which have unmet technological needs yet help to avoid chemical herbicides and
allow for plant utilization. Chapter 5 then proposes a new method of cleaning up
water hyacinth and other aquatic plants: a mobile roller-conditioner harvester which
grabs, crushes, and directly bags the plants into digesters in-situ on the water. The
hardware designs, prototypes, and tests that address the highest-risk parts of this
proposal are then presented. Additionally, we create techno-economic models to
eval-uate the different modes of transporting water hyacinth - towed as a plant mat, in bags, or on a boat - and to optimize the mass loading rate of anaerobic digestion systems for maximum profit. Chapter 6 provides a summary of work done and of
Chapter 2
Background
Biomass energy makes up about 10-14% of the world's energy supply, or about 38 EJ
(1018 J) per year. Plant biomass is generated through the process of photosynthesis,
in which carbon dioxide (C02), water, and solar energy are biochemically converted
into carbohydrates that serve to power plant growth. When the organic carbon bonds
are broken down again, typically back into C02, energy is released; hence, biomass
energy has a cyclical carbon cycle and is considered renewable [76].
This section gives a brief overview of conversion technologies, the current state of
bio-energy globally, the use of waste biomass feedstocks, relevant subsidies and
incen-tives, and the core to this thesis: the use of debris and invasive plants as feedstock.
2.1
Conversion of Biomass into Energy
2.1.1
Biomass Feedstock Characteristics
Before converting a biomass into useful energy, the feedstock itself must be
under-stood. The main biomass feedstock characteristics are the heating value, moisture
content, volatile matter content, ash content and cellulose-lignin ratios.
The heating value of biomass is typically expressed as the lower heating value
(LHV), which represents the usable energy content of the fuel when combusted in air, or the higher heating value (HHV), which adds water vapor energy to the LHV. The
LHV of dry wood is around 20 MJ/kg, whereas the LHV of green wood can be as
low as 8 MJ/kg - hence the importance of the biomass moisture content, which can affect transportation fuel requirements and available conversion pathways [76].
Volatile matter content, ash content, and cellulose-lignin ratios describe the
con-vertibility of the organic compounds into energy. The volatile matter is the part
of the biomass that can be reacted when heated. The ash content is a portion of
the solid residue left behind after combustion, which creates additional handling and
processing costs. Finally, the biodegradability of cellulose, hemicellulose, and lignin
are very different, and thus in bioconversion pathways, the cellulose-lignin content is
important [76].
Outside of the intrinsic plant properties, the growth rate and yield of a feedstock
also determine suitability and profitability for production of bioenergy. The crop
yield (in kg or tons per hectare per year) and HHV (in MJ/kg) can be combined to
find the energy yield of a given land area (Table 2.1).
Energy yields from selected bionass
Biomass Crop yield HHV Energy yield
(dint/ha/a) (MJ/kg, dry) (GJ/ha) Wheat 7 grain/7 straw 12.3 (straw) 123
(14 total)
Poplar 10-15 17.3 173 259
SRC willow 10-15 18.7 187-280
Switchgrass 8 17.4 139
Miscanthus 12-30 18.5 222-555
Table 2.1: Typical yields from popular energy crops, taken from Mckendry (2002)
[76].
The biomass characteristics are essential to evaluating whether or not a biomass
could and should be used for bioenergy. For instance, road transport for a thermal
power station was found to be 70% of the delivered biomass feedstock cost -a function of bulk density (how dense it is), LHV (how energy dense it is), crop yield (how hard
it is to grow), and crop location.
This thesis focuses on using unconventional biomass sources as feedstocks, which
hurricane debris and invasive water hyacinth. Both feedstocks generate thousands of tons every year without additional human input, do not require land use conversion, and already require costly cleanup efforts; thus, they are problematic feedstocks which can be turned into economic opportunity.
2.1.2
Biomass Conversion Processes
Biomass can be converted into energy (heat or fuels) and/or physical products. Be-cause physical products are more feedstock-specific, they are addressed specifically for woody debris and water hyacinth in the following chapters. A brief overview of energy conversion pathways is given below.
Broadly, biomass can be converted via biochemical pathways such as anaerobic digestion and fermentation, or via thermochemical pathways such as combustion, pyrolysis, gasification, or liquefaction. In all cases, the basic solid, liquid, and/or gas products can be further upgraded to be used as replacement fuels or drop-in transportation fuels for petroleum products like gasoline, diesel, jet fuel, or natural gas.
Direct combustion of biomass can produce heat for generating steam and thus power, with electrical efficiency around 20-40%. Combustion is a mature technology and already has widespread use, particularly in the incineration of municipal solid waste. The combustion of biomass at a smaller scale, for space heating, cooking, and industrial processes, is the primary form of biomass energy utilization currently. The use of combustion for large-scale biomass power generation is limited to around 25-75 MW due to feedstock availability [25].
Anaerobic digestion (AD) is the degradation of biomass with methanogenic bacte-ria. AD has been commercially successful in agricultural digesters and in landfill gas recovery. AD can be used on a large variety of wet and dry biomass; however, it is not suitable for high-lignin biomass such as wood, due to the limited biodegradability of lignin [41].
Fermentation uses bacteria or yeast to convert sugars from biomass into alcohols such as methanol and ethanol. Most ethanol production in the United States is
produced by fermenting corn grain. These alcohols are typically drop-in gasoline
fuels, though can be upgraded further to be used as jet fuel blends [132].
Transesterification uses methanol to produce straight chain fatty acids from
veg-etable oils. The process is fairly mature, however it requires catalysts and produces
a number of products and waste streams [104].
Pyrolysis is the heating of biomass in the absence of oxygen, which creates a
carbonized solid residue (like charcoal), gas (typically a mixture of carbon monoxide, hydrogen, methane, carbon dioxide, and nitrogen), and oil-like liquid. Temperatures
and techniques can be changed to optimize one product over the other, and the
products themselves can be further refined [41]. For example, pyrolysis oil can be
refined into renewable gasoline, jet fuel, or diesel [132].
Gasification is pyrolysis at high temperatures, which optimizes the production of
product gases (hydrogen and carbon monoxide) and syngas (carbon dioxide and
wa-ter) over the production of liquid oils. The gases can be burned directly in boilers,
re-acted in combustion engines, or converted further into biofuels using Fischer-Tropsch
synthesis [26] [41].
Hydrothermal liquefaction (HTL) reacts biomass at high pressures and
temper-atures (350 deg C and 200 atm) to form biocrude oil, which can be further refined.
HTL has been a research topic of interest due to insensitivity to particle size and
moisture content; however, despite being studied and tested since the 1970s, HTL
technology has not been proven at a commercial-scale [140].
A number of other conversion technologies have been explored in literature;
how-ever, only technologies that have been tested at a commercial-scale were considered
for this project.
2.1.3
Biomass Pretreatment Overview
Biomass in its natural state is typically resistant to degradation, primarily due to
the presence of lignin. Lignin binds together the cellulose and hemicellulose layers, making the plant structurally rigid, insoluble in water, and resistant to microbial
and increase reaction-available surface area [1]. This processing is known as biomass
pretreatment, and it is typical for all the major conversion pathways.
The major types of pretreatment are:
" Mechanical: particle size is reduced using physical methods like chipping,
shred-ding, grinshred-ding, or milling. Mechanical pretreatment is widely used, however it
has high energy requirements.
" Biological: lignin and cellulose is broken down using fungi and/or enzymes to
enhance biodegradability. The residence time of biological pretreatment is
typi-cally on the order of 10-14 days, which increases storage requirements, decreases
throughput, increases capital cost, and is generally too slow for industrial
pur-poses.
" Chemical: lignin structure is disrupted via internal swelling, using acids, alkalis, or other liquids. The chemical compounds are typically consumed in the process, requiring an additional input to the system.
" Physicochemical: surface area is increased and structures are broken down using
processes like steam explosion (high pressure, high temperature steam). These
new methods can be low cost input and require no chemicals; however, they
are typically used to optimize conversion efficiency for biomass that has already
been reduced in size.
In microbial processes such as anaerobic digestion, some level of pretreatment is
necessary to increase the surface area of the plant and break up lignin structures, so that the microbes can access the cellulose [1]. The same is true for enzymes
in fermentation. However, particle size reduction past a certain point can inhibit
bioenergy production. For instance, Moorhead et al. (1993) found that anaerobic
digestion of water hyacinth was highest with 6.4mm particle size, compared to both
1.6mm and 12.7mm [80]. For gasification, the plant structure must react with hot
gases and pass through various fixed-bed or continuous reactors - particle sizes too large cannot pass through the reactor and do not react properly with the hot gas,
and particle sizes too small tend to clog more easily; thus, incoming feedstock particle
sizes typically range from 20-80mm [77].
2.1.4
Biomass Pretreatment Costs and Opportunities
Pretreatment is a major cost of biomass logistics, and the ability to pretreat effectively
and efficiently is a major barrier to large-scale commercial production, even for mature
conversion technologies like anaerobic digestion [81]. For fermentation, now widely
used in the United States and Brazil to produce first-generation ethanol, it has been
suggested that the challenge now is in producing good yields with low energy input, and that pretreatment should be a primary focus of research efforts [13.
Despite these suggestions that pretreatment logistics are an essential component
to bioenergy feasibility, as noted by Hjorth et al. (2010), the energy balance of
pretreatment strategies "has only been considered in a few previous studies." The
shredding of plant biomass is widely used as a precursor in anaerobic digestion studies
[95] [49] without reporting the energy required for such studies, yet other studies note
that the net energy budget from maceration has 'not proven to be positive' [51].
Milling, due to its high energy consumption, has also been questioned as unlikely
to be economically feasible [1]. Thus, it is important to carefully evaluate the most
efficient way for optimal pretreatment with minimal energy consumption.
The economic and energetic costs associated with pretreatment is a motivator
for this thesis, as pretreatment costs can be minimized by integrating into
already-existing supply chains (as with hurricane debris) or by integrating mechanical
pre-treatment with harvesting requirements (as with water hyacinth).
2.1.5
Biofuel Types and Maturity
Biofuels are classified as first, second, and third-generation biofuels based on their
feedstock.
First-generation biofuels are made from edible crops such as corn or sugarcane.
soy-bean or palm oil, are the only biofuels currently produced at an industrial scale [69].
The conversion of these high-starch and high-sugar feedstocks is more technologically
mature.
Second-generation biofuels are made from any number of other feedstocks, such as
non-edible lignocellulosic woods, agricultural residues, and municipal waste. These
feedstocks typically cost less than corn ($300/ton): $100-120/ton for woods,
$60-80/ton for agricultural and forest residues, and $0-60/ton for municipal waste [69].
The wide availability, low feedstock cost, and potential to integrate into existing
supply chains make second-generation biofuels the main target of current government
subsidies and research studies. However, the homogeneity for these feedstocks can be
significantly lower, and their conversion pathways are often less mature. Currently, landfill gas (LFG) is the most proliferous second-generation "biofuel", with over 600
operational LFG projects in the US [115].
Third-generation biofuels refer to biofuels produced from algae. Algae have high
growth rates and thus the ability to sequester carbon dioxide when co-located with
power plants; however, have growth challenges at an industrial scale.
2.2
Current Utilization of Bioenergy
Biomass energy can make up 35% of primary energy consumption in developing
coun-tries [25], and is typically used in more traditional forms such as fuelwood and manure
[53]. However, in the developed world there has been an increased push for the use
of advanced biofuels made from high-productivity energy crops such as grasses or
willows. Biomass-derived renewable fuels are a promising way to decrease our
depen-dence on fossil fuels and reduce greenhouse gas emissions, as energy crop biofuels can
be used to produce drop-in ethanol, bio-jet fuel, renewable natural gas, and bio-diesel.
However, such crops are often grown on arable land, replacing or following the food
and fodder land needs of the region. For instance, 40% of the corn grain grown in
the United States in 2011 was used for ethanol production [82]. The merits of using
because deforestation and land use change has been thought to account for 12-20%
of all anthropogenic greenhouse gas emissions.
2.2.1
Utilization of Biomass Wastes
Another class of biomass energy is in biomass wastes, including agricultural residues, woody residues, livestock animal manure, and municipal solid waste. These waste
streams can be low-cost feedstocks with already existing supply chains (such as water
and sewage infrastructure) and do not require useful land to be grown; however, the
feedstock itself can be highly diverse and can contain contaminants. The United
States generates approximately 230 million tons of municipal solid waste (MSW),
318 million tons of agricultural waste fiber (like corn stover and crop residues), 66
million tons of food waste, and 45 million tons of wood and yard waste every year.
The energy potential of these waste streams is significant: the methane potential from
anaerobically digesting domestic livestock manure alone would generate 2.4% of US
electricity requirements. These waste streams are often predictable but difficult to
gather and separate, as they are low density and heterogeneous feedstocks [101].
Of the conversion technologies for biomass wastes, anaerobic digestion of municipal
waste is one of the most mature. Landfills are quasi-anaerobic digesters, and the
utilization of landfill gas is growing [115]. Additionally, wastewater can be treated
with anaerobic digestion: for example, the Massachusetts Water Resource Authority
(MWRA) operates an anaerobic digester on Deer Island which converts human waste
into methane and fertilizer, generating 28 MWh of electricity and saving the MWRA
approximately $15 million in fuel oil costs and $2.8 million in electricity every year
[73].
2.2.2
Biomass Debris and Invasive Plants
There is an entirely other class of biomass that might be described as uncoupled
or unpredictable supply chains - biomass waste streams that are not coupled with existing agricultural, industrial, or urban supply chains. Examples of such biomass
wastes are invasive plant growth, hurricane debris, and detritus from other invasive
animals (such as beetle infestations). These biomass sources are generated in high
volumes without intentional human input and are often associated with economic
losses and costly cleanup operations. For instance, it is estimated that in India,
1.32 million hectares are covered with 100-200 million tons of aquatic weeds in
post-monsoon season, and this number can increase to 2.1 million hectares in pre-post-monsoon
season [63]. Duncan et al. (2004) estimate that 51 million hectares in the United
States are infested with just 16 species of invasive plants. Additionally, these plants
have spread rates easily over 10% and can cause great environmental harm. For
instance, Tamarix, a flowery plant originating from Eurasia and Africa, has overtaken
between 0.47-0.65 million hectares of grazing and wildlands across the western United
States, projecting to cost $7-16 billion in lost ecosystem function over the next
half-century [29]. These feedstock streams are harder to estimate, are underutilized, and
are the subject of current research.
These invasive and non-agricultural biomass sources present a distinct
optimiza-tion problem because the supply of biomass is created regardless of human input, economic losses can arise because of the biomass growth, and resources are already
used to collect and remove the biomass. The biomass itself may not be optimized for
a given bio-energy process, for instance due to moisture content, lignin content, or
heterogeneity; however, the potential of these biomasses is vast. If the infested plots
of land studied by Duncan et al. (2004) were even 25% as productive as switchgrass, they would produce 1.8 EJ (1018 J) of energy per year, or about 2% of annual US
energy consumption.
Disaster debris is another source of problematic biomass, and it is generated
un-predictably and in enormous quantities. Earthquakes, tsunamis, tornadoes, and
hur-ricanes generate debris depending on the affected location and the strength of the
event. The focus of this work is on hurricane debris, due to the proximity of
hurri-canes to the water and the relative short-term predictability of the storms. In 2005, Hurricane Katrina generated 100 million cubic yards of disaster debris [71] spread
States in recent years have also left behind major quantities of debris, including
Hur-ricane Michael in 2018 generating an estimated 72 million tons of debris [113] and
Hurricanes Maria and Irma generating approximately 1 million tons of debris in 2017
[14]. Over the last 30 years, an average of 1.6 hurricanes have made landfall in the
United States, with 0.5 hurricanes being Category 3 or above [11]. The frequency
and intensity of hurricanes is also expected to increase due to climate change [131]
-thus, a solution that helps to consume resulting hurricane debris and helps to combat climate change by lowering carbon emissions is required.
The focus of this thesis is on two non-traditional, water-borne feedstocks: woody
hurricane debris and invasive water hyacinth (Eicchornia Crassipes).
2.3
Biofuel Policy Incentives
2.3.1
US Renewable Fuel Standard (RFS)
The Renewable Fuel Standard in the United States was created under the Energy
Policy Act of 2005, and mandates that a certain volume of fossil-fuel transportation
fuel be replaced or reduced with renewable fuels. Each category of renewable fuel
has an annual mandated volume of production (and replacement), and thus each
category and sub-category has a "D-code" identification label attached to it. The different categories are:
" Cellulosic biofuel (D3) or cellulosic diesel (D7)
" Biomass-based diesel (D4)
" Advanced biofuel (D5)
" Renewable fuels (non-advanced/conventional) (D6)
Each producer generates a "renewable identification number" (RIN) for each
gal-lon of renewable fuel produced, and in turn the obligated gasoline importers and
refiners must purchase a certain number of RINs (as renewable fuel or as fuel off-sets). Thus, there is an existing market of RINs for each D-code, and the producers
get a per-gallon incentive for producing renewable fuels (calculated on a gallon of
ethanol-equivalent basis). The production of each fuel can have added incentives of
$0.20-$3.00 depending on the market and the fuel type (Figure 2-1). The differences
between assigned codes primarily reflect the feedstock, expected lifecycle greenhouse
gas emission declines, and technological maturity - for instance, ethanol produced from corn starch would be considered a standard renewable fuel (D6) and have a RIN
incentive of $0.19 per gallon, whereas ethanol from food waste or crop residues would
be classified as a cellulosic biofuel (D3) and have a RIN incentive of $2.00 per gallon
[123].
Weekly D3, D4, D5 and D6 RINs Prices
-3 -4 -5 -6 $3.00 $2.00 ----z $1.00 2... 2011 2012 2013 2014 2015 2016 2017 2018
Transfer Date by Week, FUEL (D Code)
Figure 2-1: The market prices for different RINs, reflecting the per-gallon ethanol equivalent incentive that producers receive for producing renewable fuels of different types [123].
2.3.2
Incentives for feed-in renewable electricity
Renewable electricity generation can be incentivized with feed-in tariffs - prices for electricity paid on a per-kWh basis. In the Netherlands, a $0.11/kWh subsidy is
guaranteed for up to 10 years to a plant generating renewable electricity and combined
heat and power (CHP) [40]. In Kenya, there is a $0.12/kWh feed-in tariff for solar
Chapter 3
Utilization of Hurricane Debris for
Biofuel
On September 20th, 2017, Hurricane Maria traveled right through the middle of
Puerto Rico. The Category 4 hurricane left the entire island without power, wiped
out 80% of the island's crop value, covered roads and bridges with impassable
de-bris, flooded communities, and left many without safe drinking water. It took eleven
months for electricity to be restored to the entirety of the island, and the island
con-tinued to experience blackouts in the following months due to mechanical failures, rainfall, and accidents during the repair process [129]. In an independently
commis-sioned study done by George Washington University, 2975 deaths were attributed to
the hurricane's aftermath [78].
The hurricane's 155 mph winds tore through the densely forested island, and
generated massive amounts of debris throughout the island (Figure 3-1). In the
aftermath, the US Army Corps of Engineers had collected 4 million cubic yards of
debris, and they were still grinding the vegetative debris at eight temporary debris
sites as late as eight months later [14]. The tedious process requires the debris to
be cleaned and collected off the roads, delivered to a central gathering site (typically
near a landfill), shredded into chips, delivered to a landfill, and then buried. Of the
nearly $3.77 billion obligated to Puerto Rico for public assistance, $576 million was
Figure 3-1: A picture showing part of the aftermath of Hurricane Maria, which toppled electricity poles, trees, and lines across Puerto Rico and other Caribbean islands.
Photo by Carlos Giusti - AP, taken from Fortune (2017) [98].
Furthermore, Puerto Rico, as is the case with most islands, is nearly exclusively
reliant on fossil fuels for electricity generation, transportation, and heating. 98% of
the island's electricity generation comes from imported petroleum, natural gas, and
coal, and Puerto Rico consumes 97,000 barrels of petroleum products per day [122]
- nearly all of which is imported. After a major storm like Hurricane Maria, the damaged port and transportation infrastructure caused major fuel shortages, which
exacerbated the lack of access to electricity as households and hospitals turned to
diesel generators. A week after the hurricane, nearly half of the island's hospitals
were still out of operation, and 58 of 69 hospitals had no access to fuel or electricity
[34].
This chapter evaluates the potential of using post-disaster biomass debris for
en-ergy, and in particular for the production of high-value energy products such as jet
fuel, heating oil, and ethanol. These biofuels could be stored, used as drop-in fuels,
or used in generators to alleviate energy shortages during the hurricane aftermath,
while also alleviating debris buildup on the island. Disaster cleanup presents a unique
un-wanted biomass debris (which would be otherwise landfilled or burned) and generate
valuable fuels domestically (which would otherwise be imported). Currently, federal
funds allocated to large, organized debris cleanup operations. Instead, we propose
the creation of a debris harvesting operation, wherein a barge-mounted biofuel plant
follows hurricanes and docks at islands and ports where debris is generated. The
barge-mounted plant would integrate into existing debris cleanup operations, with
the added requirement that the debris are transported to the ports, instead of to
landfills, from the typical debris collection sites. This mobile disaster-following plant
would use post-disaster debris as an economic opportunity, and it could turn federal
aid spent every year on debris cleanup into a profitable investment.
A generic biomass transportation model is created to estimate the additional
trans-portation costs and evaluate the benefits of chipping debris directly in the field as
opposed to at collection sites. In addition, a techno-economic model evaluates the
energetic, economic, and greenhouse gas costs for three selected conversion processes
-Fischer-Tropsch synthesis, pyrolysis, and fermentation. The cost accounting includes
the energy conversion processes themselves, feedstock gathering and pre-processing
requirements, and facility and operation requirements. The potential of these
bio-debris utilization processes is presented specifically for Puerto Rico.
3.1
Methods of Debris Disposal and Utilization
The various ways to dispose of and utilize hurricane debris are explored. The debris
itself can have a varied composition, often being a combination of woody wastes, combustible waste, and construction debris mixed together. The USACE estimates
that in general approximately 30% of hurricane debris is clean woody debris, and the
other 70% is mixed construction and demolition debris [32]. On tropical islands, the
ratio of clean woody debris is most likely higher, as FEMA estimated that 60% of the
hurricane debris on the US Virgin Islands after Hurricanes Irma and Maria was clean
woody debris [33]. Additionally, even the clean vegetative debris is often partially
![Table 2.1: Typical yields from popular energy crops, taken from Mckendry (2002) [76].](https://thumb-eu.123doks.com/thumbv2/123doknet/14679217.558794/26.918.233.685.597.757/table-typical-yields-popular-energy-crops-taken-mckendry.webp)