The Design and Manufacture of Immediate-Release
Optimal Solid Dosage Forms
by Aron H. Blaesi
MSc, Mechanical Engineering
Swiss Federal Institute of Technology Zurich, 2009 Submitted to the
Department of Mechanical Engineering
in Partial Fulfillment of the Requirements for the Degree of DOCTOR OF PHILOSOPHY IN MECHANICAL ENGINEERING
at the
MASSACHUSETTS INSTITUTE OF TECHNOLOGY June 2014
© 2014 Aron H. Blaesi. All rights reserved. The author hereby grants MIT permission to reproduce
and distribute publicly paper and electronic copies of this thesis document.
Signature of Author:
Department of Mechanical Engineering May 23, 2014
Certified by:
David E. Hardt Ralph E. & Eloise F. Cross Professor of Mechanical Engineering Doctoral Thesis Committee Chair
Accepted by:
David E. Hardt Ralph E. & Eloise F. Cross Professor of Mechanical Engineering
2
3
The Design and Manufacture of Immediate-Release
Optimal Solid Dosage Forms
by Aron H. Blaesi
Submitted to the Department of Mechanical Engineering on May 23, 2014 in Partial Fulfillment of the Requirements for the Degree of
Doctor of Philosophy in Mechanical Engineering ABSTRACT
Pharmaceutical manufacturing has traditionally been considered largely a matter of regulatory compliance. Consequently, it has been inefficient, but it is now increasingly being recognized as an opportunity for cost reduction. Recent initiatives by regulatory authorities, and by the industry, aim at easing regulations and encouraging process innovation. Even though significant improvements, especially in process control and minimization of process interruptions, have been achieved, the underlying process technology has not changed for decades. For example, typical process steps to produce the most common pharmaceutical products, immediate-release solid dosage forms, from drug substance and excipient are: blending, wet granulating, drying, milling and screening, blending, tableting, coating, and so on. A new process, such as blending combined with solvent-less, multi-component injection-molding could greatly simplify manufacturing. Injection-molding, however, yields a non-porous material, intrinsically different from the state-of-the-art powder-compacted, porous dosage forms. This may appear problematic, because current products rely on a large surface area-to-volume ratio to achieve immediate drug release. In addition, process rates previously achieved by injection-molding solid dosage forms have been comparably low––offsetting some of the benefits offered by that process.
In this thesis, an analytical approach is first developed to model drug release from non-porous dosage forms, comprising a fast eroding excipient and randomly distributed drug particles in it. The model considers the central role of microstructure in drug release. Particular importance is given to the role of clusters of connected, slowly eroding drug particles, and to the effect of drug particle protrusion, due to their slow erosion rate, from the eroding excipient surface. The model is validated by dissolution experiments. Good agreement is observed between the model and the experimental data. The drug release model is then used in product design for manufacturing as an optimization problem––with manufacturing performance as objective function and design specifications as constraints. It is found that the drug volume fraction needs to be about 0.5 to efficiently produce non-porous dosage forms in specification, which implies that an excessive amount of excipient material is required. Therefore, new product designs are proposed: a cellular excipient micro-structure with up to ten-fold reduction in excipient content. The new designs are further shown to allow injection-molding of immediate-release dosage forms that meet specifications with a three-fold increase in injection-molding process rate compared with conventional designs.
Doctoral Thesis Committee:
Prof. David E. Hardt (Committee chair) Prof. Roger D. Kamm (Committee member)
Prof. Rohit Karnik (Committee member) Prof. Charles L. Cooney (Committee member)
4
5
“Any intelligent fool can make things bigger, more complex, and more violent. It takes a touch of genius – and a lot of courage – to move in the opposite direction.”
6
7
ACKNOWLEDGEMENTS
My time at MIT would not have been as wonderful and successful without the support of many people to whom I would like to express my deepest gratitude. First, I would like to thank my thesis committee, Prof. David Hardt (Chair), Prof. Charles Cooney, Prof. Roger Kamm and Prof. Rohit Karnik for their invaluable guidance, perspective, and in-sights. With knowledge, experience, and enthusiasm they rapidly identified gaps and lim-itations in my thinking processes, and helped me approach and solve the underlying chal-lenging engineering problems. I am especially grateful to Prof. David Hardt, for forming and chairing a committee of such distinguished expertise. I am also very grateful to Dr. Nannaji Saka, for many helpful suggestions on several aspects of the thesis. Dr. Saka taught me how to think beyond what I learned in the classroom.
At its very beginnings, this thesis was supported by Novartis AG (Basel, Switzerland), which is gratefully acknowledged. I wish to thank Dr. Markus Krumme and Dr. Norbert Rasenack of Novartis AG for their insights and help in defining the topic of this work. I really enjoyed our meeting in Basel on the stunning Novartis campus.
Also, I am very grateful to Chancellor W. Eric L. Grimson for his kind advise and gen-erous support during my stay at MIT.
I was further privileged to gain professional experience beyond my thesis project. I would like to thank Prof. Franz Hover and my colleagues in the teaching crew of the course Dynamics and Controls II for a very enriching and fun time. Also, I am very grateful to Prof. Cullen Buie, who encouraged me to apply to MIT, and together with his lab members greatly supported me in working on electrochemical problems.
For an amazing time at MIT of exchange, enriching discussions and collaborative learning I am particularly indebted to my ’mates in 35’, the ‘car-team of 2.810’, my quals study-groups, the ‘corporate entrepreneurship-team’, the ‘advanced corporate finance-team’, the ‘operations strategy-finance-team’, the ‘biomedical inventions-team’ chaired by Dr. Warren Zapol and Dr. Rox Anderson, and the ‘Central machine shop-team’. Also, I am indebted to the Mechanical Engineering Graduate Office chaired by Leslie for adminis-trative support during my time at MIT.
8
I would like to thank my friends of whom I would like to highlight the extended group of Martha boys and girls, my Swiss buddies in the area including SwissLinkBoston and Swissnexboston, Mr. Marc Redlich, Esq., and the ‘Legendaers’ for their help and making Cambridge such a great place to live in. My buddies back in Switzerland I would like to thank for staying close even though far away, and for keeping me updated on the good stories from home.
To my family, I would like to express my deepest gratitude for unlimited support in any matter. I would not be where I am without their tremendous help. Finally, I would like to thank Meryem for being simply the best!
9
CONTENTS
Title Page. . . . Abstract . . . . Acknowledgments . . . . List of Figures . . . . List of Tables. . . .CHAPTER I
INTRODUCTION 1.1 Background . . . . 1.2 Thesis Objective . . . . 1.3 Thesis Outline . . . . References . . . .CHAPTER II
ON POROUS AND NON-POROUS IMMEDIATE- RELEASE DOSAGE FORMS2.1 Introduction. . . . 2.2 Specifications of Immediate-Release Solid Dosage Forms . . . . 2.3 State-of-the-Art Design and Manufacturing of Immediate-Release Solid Dosage Forms . . . .
2.3.1 State-of-the-Art Design . . . . 2.3.2 State-of-the-Art Manufacturing Process Technologies . . . . 2.4 Non-Porous Immediate-Release Dosage Forms . . . .
2.4.1 Manufacturing Optimization by Thorough Removal of Waste . . 2.4.2 Value Stream Map for the Manufacture of Non-Porous
Immediate-Release Dosage Forms . . . . 2.4.3 Mixing of API and Excipient . . . . 2.4.4 Injection-Molding to Manufacture Solid Dosage Forms . . . . 2.4.5 Performance of Porous versus Non-Porous
Immediate-Release Dosage Forms . . . 1 3 7 15 23
25
25 30 31 3237
37 37 39 39 41 47 47 48 48 50 5010
2.5 Problem Statement . . . . 2.6 Summary . . . . References. . . .
CHAPTER III
REVIEW OF DRUG RELEASE MODELS OF SOLID DOSAGE FORMS3.1 Introduction. . . . 3.2 Drug Release Mechanisms . . . 3.3 Previous Models of Drug Release. . . .
3.3.1 Non-Swellable Matrix Diffusion Systems . . . 3.3.2 Matrix Swellablle Systems . . . 3.3.3 Surface Erodible Systems . . . 3.3.4 Recent Advanced Models of Drug Release . . . 3.4 Drug Release Mechanism for Non-Porous IR Dosage Form . . . 3.5 Summary . . . Nomenclature . . . References . . .
CHAPTER IV
DRUG DISSOLUTION MODELING OF NON-POROUS,IMMEDIATE-RELEASE DOSAGE FORMS
4.1 Introduction . . . 4.2 Mass Transfer Limited Surface Erosion. . . 4.3 Erosion Rate of Single-Phase Systems . . . 4.3.1 Erosion of Single-Phase Material in Agitated Medium . . . 4.3.2 Erosion of Single-Phase Polymers in Agitated Medium . . . 4.3.3 Erosion of Single-Phase Material in Still Medium . . . 4.4 Erosion of Two-Phase Systems. . .
4.4.1 Relevant Characteristics of Microstructure in Erosion
of Two-Phase Material . . . 4.4.2 Erosion of Two-Phase Material, φ < φ* . . . . 4.4.3 Erosion of Two-Phase Material, φ > φ** . . .
52 54 54
59
59 59 64 65 69 73 74 79 80 81 8389
89 89 91 91 97 100 101 101 106 10911
4.4.4 Summary of Erosion and Drug Release of
Two-Phase Dosage Forms . . . . 4.5 Effect of Surface Roughness on Erosion of Two-Phase Material. . . 4.6 Summary . . . . Nomenclature . . . . References . . . .
CHAPTER V
EXPERIMENTAL VALIDATION OF THE NON-POROUS, IMMEDIATE-RELEASE MODEL5.1 Introduction. . . 5.2 Materials and Methods . . . 5.2.1 Material Selection for Model Validation . . . . 5.2.2 Materials for Sample Preparation. . . 5.2.3 Sample Preparation by Hot-Melt Casting. . . . 5.2.4 Setup for Preparing Injection-Molded Samples. . . 5.2.5 Preparation of Injection-Molded Samples . . . . 5.2.6 Erosion Tests . . . 5.2.7 Dissolution Tests . . . 5.3 Results. . . 5.3.1 Erosion Data. . . . 5.3.2 Dissolution Data. . . . 5.4 Model Validation . . . . 5.4.1 Erosion Rate of PEG . . . 5.4.2 Erosion Rate of the PEG-Aspirin System . . . 5.4.3 Drug Release Flux . . . . 5.5 Summary . . . . Nomenclature . . . References. . . . 111 112 116 117 120
123
123 123 123 124 124 127 129 132 132 136 136 136 147 147 151 157 162 163 16512
CHAPTER VI
MECHANICAL PROPERTIES OF SELECTEDIMMEDIATE-RELEASE EXCIPIENTS
6.1 Introduction. . . . 6.2 Materials and Methods . . . . 6.2.1 Materials for Sample Preparation. . . 6.2.2 Sample Preparation. . . . 6.2.3 Compression Tests on PEG and PEO. . . . 6.2.4 Nanoindentation Tests . . . 6.3 Results . . . 6.3.1 Compression Tests . . . . 6.3.2 Nanoindentation Tests . . . . 6.4 Summary . . . . References. . .
CHAPTER VII
OPTIMAL DESIGN AND MANUFACTURINGMETHODOLOGIES
7.1 Introduction. . . 7.2 Overview of the Design Problem . . . .
7.2.1 Problem Statement . . . . 7.2.2 Reduction of the Design Problem. . . . 7.3 Relevant Objective Functions and Constraints . . . . 7.3.1 Mixing Time. . . . 7.3.2 Mold Cycle Time . . . . 7.3.3 Excipient Cost . . . 7.3.4 Drug Content . . . 7.3.5 Dissolution Time . . . 7.3.6 Geometric Constraints . . . 7.4 The Design of Non-Porous, Immediate-Release Dosage Forms. . . .
7.4.1 Statement of the Optimization Problem . . . 7.4.2 Solution of the Optimization Problem . . . . 7.4.3 Alternative Geometric Designs Based on Non-Porous Material .
167
167 167 167 168 168 172 172 172 178 183 183185
185 185 185 187 195 195 196 198 200 200 201 202 202 203 20813
7.5 Cellular Dosage Forms . . . 7.6 Manufacture of Optimal Solid Dosage Forms. . . . 7.6.1 Concepts for the Manufacture of Non-Porous Dosage Forms. . . 7.6.2 Concepts for the Manufacture of Cellular Dosage Forms . . . . 7.6.3 Integration of the Coating Step into Molding. . . . 7.6.4 Comparison of Manufacturing Performance of Specific
Design Examples . . . . 7.7 Summary . . . . Nomenclature . . . References. . . .
CHAPTER VIII
CONCLUSIONS
APPENDIX A
MECHANICAL PROPERTIES OF CELLULARDOSAGE FORMS
APPENDIX B
THE EXPERIMENTAL SETUP
216 224 224 227 228 231 235 236 239
243
247
249
14
15
LIST OF FIGURES
Figure 1.1 Cost structure in percentage of total revenues: (a) patent-protected pharmaceuticals and (b) generic pharmaceuticals. The costs are subdivided into the units Costs of Goods Sold (COGS), General Expenses (G. Exp.), Research and Develop-ment (R&D), Tax, and Profit.
. . . . 28
Figure 2.1 Schematic of the state-of-the-art design of a coated immediate-release tablet with drug particles embedded in compressed ex-cipient granules giving a large surface area-to-volume ratio.
. . . . 40
Figure 2.2 A typical value-stream map of the state-of-the-art pharmaceuti-cal downstream manufacturing process to produce immediate-release solid dosage forms. It comprises the unit operations blending and granulating, drying, milling and screening, blend-ing, compressing (tableting), and coating.
. . . . 43
Figure 2.3 Value-stream map of the proposed pharmaceutical downstream manufacturing process to produce non-porous immediate-release dosage forms comprising the unit operations feeding and mixing, as well as injection-molding.
. . . . 49
Figure 2.4 Illustration of a powder blender applicable for continuous mix-ing of pharmaceutical powders.
. . . . 51
Figure 2.5 Schematic drawing of an injection molding machine with hy-draulic injection actuation system applicable for producing sol-id dosage forms.
. . . . 51
Figure 2.6 Dissolution of porous and non-porous dosage forms. Powder-based, porous immediate-release dosage forms are rapidly penetrated by dissolution medium causing the dosage form to disintegrate into small particles with large surface-area-to-volume-ratio for rapid drug release. Non-porous dosage forms, by contrast, do not disintegrate into small particles.
. . . . 53
Figure 2.7 Dissolution profile of a standard non-porous dosage form and the desired profile of a non-porous immediate-release dosage form.
. . . . 53
Figure 3.1 Common drug release systems. Dosage forms are illustrated at time t = 0 and at time t = t* in solution. (A) Surface erodible excipients where both drug and excipient dissolve into the
16
solution medium, (B) Matrix-swellable excipients where drug diffuses through swollen excipient into the dissolution medium, (C) Non-swellable excipients where drug diffuses through non-swollen excipient into the dissolution medium and (D) Non-swellable excipients surrounded by a rate-limiting permeable membrane.
Figure 3.2 Common drug release profiles illustrating the normalized ac-cumulated mass of drug released versus time. The rate of drug release, the slope of the curves, is constant in the case of ‘zero order release’, proportional to t-1/2 in the case of ‘t1/2 release’, and equal to τ*exp(-t/τ) in drug release according to 1-exp(-t/τ).
. . . . 63
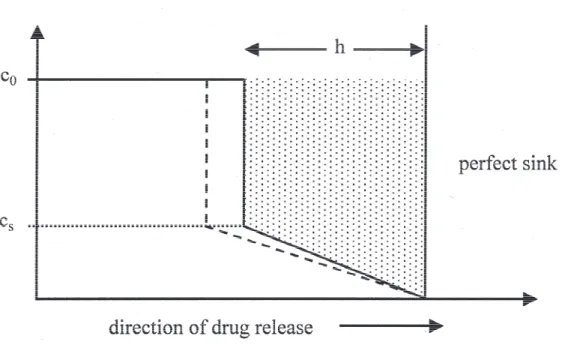
Figure 3.3 Illustration of the Higuchi quasi-steady state model with mov-ing boundary. The drug concentration is initially at the constant value c0, which is larger than its solubility in the ointment
ma-trix, cs. The zone where drug is partially depleted from the
ointment matrix is moving inwards into the center of the oint-ment matrix. In this zone, the concentration profile is assumed linear with the boundary conditions c = cs at the moving
bound-ary and c = 0 on the fixed surface of the dosage form.
. . . . 66
Figure 3.4 Illustration of drug release from a swellable matrix. Dissolution medium at a concentration c0 on the surface of the dosage form
penetrates the dosage form and causes the excipient to swell. Drug on the other hand, which is initially solid at a concentra-tion A0, dissolves upon penetration of the dissolution medium
and diffuses through the swollen excipient outside of the dosage form into the dissolution medium.
. . . . 72
Figure 3.5 Model to simulate erosion of polymer matrices using Monte Carlo techniques. The microstructure of the eroding polymer, consisting of amorphous and crystalline units, is illustrated in a two-dimensional grid. A life expectancy is defined for each unit in the grid, and as soon as a unit comes into contact with the solvent, there is said to be a characteristic time until the unit dissolves. After this characteristic time expired, the unit is as-sumed to dissolve instantaneously and diffuse in positive x-direction out of the matrix. The model is not only applicable to describe combined erosion of multi-phase polymers, but also for multi-phase systems comprising excipient, drug, pores, etc.
. . . . 76
Figure 3.6 Schematic of diffusional drug release from erodible matrices. A is the initial concentration of solid drug inside the dosage form, cs is the solubility of drug inside the dosage form that is
pene-trated by dissolution medium, R(t) is the time-dependent
17
tion of the moving diffusion front, S(t) is the time-dependent position of the moving erosion front, and a is the initial position of the eroding surface.
Figure 4.1 Erosion of single-phase material. At time t = 0, the dosage form is immersed in the dissolution medium. The velocity relative to the dosage form is set to a value equal to v∞, and the viscous
boundary layer and the concentration boundary layer develop.
. . . . 93
Figure 4.2 Viscosity as a function of polymer concentration. The region with polymer concentration below c* refers to dilute solution (a), a polymer concentration between c* and c** refers to semi-dilute solution (b), and a polymer concentration above c** refers to concentrated solution (c). Also illustrated are the upper and the lower bounds of viscosity in the concentration boundary layer with a solid-liquid interface concentration equal to c0.
. . . . 98
Figure 4.3 Illustration of upper and lower bounds of concentration bounda-ry layer thickness, concentration gradient, and liquid solution viscosity. Solid and dashed lines represent upper bound and lower bound of viscosity.
. . . . 98
Figure 4.4 Illustration of the design of a disk-shaped dosage form compris-ing randomly distributed drug particles embedded in a non-porous excipient matrix.
. . . . 102
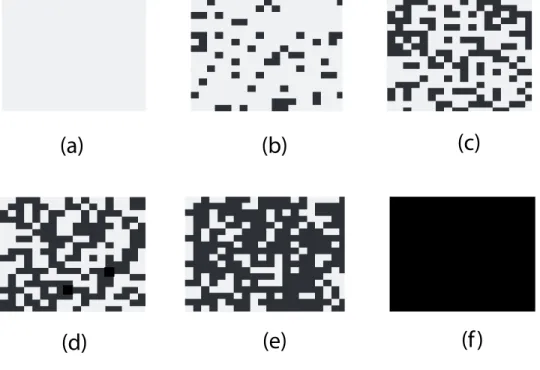
Figure 4.5 Illustration of relevant microstructures of two-phase material with faster eroding phase (gray) and slower eroding phase (black): (a) φ = 0, (b) φ = 0.2, (c) φ = 0.4, (d) φ = 0.6, (e) φ = 8, and (f) φ = 1.
. . . . 105
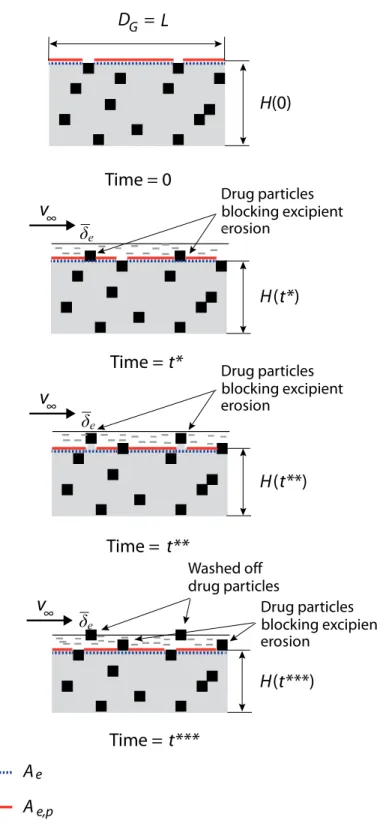
Figure 4.6 Erosion of 2-phase material comprising slowly eroding particles embedded in a rapidly eroding matrix at φ < φ*.
. . . . 107
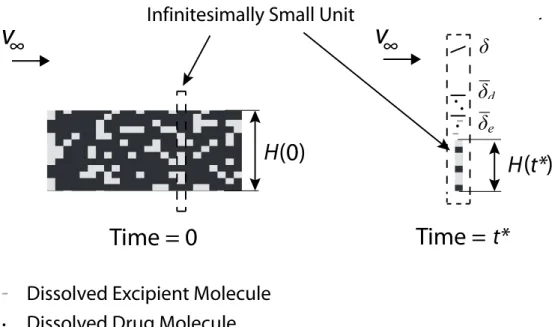
Figure 4.7 Surface erosion of two-phase dosage form at high drug volume fraction. Drug particles cannot be washed off by erosion of their surrounding. An infinitesimally small unit is extracted, and the erosion rate of this infinitesimally small unit follows the erosion rate of the phase on the surface. The average erosion rate of the dosage form equals the average erosion rate of the infinitesi-mally small unit.
. . . . 110
Figure 4.8 Ilustration of the different characteristics of fluid flow in the vicinity of the eroding surface and average excipient concentra-tion boundary layer thickness of the rough surface. The sche-matics above have been drawn based on visualized
18
mental results of fluid flow around such surface profiles. Figure 5.1 Structural formula of polyethylene glycol (PEG) and
polyeth-ylene oxide (PEO). PEGs have a molecular weight below 100,000 g/mol, whereas the molecular weight of PEOs is above 100,000 g/mol.
. . . . 125
Figure 5.2 Structural formula of aspirin. The molecular weight of aspirin is 180 g/mol.
. . . . 125
Figure 5.3 Illustration of the hot-melt casting setup for sample preparation. Top: A hot aliquot which has been placed on the bottom mold. Bottom: The aliquot is compressed, cooled, and solidified to form the finished sample.
. . . . 126
Figure 5.4 Illustration of the injection-molding setup for sample prepara-tion. Top: Schematic of the injection-molding machine. Bot-tom: Schematic of the melting chamber with injection piston and mold.
. . . . 128
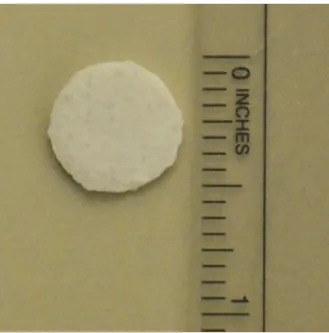
Figure 5.5 PEG-aspirin sample, 1 mm thick and with an aspirin volume
fraction of 0.45. . . . . 131
Figure 5.6 Schematic drawing of the erosion test setup. Also shown is the distance of the outer edge of the sample to the center of rota-tion. This distance is considered here as sample posirota-tion.
. . . . 133
Figure 5.7 Dissolution test setup. . . 135 Figure 5.8 Rotating basket setup for dissolution test. . . . 135 Figure 5.9 Measured erosion rate versus molecular weight of pure PEG
and PEO.
. . . . 138
Figure 5.10 Amount of API dissolved versus time for disks of various thicknesses with a PEG 8,000 matrix at 0.45 API volume frac-tion.
. . . . 140
Figure 5.11 Amount of API dissolved versus time of 1 mm thick disks with a PEG 8,000 excipient matrix at various API volume fractions.
. . . . 141
Figure 5.12 Amount of API dissolved versus time for disks 1 mm thick with 0.17 API volume fraction at various PEG molecular weight ex-cipient matrices.
19
Figure 5.13 Measured erosion rate versus drug volume fraction for the PEG 8k – aspirin, the PEG 20k – aspirin, and the PEO 100k – aspirin system. The data are fitted by linear regression, and the curves have the following R2 values: PEG 8k - aspirin R2 = 0.95, PEG 20k – aspirin R2 = 0.92, PEO 100k - aspirin R2 = 0.92.
. . . . 144
Figure 5.14 Negative value of Δ Erosion rate/ Δ API volume fraction (-dH/dtdφ) obtained from the linear regression curves versus PEG molecular weight.
. . . . 145
Figure 5.15 3-D plot of measured drug release flux versus API volume
frac-tion and PEG molecular weight. . . . . 146
Figure 5.16 Measured erosion rate versus the calculated rate of the
PEG-aspirin system. . . . . 154
Figure 5.17 Measured and modeled values of erosion rate versus API
vol-ume fraction of the PEG-aspirin system. . . . . 156 Figure 5.18 Measured drug release flux versus calculated drug release flux
of the PEG-aspirin system. The coefficient of determination of data points versus linear curve is derived by (a) using all data points (b) excluding data points with calculated drug release flux above 250 mg/m2s.
. . . . 159
Figure 5.19 Measured and modeled drug release flux versus API volume fraction of the PEG-aspirin system.
. . . . 161
Figure 6.1 Illustration of samples for compression test (left) and nanoindentation test (right).
. . . . 170
Figure 6.2 Compression test setup with a sample between the compression platens.
. . . . 170
Figure 6.3 Engineering stress versus engineering strain curves from com-pression tests of melt-processed PEGs and PEO. PEG 1.5k and PEG 8k samples were injection-molded, all others were cast.
. . . . 173
Figure 6.4 Log-log plot of Young’s modulus versus molecular weight for selected injection-molded (IM), cast (CM), and cast and strain-hardened (SH) PEGs and PEOs. The data point for injection-molded PEG 8000 is not considered in the regression analysis.
. . . . 176
Figure 6.5 Log-log plot of yield strength versus molecular weight for selected injection-molded (IM), cast (CM), and cast and strain-hardened (SH) PEGs and PEOs.
20
Figure 6.6 Log-log plot of compressive strength versus molecular weight for selected injection-molded (IM) cast (CM), and cast and strain-hardened (SH) PEGs and PEOs.
. . . . 177
Figure 6.7 Log-log plot of strain at fracture versus molecular weight of selected injection-molded (IM), cast (CM), and cast and strain-hardened (SH) PEGs and PEOs.
. . . . 177
Figure 6.8 Elastic modulus versus mannitol volume fraction of the Kollicoat IR - mannitol composite material.
. . . . 181
Figure 6.9 Hardness versus mannitol volume fraction of the Kollicoat IR - mannitol composite material.
. . . . 181
Figure 6.10 Hardness versus elastic modulus of the Kollicoat IR - mannitol formulation at various mannitol volume fractions.
. . . . 182
Figure 7.1 Melt temperature versus molecular weight of selected excipi-ents commonly used for hot-melt extrusion.
. . . . 189
Figure 7.2 Solubility x diffusivity2/3 of PEGs at various molecular weight,
together with sucrose and mannitol. . . . . 189 Figure 7.3 Properties of PEG relevant for dosage form stability. (a)
Hy-droxyl value of PEGs versus molecular weight. (b) Critical rela-tive humidity, determining the humidity above which water sorption becomes imminent, of selected PEGs.
. . . . 191
Figure 7.4 Mechanical properties of PEG. (a) Elastic modulus versus mo-lecular weight of PEGs along with the elastic modulus of HDPE at a molecular weight of 50,000 g/mol. (b) Yield strength versus molecular weight of PEGs along with the yield strength of HDPE at a molecular weight of 50,000 g/mol. (c) Compressive strength versus molecular weight of PEGs and (d) strain at fracture versus molecular weight of PEGs.
. . . . 192
Figure 7.5 Design of a disk-shaped non-porous dosage form with drug volume fraction, drug particle size, and dosage form geometry as relevant design parameters.
. . . . 194
Figure 7.6 Design space and the design point where drug volume fraction is maximal and dosage form thickness is minimal with a mini-mum thickness constraint of 1.5 mm and a minimini-mum diameter constraint of 3 mm. The drug content is (a) 0.5 mg and (b) 5 mg.
21
Figure 7.7 Design space and the design point where drug volume fraction is maximal and dosage form thickness is minimal with a mini-mum thickness constraint of 1.5 mm and a maximini-mum diameter constraint of 21 mm. The drug content is (a) 50 mg and (b) 500 mg.
. . . . 207
Figure 7.8 Erosion rate versus API volume fraction for selected PEG-aspirin systems derived by combining the model in chapter 4 with the empirical equations shown in section 7.3.1. The curves further indicate the optimal design point for the case with 50 mg drug content given a minimum thickness constraint of 1.5 mm and a maximum dissolution time of 30 minutes (i.e., a min-imum erosion rate of 416 nm/s).
. . . . 209
Figure 7.9 Drug release flux versus API volume fraction for selected PEG-aspirin systems derived by combining the model in chapter 4 with the empirical equations shown in section 7.3.1. The curves further indicate the optimal design point for the cases with 50 mg drug content and 500 mg drug content.
. . . . 209
Figure 7.10 Design space and the design point where drug volume fraction is maximal and dosage form thickness is minimal with a mini-mum thickness constraint of 0.2 mm and a minimini-mum diameter constraint of 1 mm. The drug content is (a) 0.5 mg and (b) 5 mg.
. . . . 211
Figure 7.11 Design examples: case A and case B suitable for non-porous
immediate-release dosage forms at various drug content. . . . . 212 Figure 7.12 Design space for a dosage form design with thin posts or fins
on a square plate with maximum edge length 19 mm according to the structure of case C shown in Fig. 7.13 with α = 1.3 and β = 1.
. . . . 214
Figure 7.13 Design examples: case C and case D suitable for non-porous immediate-release dosage forms at various drug content.
. . . . 215
Figure 7.14 Schematic of structural configurations of cellular excipient in 2-D. The hexagonal shape of the cells is for illustrative purpos-es only. The configurations shown are: (a) closed-cell structure, (b) partially open cell structure, and (c) open cell structure.
. . . . 218
Figure 7.15 Schematic of arrangement of the drug particles in the dosage form: (a) particles inside the walls of the cellular structure with d < h0, (b) particles inside the voids of the cellular structure,
(c) particles inside the walls of the cellular structure with d > h0,
22
l > d, and (d) particles inside the walls of the cellular structure with d > h0, l < d.
Figure 7.16 Schematics of melt-processed, optimal solid dosage forms with a drug volume fraction of about 0.55, a void volume fraction of about 0.4 and an excipient volume fraction of about 0.05: (a) a high density skin with thickness Hs comprises the dosage form
surface with the same composition as the core material, and (b) a coating with different composition than the core at thick-ness Hs comprises the dosage form surface.
. . . . 223
Figure 7.17 Illustration of manufacturing concepts to produce the design examples suitable for non-porous immediate-release dosage forms at various drug content.
. . . . 226
Figure 7.18 Illustration of an injection-molding sequence to produce a coat-ed solid dosage form by the concept of overmolding.
. . . . 229
Figure 7.19 Schematic of a multi-component injection-molding machine to produce coated dosage forms by overmolding. Coating injec-tion on the left is considered side 2, whereas API and coating injection on the right is considered side 1 of the machine.
. . . . 229
Figure 7.20 Comparison of manufacturing performance measures of the state-of-the-art continuous downstream processes (black) with the injection-molding process to manufacture non-porous dos-age forms (dark gray) and the cellular molding process to pro-duce cellular dosage forms (light gray). (UO) number of unit operations, (PT) process time, (PR) process rate, (E) amount of excipient required and (S) amount of solvent required.
. . . . 234
Figure B.1 Illustration of the injection-molding machine for preparation of injection-molded samples.
23
LIST OF TABLES
Table 2.1 Typical specifications of immediate-release solid dosage forms given by the regulator. The requirements are listed after the re-lease of the batch as well as after the stability retest, where the product has been exposed to accelerated storage conditions for a prolonged period of time.
. . . . 38
Table 2.2 Unit operations, typical equipment, and process times of the state-of-the-art batch (B) and continuous (C) pharmaceutical downstream processes.
. . . . 45
Table 5.1 Material, geometric, and process parameters for sample prepa-ration of erosion and dissolution tests. Erosion test samples were cast, whereas samples for dissolution tests were injection-molded (IM). Aspirin was used as API.
. . . . 130
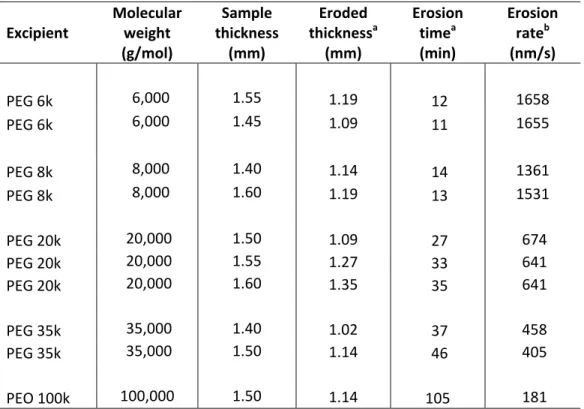
Table 5.2 Experimental conditions of erosion and dissolution tests. . . . 134 Table 5.3 Erosion time and erosion rate of pure PEG and PEO. . . . 137 Table 5.4 API release time, erosion rate, and API release flux of
PEG/PEO–aspirin solid dosage forms.
. . . . 142
Table 5.5 Properties of selected polyethylene glycols. . . . 149 Table 5.6 Relevant parameters and their values used for model validation. . . . 150 Table 5.7 Measured and calculated erosion rates of PEG/PEO–aspirin
dosage forms. . . . . 153
Table 5.8 Measured and calculated API release flux of PEG/PEO–aspirin
solid dosage forms. . . . . 158
Table 6.1 Material, geometric, and process parameter values applied for sample preparation. Aspirin was used as API.
. . . . 169
Table 6.2 Experimental parameters of the compression test. . . . 171 Table 6.3 Experimental parameters of the nanoindentation test. . . . 171 Table 6.4 Mechanical properties of PEG and PEO from compression
24
Table 6.5 Young’s modulus and hardness of selected melt-processed ex-cipients and composites with mannitol, which here represents API.
. . . . 180
Table 7.1 Overview of the design problem with design variables, design objectives, and design constraints for producing non-porous immediate-release dosage forms.
. . . . 186
Table 7.2 Estimated times required for the individual molding steps . . . 199 Table 7.3 Design point that minimizes the mass of excipient required and
mixing time.
. . . . 205
Table 7.4 Design point that minimizes cooling time. . . . 205 Table 7.5 Molding steps to produce uncoated (uc) and coated dosage
forms according to the various design concepts co-injection molding (co-im) and overmolding (om).
. . . . 230
Table 7.6 Estimated mold cycle times to produce uncoated (uc) and coat-ed dosage forms by to the concepts of co-injection molding (co-im) and overmolding (om). Estimates are based on the molding steps and the respective times shown in Table 7.5 and Table 7.2.
. . . . 230
Table 7.7 Comparison of process performance for the manufacture of po-tent and highly popo-tent drugs.
. . . . 232
Table 7.8 Comparison of process performance for the manufacture of low potency drugs.
25
CHAPTER I
INTRODUCTION
1.1 Background
The pharmaceutical industry, dedicated to producing medicines mainly in the form of tablets, capsules, injections, powders, syrups, and ointments, has been one of the most profitable and fastest growing industries for decades. It was ranked second by the Fortune magazine in terms of global industry profitability in 2009, just behind mining and crude oil production [1,2]. Global sales exceeded 950 billion USD in 2012. The economic suc-cess and the characteristics of the pharmaceutical industry are the legacy of several regu-lations and discoveries since the Great Depression.
Even though many drug products existed before the second world war, the number of basic medicines available was small and included mostly medicines that could relieve symptoms by easing pain or inducing sleep. A breakthrough that triggered the structural transformation of the industry from a manufacturing-focused producer of selected chemi-cals to a research-oriented sector was the discovery of antibiotics. Penicillin was the most important such molecule, and it became first available for practical purposes after 1940. The scientific discoveries were followed by the decision of the US patent office that the use of molds to produce antibiotics could be patented. This incentivized drug compa-nies to heavily invest in research to find treatments for the sheer magnitude of unmet medical needs. As a result, what is now called the period of ‘therapeutic revolution’ was launched and by 1950 well and truly under way. Corticosteroids, antihistamines, antide-pressants, diuretics, and many other drug preparations helping to alleviate human ailment were discovered and developed during that time. The increase in drug discoveries was also reflected in patent activities. For example, the number of pharmaceutical patents, the majority product patents instead of process patents, grew from 138 in the period 1926-1930 to above 1500 in the period 1951-1955.
26
The rapid introduction of novel pharmaceutical products between 1940 and 1960 pre-sented great social benefits in that great contributions to modern treatment of diseases were made. However, there were clear social costs offsetting these benefits to pharma-ceutical innovation. Long-term adverse side effects of certain medicines, which could initially not be detected by physicians, patients, and often even the pharmaceutical firms, occasionally led to disastrous results. As a consequence of such social cost, national gov-ernment regulation of product safety and efficacy has emerged in all developed countries. In the US, for example, a series of requirements have been issued since 1962, including regulations to specify good manufacturing practice (GMP), preclinical guidelines for tox-icity testing, regulations that specify requirements for well-controlled investigations to produce substantial evidence of a product’s efficacy, and others. Subsequent to the intro-duction of these regulations, the number of new drug approvals per year dropped signifi-cantly, and the industry was concentrated among larger firms. Competition in the indus-try, however, was still dominated by research and innovation in that a more efficacious or a better-marketed product would replace its predecessor [3-7].
A legislation introduced in 1984, which significantly changed the competitive dynam-ics of the pharmaceutical industry, was the Hatch-Waxman Act [8-14]. Hatch-Watchman amendments were released upon the continuous political debate on drug prices. They aimed at providing affordable, high-quality medicines by easing some of the previously made stringent product testing requirements for market entry by generic drugs. The ge-neric drug industry developed since then has focused on producing off-patent drugs. The characteristics of the generic drug industry are fundamentally different from the innova-tor drug industry in that competition is to a large extent by product price instead of prod-uct innovation. Generics tended to enter the market at wholesale prices 40 - 70% of those prevailing before the original drug’s patent expired, and the generic price could fall be-low 20% of the pre-competition price if more competitors entered. By 2005, the share of US generic prescription units (i.e., tablets) increased from about 19% to about 60%, whereas the generic market share in dollars was about 20% in 2005. As a result of such changes in regulations for market access of generic products, the pressure on drug prices has increased, saving the consumers double digit billions of dollars every year [15]. Apart from the availability of inexpensive generic substitutes, new managed care net-
27
works and governmental price regulations that emerged in the 1980s and 1990s further put drug prices under scrutiny. At the same time, research expenditures were growing at high rates, but the number of approved drugs per year did not increase. Still today, the pharmaceutical industry environment is characterized by increasing generic competition, increasing bargaining power of buyers, and declining R&D productivity. Consequently, both innovator and generic drug companies are forced to reduce the costs of their internal processes in order to maintain high profit margins [7].
The present cost structure in the pharmaceutical industry is illustrated in Fig. 1.1, with the costs of goods sold (COGS), general expenses (G. Exp.), and research and develop-ment expenses (R&D) as main cost drivers. The costs of goods sold account for about 24% of revenues of innovator pharmaceutical companies and about 50% of revenues of generic drug companies [16]. They consist to a large extent of the manufacturing costs, which in total (including upstream and downstream processes) today amount to about 200 billion USD per year. Reducing pharmaceutical manufacturing costs by pharmaceutical manufacturing process innovation therefore could free up resources for generic producers to strengthen their position, and for innovator companies to invest in marketing and re-search in order to capitalize on opportunities in emerging markets and unmet medical needs [17-19].
Excellence in manufacturing has in several industries led to superior performance far beyond the optimization of COGS [20-22]. Simplification of manufacturing operations has shown significant reductions in product and process development time and costs, re-ductions of the environmental footprint, and improvement of traceability and product quality, just to name a few. Moreover, excellence in manufacturing is difficult to imitate. The Toyota Motor Corporation, for example, which between 1950 and 1980 pioneered lean manufacturing (i.e., a new way of highly efficient manufacturing), still is one of the most successful car companies in the world. It showed the highest net profit as well as the highest market capitalization among global car companies by a considerable margin in 2005 [23].
Optimization of pharmaceutical manufacturing, however, was up to recently an expen-sive and risky undertaking. Particularly, extenexpen-sive supplemental documentation, in-creased FDA inspection, and the risk of production delays were feared if changes in
28
(a) (b)
Figure 1.1: Cost structure in percentage of total revenues: (a) patent-protected pharma-ceuticals and (b) generic pharmapharma-ceuticals. The costs are subdivided into the units Costs of Goods Sold (COGS), General Expenses (G. Exp.), Research and Development (R&D), Tax, and Profit. (Data from Ref. [16]).
36% G. Exp. 19% Profit 6% Tax 15% R&D 24% COGS 21% G. Exp. 50% COGS 8% R&D 6% Tax 15% Profit
29
process technology were made in this highly regulated manufacturing environment. In 2000, GMPs that were considerably modified last in 1978, were still in use. Fundamental innovations in process technology have not been made in the period between 1978 and 2000. Consequently, the performance of traditional pharmaceutical manufacturing is be-low the one of other comparable industries, such as the food or chemical industries [24]. Most noticeably, it was found that the cycle time of traditional pharmaceutical down-stream manufacturing, which simply consisted of the process steps to manufacture an oral pharmaceutical tablet out of the raw materials drug substance (i.e., active pharmaceutical ingredient (API)), excipients, and other processing aids, was above 25 days on the aver-age with a standard deviation of the same order of magnitude [18,25]. It was further re-markable that the sum of the effective process times of the individual processes was just a small part of the measured, average cycle time, whereas most time was spent on off-line quality control (QC).
The inefficiencies in pharmaceutical manufacturing, and limited incentives for process innovation, have induced the FDA together with the industry to develop an important new initiative – Pharmaceutical cGMPs for the 21st Century: A Risk-Based Approach. This initiative simplifies regulations of process innovation if Quality by Design (QbD) principles are applied (i.e., product understanding, process understanding, and process control based on sound science and quality risk management) [26-29].
These new regulations have caused industry and academia to heavily devote resources to the optimization of pharmaceutical manufacturing, which currently is expensive and inefficient. The most important advances that have been made, and to a certain extent im-plemented since the release of the new initiative, are in in-process and online quality con-trol. QbD principles together with process analytical technologies (PAT) even allowed the development of pharmaceutical processing in an integrated, continuous way. Contin-uous manufacturing can eliminate several inefficiencies intrinsic to the traditional batch processes. Most noticeably, equipment utilization and quality control processes are opti-mized resulting in the improvement of a variety of manufacturing performance measures [30-38]. The physical principles of the underlying pharmaceutical downstream manufac-turing process technologies, however, to a large extent still have not been further devel-oped. Optimization of pharmaceutical downstream manufacturing within the space of
30
traditional process technologies is limited, and a fundamental technological change is re-quired to achieve significant improvements in pharmaceutical downstream manufacturing performance beyond the benefits of state-of-the-art continuous manufacturing.
1.2 Thesis Objective
The focus of this work is on the design and manufacture of immediate-release solid dosage forms. Immediate-release solid dosage forms belong to the most standard drug products. Most often, they are in the form of orally delivered pharmaceutical tablets or capsules. Moreover, immediate-release solid dosage forms are typically the first way to deliver a new drug that can be administered orally, and further are desirable for several therapeutic reasons, such as immediate pain relief or control of blood sugar levels.
It is well known that the manufacturing efforts required to produce a specific product are to a large extent determined by product design. Therefore, product design considered here is crucial to enable manufacturing improvement. Alternative designs of immediate-release solid dosage forms that are fundamentally different from the state-of-the-art are studied in this thesis. They consist of non-porous or cellular materials instead of the pow-der-based, porous bulk of current products. Consequently, a broad space of alternative manufacturing processes that could potentially be applied to produce such product de-signs is opened up. In turn, significant improvements in manufacturing efficiency are of-fered, far beyond the opportunities using state-of-the-art technologies.
The objective of this thesis is to develop a methodology which, based on the desired product properties, allows to determine the specifics of the non-porous or cellular drug design for optimal product performance at improved downstream manufacturing efficien-cy. Accordingly, the aspects emphasized on in this work are to: (a) investigate the rele-vant parameters that affect product performance, and the dependence of product perfor-mance on these parameters, (b) investigate the relevant parameters to affect manufactur-ing efficiency, and the dependence of manufacturmanufactur-ing efficiency on these parameters, and (c) identify the optimal non-porous or cellular designs to improve product performance and manufacturing efficiency for given product requirements.
31
1.3 Thesis Outline
Chapter 2 presents the specifications of immediate-release solid dosage forms together with the state-of-the-art powder-based, porous immediate-release dosage form design and respective manufacturing technologies. Subsequently, non-porous immediate-release dosage forms are discussed, in terms of the process value stream map and manufacturing processes, and in terms of their performance and ability to meet the specifications of im-mediate-release dosage forms.
In Chapter 3, present drug release models of solid dosage forms are reviewed. First, drug release mechanisms that characterize the physical phenomena by which drug is re-leased from the solid dosage form are given. State-of-the-art mathematical models to de-scribe drug release, particularly for non-swellable matrix diffusion, matrix swellable, and surface erodible systems are then presented. Finally, the suitable mechanism for non-porous immediate-release dosage forms is identified.
A new model for drug release of non-porous immediate-release dosage forms based on mass transfer limited surface erosion is developed in Chapter 4. The erosion rate and mass transfer rate of a surface eroding disk is first derived for single-phase systems. The model is then extended to systems of multiple phases. Specifically, equations to describe drug release from a disk consisting of drug and excipient are developed. Moreover, ef-fects of surface roughness which arise during erosion of the drug-excipient composite disk are discussed.
Chapter 5 addresses experimental validation of the non-porous, immediate-release model. Materials and methods applied for sample preparation and execution of erosion and dissolution experiments are first described. The experimental results so obtained are then presented and the immediate-release model developed for the rate of drug release, as well as erosion rate and dissolution time is validated based on the experimental data. Immediate-release solid dosage forms must have satisfactory mechanical properties for processing and handling. Thus in Chapter 6, the mechanical properties of selected imme-diate-release excipients and composite materials are presented.
32
In Chapter 7, designs for optimal immediate-release solid dosage forms are developed. The design guidelines are found by combining manufacturing efficiency objective func-tions with design specificafunc-tions along with the previously developed dissolution model. A set of optimal designs with unique features and manufacturing processes are presented. Finally, in Chapter 8 the salient conclusions of the present work are summarized.
References
[1] From the website: http://www.imshealth.com/deployedfiles/imshealth/Global/... Content/Corporate/Press%20Room/Total_World_Pharma_Market_Topline_...
metrics_2012.pdf, as of February 1, 2014.
[2] From the website: http.//money.cnn.com/magazines/fortune/global500/2009/… performers/industries/profits, as of February 1, 2014.
[3] P. Temin, 1978, The evolution of the modern pharmaceutical industry, MIT Press, Cambridge, MA.
[4] P. Temin, 1980, Taking Your Medicine: Drug Regulation in the United States, Harvard University Press. Cambridge, MA.
[5] Committee on Technology and International Economic and Trade Issues of the Office of the Foreign Secretary, Commission on Engineering and Technical Science, National Research Council, 1983, The Competitive Status of the U.S. Pharmaceutical Industry: The Influences of Technology in Determining Interna-tional Industry Competitive Advantage, NaInterna-tional Academy Press, Washington, DC.
[6] W.D. Reekie, 1975, The Economics of the Pharmaceutical Industry, The Macmil-lan Press LTD, London, UK.
[7] G.P. Pisano, 1997, The Development Factory: Unlocking the Potential of Process Innovation, Harvard Business School Press, Boston, MA.
[8] R.E. Caves, M.D. Whinston, M.A. Hurwitz, Patent Expiration, Entry, and Compe-tition in the U.S. Pharmaceutical Industry, Brooking Papers on Economic Activi-ty: Microeconomics, 1991, 1-48.
[9] H. Grabowski, J.M. Vernon, Brand Loyalty, Entry, and Price Competition in Pharmaceuticals after the 1984 Drug Act, J. Law Econ., 1992, 35, 331-350.
33
[10] F.M. Scherer, The Pharmaceutical Industry, in A.L. Culyer, J.P. Newhouse, 2000, Handbook of Health Economics, Elsevier.
[11] R.G. Frank, D.S. Salkever, Generic Entry and the Pricing of Pharmaceuticals, Journal of Economics and Management Strategy, 1997, 6, 75-90.
[12] E.R. Berndt, The U.S. Pharmaceutical Industry: Why Major Growth in Times of Cost Containment?, Health Affairs, 20, 100-114.
[13] D. Reiffen, M.R. Ward, Generic Industry Dynamics, The Review of Economics and Statistics, 2005, 87, 37-49.
[14] T.L. Regan, Generic Entry, Price Competition, and Market Segmentation in the Prescription Drug Market, International Journal of Industrial Organization, 2008, 26, 930-948.
[15] A.A. Signore, T. Jacobs, 2005, Good Design Practices for GMP Pharmaceutical Facilities, Taylor & Francis Group, Boca Raton, FL.
[16] P. Basu, G. Joglekar, S. Rai, P. Suresh, J. Vernon, Analysis of Manufacturing Costs in Pharmaceutical Companies, J. Pharm. Innov., 2008, 3, 30-40.
[17] P. Suresh, P.K. Basu, Improving Pharmaceutical Product Development and Manufacturing: Impact on Cost of Drug Development and Cost of Goods Sold of Pharmaceuticals, J. Pharm. Innov., 2008, 3, 175-187.
[18] T. Friedli, M. Kickuth, F. Stieneker, P. Thaler, J. Werani, 2006, Operational Ex-cellence in the Pharmaceutical Industry, Editio Cantor Verlag, Aulendorf, Germa-ny.
[19] G.K.P. Raju, 1994, Pharmaceutical Manufacturing: Structuring Organizational Learning Through “Benchmarking”, Master’s Thesis, Massachusetts Institute of Technology, Cambridge, MA.
[20] R.H. Hayes, S.C. Wheelwright, 1984, Restoring our Competitive Edge Competing Through Manufacturing, John Wiley & Sons, Hoboken, NJ, USA.
[21] G.P. Pisano, Knowledge, Integration, and the Locus of Learning: An Empirical Analysis of Process Development, Strategic Management Journal, 1994, 15, 100.
[22] R.H. Hayes, G.P. Pisano, Manufacturing Strategy: At the Intersection of two Par-adigm Shifts, Production and Operations Management, 1996, 5, 25-41.
[23] S.L. Beckman, D.B. Rosenfield, 2008, Operations Strategy Competing in the 21st Century, McGraw-Hill, New York, NY.
34
[24] L. Abboud, S. Hensley, New Prescription for Drug Makers: Update the Plants, The Wall Street Journal, September 3, 2003.
[25] G.K. Raju, Pharmaceutical Manufacturing: New Technology Opportunities, FDA Science Board Meeting, 2001.
[26] U.S. Department of Health and Human Services, 2004, Pharmaceutical cGMPs for the 21st century – A risk-based approach, Final report, Food and Drug
Admin-istration, Rockville, MD.
[27] U.S. Department of Health and Human Services, 2004, Guidance for industry: PAT – A framework for innovative pharmaceutical development, manufacturing, and quality assurance, Food and Drug Administration, Rockville, MD.
[28] A. Hussain, A Final Report on PAT and Manufacturing Science, FDA Science Board Meeting, 2004.
[29] M. Narhi, K. Nordstrom, National GMP Regulations and Codes and International GMP Guides and Guidelines: Correspondences and Differences, in S.C. Gad, 2008, Pharmaceutical Manufacturing Handbook: Regulations and Quality, John Wiley & Sons, Hoboken, NJ.
[30] H. Leuenberger, New Trends in the Production of Pharmaceutical Granules: Batch vs. Continuous Processing, Eur. J. Pharm. Biopharm, 2001, 52, 289-296. [31] A.A. Signore, T. Jacobs, 2005, Good Design Practices for GMP Pharmaceutical
Facilities, CRC Press, Boca Raton, FL.
[32] L. Pernenkil, C.L. Cooney, A review on the continuous blending of powders, Chem. Eng. Sci., 2006, 61, 720-742.
[33] R.P. Cogdill, T.P. Knight, C.A. Anderson, J.K. Drennen, The financial returns on investment in process analytical technologies and lean manufacturing: Bench marks and case study, J. Pharm. Innov., 2007, 2, 38-50.
[34] R. Singh, M. Ierapetritou, R. Ramachandran, An engineering study on the en-hanced control and operation of continuous manufacturing of pharmaceutical tablets via roller compaction, Int. J. Pharm., 2012, 438, 307-326.
[35] K.V. Gernaey, A.E. Cervera-Padrell, J.M. Woodley, A perspective on PSE in pharmaceutical process development and innovation, Comput. Chem. Eng., 2012,
42, 15-29.
[36] G.M. Troup, C. Georgakis, Process systems engineering tools in the pharma-ceutical industry, Comput. Chem. Eng., 2013, 51, 157-171.
35
[37] R.P Cogdill, Case for Process Analytical Technology: Regulatory and Industrial Perspectives, in S.C. Gad, 2008, Pharmaceutical Manufacturing Handbook: Regulations and Quality, John Wiley & Sons, Hoboken, NJ.
[38] T. Friedli, M. Goetzfried, P. Basu, Analysis of the Implementation of Total Productive Maintenance, Total Quality Management, and Just-In-Time in Phamaceutical Manufacturing, J. Pharm. Innov., 2010, 5, 181-192.
36
37
CHAPTER II
ON POROUS AND NON-POROUS IMMEDIATE-RELEASE
DOSAGE FORMS
2.1 Introduction
In this chapter, the specifications of immediate-release solid dosage forms are first listed. State-of-the-art powder-based, porous immediate-release dosage form designs and manufacturing process technologies are then reviewed. Subsequently, the advantages and disadvantages of non-porous, immediate-release dosage forms are discussed in terms of the process value-stream map and manufacturing efficiency, and in terms of the non-porous immediate-release dosage form’s performance and capability to meet the specifi-cations.
2.2 Specifications of Immediate-Release Solid Dosage Forms
As with most pharmaceutical products, immediate-release solid dosage forms are as-signed measurable technical specifications, which guarantee a product’s efficacy and safety once the performance of the API it contains has been proven in clinical studies. The specifications are highly regulated. Detailed specifications of US-marketed immedi-ate-release solid dosage forms are defined in the United States Pharmacopeia and in guidelines published by the International Conference on Harmonisation (ICH). They de-termine testing methods and acceptance criteria for drug product critical quality attributes [1-7]. Such attributes include the amount of active substance in the dosage form, uni-formity of dosage units (i.e., the coefficient of variation in the amount of the active sub-stance), dissolution time (i.e., the time it takes to dissolve the active ingredient contained in the drug product), level of impurities, hardness/friability, water content, and microbial limits. Table 2.1 lists an overview of testing methods and acceptance criteria that can be considered as reference standard for immediate-release tablets and capsules.
38
Table 2.1: Typical specifications of immediate-release solid dosage forms given by the regulator. The requirements are listed after the release of the batch as well as after the stability retest, where the product has been exposed to accelerated storage conditions for a prolonged period of time.
Test Method Requirements release Batch Stability retest
Description Appearance by visual examination Shape, color, surface according to product description + +
Identity UV, HPLC Corresponds to the reference + -
Mean mass Weighing scale According to USP + -
Dissolution UV-Dissolution
Not less than 80% of the declared content in 30 mins, according to the acceptance table of USP
+ +
Water content Karl Fischer titration < 5% +
Water content Karl Fischer titration < 6% - + Residual
solvent HPLC
According to the document ICH Q3C, depending on the class of the solvent
+ -
Degradation
products HPLC
According to the document ICH
Q3B, depending on drug content + +
Uniformity of dosage units
Uniformity of dosage units by content uni-formity
Coefficient of variation in drug content (CV) < 5%, or according to USP
+ -
Assay by
HPLC HPLC 95%-105% of the declared content + +
Microbial limits
Total aerobic microbial count, Total yeast and mold count, etc.
Meet the requirements of Ph. Eur.,
39
It is possible though that the details of such testing methods and acceptance criteria deviate from the usual case presented in Table 2.1. This happens particularly if the manu-facturer and regulatory agencies agree that different specifications or testing methods are to be used to guarantee the product’s safety and efficacy (i.e., product quality).
The specifications need to be met throughout the shelf life of the drug product. At the time of registration, however, shelf-life stability testing is often not completed. Statistical extrapolation of limited stability data to the proposed shelf life is therefore the standard practice [8]. Finally, in addition to the specifications that guarantee a product’s continu-ing safety and efficacy, the product needs to be patient compliant. Conventional tablets and capsules, for example, need to be of a certain size, shape, and taste in order to be ap-pealing and easy to swallow.
2.3 State-of-the-Art Design and Manufacture of Immediate-Release
Solid Dosage Forms
2.3.1 State-of-the-Art Design
Immediate-release solid dosage forms in the configuration of a tablet or capsule today are powder-based materials with porous bulk containing excipients and drug at the speci-fied content [9-12]. The framework of state-of-the-art product designs is illustrated in Fig. 2.1, where the drug volume fraction, the product geometry, the drug particle size, the granulated excipient particle size, the porosity, and the coating formulation and thickness are design parameters. These parameters typically need to be within a moderately tight window in order for the product to satisfy the specifications. Drug volume fraction and drug particle size, for example, need to be such that the product contains the specified drug amount at the desired content uniformity. Physicochemical properties along with the porosity and size of granulated excipient particles and API particles must allow immedi-ate dissolution of the API. Product size, shape and coating thickness must be within a range that gives a patient compliant product and sufficiently fast API dissolution.
40
Figure 2.1: Schematic of the state-of-the-art design of a coated immediate-release tablet with drug particles embedded in compressed excipient granules giving a large surface area-to-volume ratio. Hs H0
.. .
.
.
.
.
.
. . .. .
.
.
.
.
.
. .
.. .
.
.. .
.
. . ..
.
..
.
.
.
.
.
.. .
.
.
.
.
.
. . .. .
.
.
.
.
.
. .
.. .
.
..
.
.
.
. .. .
.
.. .
.
. .
.. .
.
.. .
.
. .
. .
.. .
. .
.. .
.
.. .
.
. . . .
.
.. .
.
. .
.. .
.
.
.
.. .
.
.. .
.. . .
.
.. .
.
. . .. .
.
.. .
.
.
.. .
. . .. .
.
.. . .. .
. . .. .
.
.. . ...
.
... .. .
.. . ..
.
D.
.
.
.
.
..
.
.
.
. .
.
.
.
.
.
.
.
.
.
..
.
Micro-Pore Drug particle at sizeGranulated excipient particle at size Macro-Pore G
.
G d d
,
d
41
The state-of-the-art product design is well suited to meet the specifications of immedi-ate-release solid dosage forms. Most importantly, the porous, hydrophilic nature of the state-of-the-art bulk material enables the dissolution medium to rapidly wet and penetrate the pores. Even though the compressed granulated particles are agglomerated in the dry state, they deagglomerate once in contact with the dissolution medium, causing the prod-uct to lose mechanical strength and disintegrate. This creates an extraordinarily large par-ticle-dissolution medium interface (i.e. surface area), and it significantly reduces distanc-es of drug mass transfer within the excipient matrix. Both the rdistanc-esulting large surface area and the reduced drug mass transfer distances within the excipient give a large surface area-to-volume ratio with fast dissolution rate to guarantee that the product meets specifi-cations of immediate-release [13].
An additional advantage of current designs is their high flexibility in terms of drug content. Typically, constraints on dissolution, hardness/friability, and manufacturability currently limit the maximum drug mass- and volume fraction to a range of about 0.5 - 0.9, whereas the minimum drug mass- and volume fraction can be as low as 0.001. This allows the design of products with a large range in drug content, from less than 0.5 mg API to above 500 mg API, within the desired swallowable product dimensions.
2.3.2 State-of-the-Art Manufacturing Process Technologies
For most of the past, pharmaceutical manufacturing has been done by a batch process. The traditional batch process gives high flexibility in the equipment use and process pa-rameters applied. However, it accounts for low equipment utilization and hence large equipment idle times, scale-up challenges, and often manual, time-consuming quality control. These inefficiencies, particularly in the manufacture of high volume products, have led the industry, with the support of regulatory authorities, to develop new process analytical technologies (PAT) that allow automated, integrated quality control. This opened opportunities for integrated, continuous pharmaceutical manufacturing systems that are now commercially available [14-18].
Even though tremendous improvements in equipment utilization, quality control pro-cesses, and scale up complications can be achieved by applying continuous
manufactur-42
ing technologies, manufacturing of the state-of-the-art immediate-release tablets is far from straightforward. The major reason for pharmaceutical manufacturing being a com-plicated process lies in the current product design. It relies, for example, on a material based on compressed powder, which prior to compression needs to be thoroughly pre-pared for it to possess the required properties on particle size, flowability, wettability, compressibility, and uniformity.
A value-stream map of the standard state-of-the-art pharmaceutical downstream manu-facturing process is illustrated in Fig. 2.2. Raw API and excipient powder at the required particle size are fed into the manufacturing system which outputs a coated product, con-sisting of such unit operations as blending and granulating, drying, milling and screening, blending, tableting, and coating [5,19,20]. Further, solvents are usually added to the sys-tem to support the unit operations granulation and coating. The technical specifics of the present process steps are briefly outlined below. Table 2.2 gives an overview of state-of-the-art equipment used along with process times of the individual process steps of both batch and continuous processes.
Blending and Granulating: Blending and granulating is a crucial step in the manufac-ture of a drug product. It is accountable for mixing API and excipient to the required uni-formity. Also, it provides the mixture the physical and physicochemical properties need-ed to achieve the desirneed-ed product performance and efficient further downstream pro-cessing. Wet granulation, the most commonly applied granulation process, in most batch processing cases is done using a high shear granulator. High-shear granulators can also be used for powder blending prior to wet granulation. They consist of a mixing bowl with a main impeller revolving in the horizontal plane, an auxiliary chopper revolving in either the vertical or horizontal plane, and a nozzle that allows controlled solvent addition. Blending and wet granulation is a three-stage process comprising a dry powder blending stage, a solvent infusion stage, and a wet mass stage to generate granules of API and ex-cipient at uniform size [21,22]. The total process time of blending and wet granulating using a high shear granulator is typically 20 – 90 minutes.
An alternative equipment technology that allows granulation in a continuous manner at minimum equipment idle time, hence high equipment utilization, is pharmaceutical extru-sion [21]. Pharmaceutical extruders are typically designed as either single screw or twin
43
Figure 2.2: A typical value-stream map of the state-of-the-art pharmaceutical down-stream manufacturing process to produce immediate-release solid dosage forms. It com-prises the unit operations blending and granulating, drying, milling and screening, blend-ing, compressing (tableting), and coating.
Blending & Granulating Drying Milling & Screening
Compressing (Tableting) Coating & Drying Drug Product
API Excipients
Wet Granules
Dry Air Solvent
Moist Air Excipients
Blending Dry Granules Dry Powder
Final Powder Formulation
Compressed Tablet Coated tablet Coating Solution Dry Air Moist Air Mw,1 Mw,1 ME,1 MD ME,2 Mw,2 Mw,2, ME,3 Coating Waste Wet Granulator

![Figure 2.4: Illustration of a powder blender applicable for continuous mixing of pharma- pharma-ceutical powders [source: http://www.scottequipment.com/HST-continuous-blender.html, as of February 4, 2014]](https://thumb-eu.123doks.com/thumbv2/123doknet/14680550.559157/51.918.237.689.156.437/figure-illustration-applicable-continuous-ceutical-scottequipment-continuous-february.webp)