HAL Id: hal-03208955
https://hal.uca.fr/hal-03208955
Preprint submitted on 27 Apr 2021
HAL is a multi-disciplinary open access
archive for the deposit and dissemination of sci-entific research documents, whether they are pub-lished or not. The documents may come from teaching and research institutions in France or abroad, or from public or private research centers.
L’archive ouverte pluridisciplinaire HAL, est destinée au dépôt et à la diffusion de documents scientifiques de niveau recherche, publiés ou non, émanant des établissements d’enseignement et de recherche français ou étrangers, des laboratoires publics ou privés.
Does transparency pay ? The impact of EITI on tax
revenues in resource-rich developing countries
Harouna Kinda
To cite this version:
Harouna Kinda. Does transparency pay ? The impact of EITI on tax revenues in resource-rich developing countries. 2021. �hal-03208955�
Does transparency pay? The impact of EITI on tax revenues in
resource-rich developing countries.
Harouna KINDA*†‡
April 26, 2021
Abstract
This paper assesses the ”treatment effect” of the Extractive Industries Transparency Initiative (EITI) membership on tax revenues through two main channels. The first (direct) works through an equitable and transparent resource tax regime. The second is the indirect effect EITI has on non-resource revenue once trans-parency enhances accountability and resource allocation to productive expenditures. Based on a sample of 83 resource-rich developing countries (44 EITI and 39 non-EITI) for the period from 1995 to 2017, we use propen-sity score matching (PSM) methods developed in the treatment effect literature to address the self-selection bias associated with EITI membership (the dates of countries’ commitment, candidacy, and compliance). Results show that EITI commitment and/or candidates have significant and positive effects on tax revenue collection, compared to non-EITI (on average 1.06 to 1.20 percentage points), and the EITI compliance generates a consid-erable surplus of tax revenues (on average 1.09 to 1.13 percentage points of GDP), compared to non-compliant (commitment and candidate). Besides, the magnitudes of the effects are greater and more significant if we include governance indicators. The results are robust, with a more significant increase in non-resource tax revenues and income tax. The paper reveals that EITI members have higher levels of tax revenue than non-members and that tax revenue is higher when countries are compliant with the initiative, even higher with quality of governance, and heterogeneous due to structural factors.
Keywords: Natural resources; Extractive industries; Governance; Transparency; Evaluation; Domestic
revenue mobilization.
JEL Classification: C33; E62; O19; H2; Q32
*Corresponding author:harouna.kinda@etu.uca.fr
†Universit´e Clermont Auvergne, CNRS, CERDI, F-63000 Clermont-Ferrand, France &
1
Introduction
The Addis Ababa Financing for Development conference and Sustainable Development Goals (SDGs) in mid-2015 highlighted a particular emphasis on domestic revenue mobilization (DRM). Development aid and public debt should be complementary. While most governments resource-rich developing countries have struggled to mobilize the substantial revenues from the sector due to a range of chal-lenges, both external such as aggressive tax planning by Multinational Enterprises (MNEs) (transfer pricing rules, distorted mineral valuations, excessive interest deductions, and treaty shopping) and internal including weak enforcement of tax laws, overly generous tax incentives to attract foreign direct
invest-ment (FDI), ambiguous fiscal regimes (Knack, 2009), and misuse of public revenues (Robinson et al.,
2006). International Monetary Fund Abbreviation (IMF) estimates that revenue losses from tax
avoid-ance across all countries are 5% of corporate income tax (CIT) revenues, with a much more significant impact for developing countries, at least $200 billion.
The pioneering research by Sachs and Warner (1995), and other works that have followed (Sachs
and Warner,2001;Van der Ploeg,2011) suggest that the dependence on natural resources hurts the
eco-nomic performance of the most resource-rich countries compared to the least resource-rich countries. This statement is generally known as the ”resource curse.” On the one hand, this phenomenon refers to the adverse effects of natural resource wealth on the traditional sectors of an economy by appreciating its exchange rate (often called ”Dutch Disease”). On the other hand, in resource-abundant countries, power tends to be centralized, leading regimes towards authoritarianism and making it difficult to es-tablish democratic and transparent institutions. There is also talk of crowding out of non-resource tax
revenues by resource revenues in several developing countries. (Bornhorst et al., 2009; Ndikumana
and Abderrahim,2010; Crivelli and Gupta,2014; Mawejje, 2019). The high natural resource rents
al-low governments to reduce the burden of taxation on citizens to reduce the demand for democratic
accountability (McGuirk,2013). As a result, disparate literature has focused on the economics of
natu-ral resources to understand the ”resource curse” phenomenon and turn natunatu-ral resource wealth into a
source of economic development. These include the definition and rents sharing1, the macroeconomic
effects of abundance and dependence on natural resources2, and institutional impacts3.
The Extractive Industries Transparency Initiative (EITI), created in 2003 at the instigation of the NGO ”Publish What You Pay,” aims to promote better governance of natural resources and to help address the challenges facing resource-rich countries relating to tax revenues collection. Nowadays, it is an initiative recognized as an international standard of good governance. Since then, 54 countries worldwide (including 24 African countries) have implemented the EITI standard. This standard re-quires extractive companies to publish all payments made in detail in the government’s accounts. Sim-ilarly, governments must publish all payments received from extractive companies (oil, gas, and min-ing). In other words, governments and companies disclose information on the main stages of the value chain: Multi-Stakeholder Group (MSG), Contracts and licenses, Exploration and production, Revenue
collection, Social and economic spending, Outcomes and impact (EITI, 2016). In addition to revenue
collection, the EITI Standard promotes transparency and accountability in allocating resource revenues 1(Boadway and Keen,2010;Charlet et al.,2013;Laporte and Rota-Graziosi,2014)
2(Corden and Neary,1982;Sachs and Warner,1995;Gylfason et al.,1999;Gylfason,2001;Tornell and Lane,1999;Sachs and Warner,2001;
Gylfason and Zoega,2006)
3(Alexeev and Conrad,2011;Al-Kasim et al.,2013;de Medeiros Costa and dos Santos,2013;Bhattacharyya and Hodler,2010;Arezki and
Br ¨uckner,2011;Leite and Weidmann,2002;Kolstad and Wiig,2009;Norman,2009;Saha and Gounder,2013;Brunnschweiler,2008;Bulte et al.,2005;Papyrakis et al.,2017;Amiri et al.,2019;Berman et al.,2017;Desai and Jarvis,2012;Knutsen et al.,2017)
to public expenditure. Several international organizations (World Bank, International Monetary Fund, OECD) have endorsed the initiative and provide technical and financial support for implementing the EITI standard. Their objective is to enhance transparency for better domestic resource mobilization and
promote inclusive economic growth and social development in developing countries (Liebenthal et al.,
2005).
Generally, the EITI literature focused on the factors behind a country’s joining the initiative (see
Pitlik et al.,2010;Cockx and Francken,2014;Oge¨ ,2016;Kasekende et al.,2016;David-Barrett and
Oka-mura, 2016; Lujala, 2018), the initiative impact on Gouvernance (Namely control of corruption, civil
liberty and democracy) (seeEjiogu et al.,2019;Villar and Papyrakis,2017;Rustad et al.,2017;Magno
and Gatmaytan,2017;Papyrakis et al.,2017;Sovacool et al.,2016;Sovacool and Andrews,2015;
Hau-fler, 2010), FDI flows (Sovacool and Andrews, 2015), and growth (Corrigan,2014). A study close to
ours isMawejje(2019) which analyzes the link between natural rents and non-oil revenues using EITI
membership as an interaction variable. This study focused on the linear regression model, therefore
not taking into account the problem of self-selection rigorously. As well,Lujala(2018) argues that all
impact evaluations of the EITI on resource governance and societal development need to correct for the selection biases in countries’ decisions to commit to and implement the EITI standard. This paper aims to provide relevant answers to the following questions: Do EITI membership improves tax revenue mobilization after controlling for self-selection? Does the treatment effect vary with the status of EITI implementation (commitment, candidacy, and compliance)? Is there heterogeneity in the treatment effect of EITI depending on countries’ structural characteristics?
Therefore, this paper aims to assess extractive industries’ effects on tax revenue mobilization in de-veloping countries. More specifically, we estimate the effect of EITI implementation on tax revenues compared to the situation of non-implementation. Our intuition is that EITI implementation would boost the quality of governance in resource-rich countries and improve tax revenue mobilization. We consider two main channels through which this effect occurs. The first channel is direct, and it works through an optimal and transparent resource tax regime; this could improve the government’s share of rents (resource revenue). The second channel is the indirect effect that EITI has on non-resource rev-enues, as transparency enhances accountability and resource allocation to productive expenditures; this will have positive spillovers on government non-resource tax revenues. This study aligns with work on the effectiveness of the EITI in reducing the negative impacts of natural resources on economic
develop-ment and the quality of governance (Corrigan,2014,2017), and in improving tax revenue mobilization
(Mawejje,2019).
This impact assessment is motivated not only by the challenges faced by resource-rich developing countries to generate adequate revenues for sustainable development finance but also the objective of rigorous evaluation of the EITI policy to reinforce the activities of its implementation. Our study con-tributes to the existing literature on several points. Firstly to the best of our knowledge, our paper is the first study taking into account rigorously this self-selection problem while investigating the impact of
implementing the EITI on domestic revenue. We use the propensity score matching method ofLeuven
and Sianesi(2018), which allows us to consider the determinants that motivated countries to implement
the EITI standard. Secondly, our analysis is more comprehensive because it considers the three main stages of the EITI implementation process: commitment, candidature, and compliance. Thirdly for our sensibility analysis, we consider the Total tax revenues as a dependent variable, and then, Non-resource Tax and income tax include taxes on income, profits, and capital gains. Fourthly we use a control func-tion regression approach to analyze the heterogeneity of treatment effects on tax revenue mobilizafunc-tion
based on structural factors of countries. We consider country temporal and fixed effects, the sensitivity of compliance with standards, and the time elapsed since EITI implementation. The main results show that EITI implementation exerts a positive and significant effect on tax revenue mobilization.
In the following steps of the paper, Section 2 discusses the related literature, Section 3 presents
data and highlights stylized facts, Section4describes the empirical strategy, Section5shows the main
results, Section6explores the sources of heterogeneity in the treatment effects, and Section7concludes.
2
Literature review
2.1 The macroeconomic effects of natural resources and tax revenue mobilization
Natural resources have long been considered a strong pillar in the economic development process. The intuition is that countries rich in oil, gas, and minerals can generate significant revenues to improve
their economic performance (seeViner,1952;Rostow,1961). However, the resource bonus seems to be
a curse rather than a blessing (Auty, 1994; Sachs and Warner, 1995). Causes often cited to explain
resource curse include Dutch disease, insufficient or inefficient investment (including human capital),
lack of fiscal discipline, institutional decay, and macroeconomic instability (seeGylfason,2001;Halland
et al.,2015).
In addition to other economic sectors, the tax capacity of resource-rich countries depends, on the one hand, on a fair tax regime for extractive industries that maximizes government revenue, and on the other hand, on the spillovers associated with the use of extractive resource revenues. Resource tax regimes can be quantitatively evaluated for their neutrality, revenue-raising potential, government risk (stability and timing of government revenue), effects on investor perceptions of risk, and their
adapt-ability and progressivity (Daniel and Goldsworthy, 2010). The progressivity reassures investors and
guarantees a ”fair” share of rent to the government, and this means that a tax regime will yield a rising
present value of government revenue as the pre-tax rate of return on a project increases (Boadway and
Keen,2010). The rent sharing between the transnational company and the host country depends not
only on the government’s bargaining power but also on company operations (accounting, financial be-havior, transfer pricing, and dividend repatriation). Besides, tax competition between countries forces the implementation of incentives to attract capital; this is detrimental to tax revenues from traditional public economics and would require coordination or cooperation in tax matters between States. How-ever, tax coordination is impossible under the assumption of a Nash equilibrium in the presence of tax
competition (see,Rota-Graziosi,2019).
Countries with enormous nonrenewable resources can reap substantial benefits from them, and many countries have done so. For example, industrialized countries such as Australia, Canada, and the United States have successfully transformed resource extraction into economic growth and devel-opment. Recently other resource-rich countries Botswana, Chile, Malaysia, and South Africa, have
reached the highest income level (Halland et al.,2015). However, the reliance on resource revenue poses
challenges to policymakers, and governments must play an essential role in how resource revenues are
used. Daniel et al.(2013) indicates that with an effective fiscal policy, revenues from extractive
indus-tries would contribute significantly to finance productive spending. This condition the non-resource tax effort. Investments in immediately productive sectors would promote job creation and, consequently,
expand the tax base and reduce resource dependence. According toKnebelmann (2017), the impact
capacity (tax administration capacity) could contribute to a synergy between these taxes. Conversely, a reduction in control and incentives of taxing non-oil economies because the resource revenue could lead to a crowding-out effect.
Several empirical analyses of the effect of natural resources on non-resource tax revenues have led
to controversial results. Bornhorst et al. (2009) find that each additional percentage point of GDP in
oil and gas revenues leads to a decline in non-oil and gas revenues of 0.23 percentage points across
a sample of 30 oil countries over the period 1992-2005. Crivelli and Gupta (2014) find that there is
a reduction in domestic non-resource tax revenues of about 0.3 percentage points for each additional
percentage point of GDP in resource revenues. Mohtadi et al. (2016) show that for each additional
percentage point of GDP in resource revenues, there is a reduction in taxes on individuals of about
0.2 percentage points.Ossowski and Gonz´ales(2012) find that the resource revenues/GDP negatively
impact the non-resource taxes/non-resource GDP on Latin American countries. Thomas and Trevino
(2013) find that for every one percentage point increase in resource revenue as a proportion of GDP,
non-resource revenue is lower by about 0.07 to 0.12 percent of GDP sub-Saharan Africa. When they use
GDP excluding resources, their results are not significant. However,Knebelmann(2017)’s replicas from
ICTD data show that the results are sensitive to the change in the denominator (GDP by GDP excluding
oil). Non-resource taxes as a percentage of total GDP seem to be biased. According to Crivelli and
Gupta(2014), ”if resource revenue-to-GDP increases due to a sharp increase in resource production,
non-resource revenue may appear depressed relative to GDP simply because of the increased income
and the coefficient estimates may be biased downwards.” In contrast,Knebelmann(2017) uses gross
tax revenues, i. e. not related to GDP, for a sample of 31 countries. This study concludes that there is no crowding-out effect of oil revenues on non-oil revenues through tax channels.
Besides, some research indexes institutional quality as the solution to reverse the ”resource curse”
or enhance resource blessing in resource-rich countries (see Collier and Hoeffler, 2005; Lujala et al.,
2005). It is important to note that in resource-rich countries, the lower take up of non-resource taxes
is correlated with higher levels of corruption in these countries, suggesting that weaker institutions affect non-resource revenue through incentives for tax evasion and/or overly generous tax incentives
(Crivelli and Gupta,2014). Also, natural resource abundance is the primary source of illicit financial
flows (Ndikumana and Boyce,2003).Kolstad(2009), andMavrotas et al.(2011) show theoretically and
empirical evidence that natural resources can be a blessing in countries with good institutions and a
curse in bad institutions countries. Grigorian and Davoodi(2007) find in Romania that lower-country
political risk is positively associated with the tax ratio. Similarly,Bird et al.(2014) find that governance
indicators (corruption, voice, and accountability) significantly affect tax revenues. Using a sample of
46 SSA countries,Botlhole et al.(2012) provide evidence that natural resources are only detrimental to
tax revenue mobilization in the absence of good institutions. On the other hand,Eregha and Mesagan
(2016) showed that institutional quality enhanced per-capita income growth in African countries. This
is thereby questioning institutional quality in these countries that would not reverse the resource curse. To sum up, the issue of the political economy of natural resources requires private investment to discover and extract the resource, fiscal regimes to capture revenue, judicious spending and investment decisions, and policies to manage volatility and mitigate adverse impacts on the rest of the economy
(Venables,2016). Our analysis consists of highlighting the effects of EITI on the tax revenues, through
the two channels mentioned above in particular, and by the spillover effects on the capacity of tax administration in general.
2.2 EITI Overview
Founded in 2002 under the initiative of ”Publish What You Pay”, an NGO, the EITI was formally launched in London in June 2003. It is a multi-stakeholder organization dedicated to promoting good
management and governance of oil, gas, and mineral resources (EITI, 2016). The EITI standard has
so far been applied in 54 countries (including 24 African countries). This standard requires extractive companies to publish all payments made in detail in government accounts, and governments are also
required to publish all payments received from extractive companies, to curb corruption (Papyrakis
et al.,2017). In other words, governments and companies disclose information on the main stages of
the natural resource value chain, such as exploration activities, licenses and contracts, beneficial own-ers, production, revenue collection, and revenue use. Several international organizations (World Bank, International Monetary Fund, OECD) have endorsed the initiative and provide technical and finan-cial support for implementing the EITI standard. Their objective is to enhance transparency for better domestic resource mobilization and promote inclusive growth and social development in developing
countries (Liebenthal et al.,2005).
The EITI implementation process consists of three main steps: Commitment, Candidate, and Com-pliance. First, the government publicly commits to joining the EITI and implementing the EITI stan-dard. Following the announcement of the commitment, government, companies, and civil society must jointly commit to establish both a national EITI secretariat and a multi-stakeholder group (MSG) to oversee the implementation process. The MSG requires the independent, active, and effective par-ticipation of all stakeholders. Thus, the MSG adopts a cost work plan in line with the reporting and validation deadlines of the EITI Board. This work plan sets out the country’s objectives and priorities
for implementing the EITI (EITI,2016). This step takes time and allows the effects of accession to be
examined before being accepted as a candidate country (Corrigan,2014). Thus, this demonstrates the
country’s intention and implies its willingness to change transparency policies and accommodate the requirements of EITI membership.
After the requirements of Commitment Status, the government must submit a request to the EITI Board to become a candidate country. The country becomes an EITI Candidate if the Board considers that all conditions for membership have been met. To achieve Compliant status, a Candidate country must publish a first EITI Report within 18 months. It must also submit the final report for approval by the Board of Directors and approved by the MSG within two years and a half. Candidate countries that have not been able to comply with the requirements of the validation process and/or have not
submitted their final validation report at deadline risk a suspension (Anwar and Kannan, 2012). The
suspension can also intervene if the country lives in a context of political instability. This situation is the case for the Central African Republic in 2013 and Madagascar in 2011. After compliance, the country must submit a validation report every three years as requested by the Board. Non-compliance with the latter obligation may also result in the suspension of the concerned country. The phenomenon of the
”resource curse” is one of the main reasons for the EITI creation. The pioneering work ofAuty(1994)
andSachs and Warner (1995) showed that resource-rich countries (oil, gas, or mining) have
below-average economic activity. These countries have a higher frequency of conflicts and suffer from poor
governance (Humphreys,2005;Collier, 2003). According to international organizations (World Bank,
IMF, and other multilateral cooperatives), these adverse effects could be mitigated through greater transparency in the governance of extractive industries.
investment climate. This initiative would contribute to strengthening accountability and good gover-nance and ensure more excellent economic and political stability. For companies, mitigating the politi-cal risks caused by opaque governance is a benefit for investments. Investments in the extractive sector are highly capital intensive, which requires a high degree of long-term stability to generate profits. Transparency of payments to governments allows companies to demonstrate their contribution to pub-lic finances. For civil society organizations, the benefits mainly concern the availability of information on governments’ management of resource revenues, and this requires more responsibility in allocating
income to social and economic expenditures (EITI,2016).
However, the EITI still has several limitations. First, the fact that a country is an EITI Candidate or compliant country does not necessarily mean that its extractive sector is fully transparent or free of corruption. This situation indicates an effective process for monitoring and improving the disclosure
of information (EITI,2016). Also, international pressure for reform and the high implementation costs
of international standards push some governments to so-called fictitious or facade compliance (Oge¨ ,
2017). Civil society organizations’ participation in MSG in authoritarian countries satisfies this form of
compliance. Global donor actors exert some form of external pressure for reforms in the management
of extractive industries. They require strict compliance with good governance standards (Gillies,2010;
O’Neill et al., 2004). Since the EITI creation, it has been strongly supported by the World Bank, the
IMF, and the G-20 as an instrument of transparency in developing countries. In this logic, countries are
obliged to implement EITI in order to benefit from a better solvency of external financing (Simmons,
2001) and a good global reputation as FDI destinations (David-Barrett and Okamura, 2013; Henisz,
2002;Oge¨ ,2017). These external incentives associated with the EITI require countries to formally accept
civil society organizations as important stakeholders in managing extractive resources. However, in practice, these groups are often marginalized and silenced. Finally, it is important to note that at the inception of the EITI, the responsible use of resource revenues was not a concern in implementing the EITI, making it difficult to address corruption along the value chain.
2.3 How can EITI implementation improves tax revenue mobilization ?
The EITI literature focused on the factors behind a country’s joining the initiative (seePitlik et al.,2010;
Cockx and Francken,2014;Oge¨ ,2016;Kasekende et al.,2016;David-Barrett and Okamura,2016;Lujala,
2018), the initiative impact on Governance (Namely control of corruption, civil liberty and democracy)
(seeEjiogu et al., 2019;Villar and Papyrakis,2017; Rustad et al.,2017; Magno and Gatmaytan, 2017;
Papyrakis et al.,2017;Sovacool et al.,2016;Sovacool and Andrews,2015;Haufler,2010), FDI flows (
So-vacool and Andrews,2015), and growth (Corrigan,2014). A study close to ours isMawejje(2019) which
analyzes the link between natural rents and non-oil revenues using EITI membership as an interaction variable.
The national platforms of EITI for accountability improve reforms and governance and promote more excellent economic and political stability. The effects of EITI on tax revenues would be reflected in the strengthening of the resource tax regime and linkages with the non-resource economy. The first channel is direct, and it works through an optimal and transparent resource tax regime. The second channel is the indirect effect that EITI has on non-resource revenue once transparency enhances ac-countability and resource allocation to productive expenditures (for example, infrastructure and hu-man development, to promote economic diversification). First, the EITI improves the transparency of the extractive business taxation system, improving the government’s share of rents. It broadens access
to detailed information on extractive sector revenues in several countries and informs citizens about the amounts of payments made by companies. For example, in Chad, the national oil company dis-closes detailed information about Glencore’s sale of oil. For each shipment of cargo, sales volumes, prices, sales amounts, public debt repayment, and the balance transferred to the treasury are presented
in detail (EITI, 2018). For a long time, the identity of the beneficial owners of companies holding oil,
gas, and mineral extraction rights has often been unknown. This lack of transparency in the gov-ernance of extractive industries fuels corruption, money laundering, tax evasion, and illicit financial
flows, as evidenced by the Panamas Papers (Chohan, 2016). EITI requires disclosure of the absolute
ownership of extractive companies (the holders of extraction rights), i.e., residence, parent company, and subsidiaries. This demonstrates that EITI leads to more efficient tax collection from companies in the extractive industries. The second channel is the indirect effect that EITI has on non-resource revenue once transparency enhances accountability and resource allocation to productive expenditures (for example, infrastructure and human development, to promote economic diversification). The trans-parency of the use of resource revenues to productive expending, which conditions the non-resource tax effort. This raises the complementary relationship between resource revenues and non-resource tax revenues. In general, citizens’ transparency or access to information can reduce bureaucratic corruption by making acts of corruption riskier and promoting the selection of honest and efficient agents for the public service. According to the resource curse literature, appropriate institutions can prevent the ad-verse impact of natural resources. It is not immediately apparent that EITI transparency reform should be the priority. It is essential to consider other indicators of institutional quality, which are crucial to the effectiveness of tax revenues.
The question of the effects of EITI on tax revenues is still little empirically addressed in the
ex-isting literature. OnlyMawejje(2019) achieves to analyze a direct relationship between the EITI and
non-oil tax revenues. The author considers 31 sub-Saharan African resource-rich countries over the pe-riod 2003-2015. The Fixed effects and dynamic panel models indicate a negative relationship between natural resource dependency and non-oil revenue mobilization. The effect becomes weakly positive by using the interaction between EITI membership and natural resource dependency (Total rents in % GDP). The author concludes that EITI membership partially improves tax revenues since the coefficient decreases with adding of control variables. With a panel of 186 countries over the period 1997-2014 and
using the fixed-effect model, Corrigan(2017) shows that the EITI membership positively affects and
significant economic development. However, the effect on the control of corruption is not significant.
An ordinary least squares (OLS) analysis over the period 2005 to 2009 byCockx and Francken(2014)
finds no evidence for a positive effect of the EITI membership on public health spending.
However, there are several limitations to this empirical literature in particular and EITI policy in general. The regression method is no appropriate because a country’s decision to implement the EITI standard is endogenous. This work considers EITI membership as the date on which the country pub-licly expresses its intention to implement the EITI standard. Demonstrating a country’s intention to join the EITI implies a willingness to change transparency policies and comply with EITI requirements. By
considering only this step, the analysis risks underestimating the impact of the EITI.Corrigan (2017)
points out that this variable, as defined, does not take into account all policies or plans that aim to increase transparency and accountability in the governance of extractive industries. This suggests re-straint in interpreting the results, as EITI implementation extends over several years. The specification with an interaction term indicates the heterogeneity of the effect of EITI via the level of dependence on natural resources between countries that are already EITI Members. The result does not compare
the effectiveness of non-resource tax revenues between EITI and non-EITI implementing countries. In other words, this result is much more reflective of the sensitivity in terms of extractive capacity and the value of natural resources between EITI members.
In addition to the limitations of empirical analysis, the EITI faces some challenges. Initially, EITI policy focuses only on revenues from extractive industries. Other aspects of the extractive value chain, such as these revenues allocating, are not considered. Nevertheless, resource-rich countries face many
corruption problems that are mainly expenditure-based (Oge¨ ,2017). Similarly,Robinson et al. (2006)
suggest that responsible use of public resources is the way to avoid the ”resource curse.” Thus, the introduction of EITI seems a little late in the logic of real impact because corruption is already present at the contracting and procurement stages. As membership of the EITI is voluntary for countries and companies, countries and companies can express their intention to join the initiative and whether or not to follow up on it. This depends on the opportunity cost of complying with the standards. For example, highly corrupt governments may be interested in not promoting transparency in the extractive
industries (Oge¨ ,2017). For such governments, restrictions on access to international financial markets
and development support could effectively increase their compliance costs. Also, there is a risk that supporters of the government regime may populate the multi-stakeholder group. This reduces the exposure of bad practices in EITI implementation. Members of multi-stakeholder groups also need to be able to process and act on the information conveyed.
On the other hand, we use a more appropriate methodology to assess the impact of EITI member-ship on tax revenues. Indeed, we consider two main stages (commitment status and candidate country status) of EITI implementation to measure EITI adherence. Besides, we consider the heterogeneity of ef-fect (ATT) related to Compliance with EITI standards. The primary variable of interest is EITI Candidate country status. With this variable, we can ensure more transparency in the governance of the extractive industries, as it meets the first five (05) requirements of EITI implementation. We use the propensity score matching (PSM) method, which considers the impact of the main factors that motivate countries to join EITI. The PSM assesses the impact of EITI membership on tax revenue mobilization for a given country compared to what it would have been like to remain a non-EITI member. In other words, this method gives the average effect of EITI membership on tax revenue mobilization. We also analyze the heterogeneity of the effect across countries related to macroeconomic variables, institutional quality, and the time elapsed since EITI membership.
3
Dataset and Stylized facts
3.1 Dataset
The empirical analysis is conducted on an unbalanced panel of 83 resource-rich developing coun-tries for the period from 1995-2017. The choice of this large panel is based on the dependence on extractive resources and the availability of tax revenue data. Extractive-dependent countries are
de-fined as countries that depend on minerals for at least 25% of their tangible exports (Haglund,2011).
The panel is unbalanced because of missing observations. The sample includes 44 countries that have implemented the EITI standard at different accession dates (called EITI members, or EITI member, or EITI countries, or treatment group) and 39 non-EITI members (control group). Of these 44 EITI committed coun-tries, all have achieved Candidate status, and only 25 have achieved Compliance status as of the specific
list of countries & their different stages of EITI implementation).
We use Government Revenue Dataset (GRD) developed by the International Centre for Tax and
De-velopment (Prichard et al.,2014;McNabb,2017). It is a complete source of cross-country data available
and extensively used in the studies surrounding the effects of tax policy on development. In
particu-lar, total tax revenues (% GDP) is our main dependent variable (Log Tax revenue-to-GDP)4. It represents
the sum of the sub-components of taxes excluding social security contributions, which are levied for the benefit of social welfare institutions. This coverage of tax revenues data is better because it is spe-cific to taxes and consistent across countries. We test transmission channels using Non-resource tax revenues and Total income taxes, including taxes on the natural resource sector, to robust our results. Non-resource tax (Log Non-Res Tax-to-GDP) calculated as total tax revenues excluding social security contributions and resource taxes (oil, gas, and mining). Total taxes on income, Profits, and Capital Gains (Log Income Tax-to-GDP) represent the sum of corporate and personal income taxes (CIT + PIT).
The variable of interest is a dummy of EITI implementation, and it is constituted through the
infor-mation available on the EITI website (EITI,2016). The EITI dummy takes the value 1 to start from the
year of takes the value 1 for the years that the country is an EITI member and 0 for the years that the country is not an EITI member according to the stage of implementing the EITI standard. Indeed, Can-didate status is necessarily the first step for an EITI implementing country. For a more comprehensive analysis, in this study, the interest variable is measured in three chronological levels through three main stages of EITI standard implementation, namely Commitment, Candidate, and Compliance. We also use it as a dependent variable for the initial probit estimation of the Propensity Score for the set of explana-tory variables suspected to be endogenous to EITI membership. Propensity score estimates include the group of countries such as EITI members and control group (non-EITI member). In particular, the control group for commitment and candidate status includes non-ITIE countries, and the control group
for compliant countries is formed only by EITI commitment or candidate5countries that have not yet
obtained compliant status.
The control variables are composed mainly of structural and institutional indicators, and their
choice is justified in subsection4.2. The propensity score matching method suggests that the control
factors are correlated simultaneously with the interest variable and the dependent variable. Otherwise, these factors are likely to explain both the choice to implement EITI and tax revenues for a given coun-try. Based on existing literature, we monitor the endogeneity of the following factors: the total rents of extractive industries (oil, gas, mineral), GDP per capita, Financial development, Inflation, Commodity prices, Trade openness, Net official development assistance per capita (AID), Foreign direct investment (FDI), Industry value-added, Coal rents, Forest rents, Human development index (HDI), Index of insti-tutional quality (control of corruption, government effectiveness, the rule of law), Regulatory quality, Voice and accountability. It is not possible to control for unobserved factors that may affect the like-lihood of joining the EITI. However, the control variables allow us to take into account some of the known sources of bias. These data come mainly from the datasets of World Development Indicators (WDI), International Monetary Fund (IMF), and The World Governance Indicators (WGI).
4The standard deviations of certain variables in the two groups of countries are pretty disparate (see TableA11for the
descriptive statistics). We, therefore, consider their logarithms in our econometric regressions. For example, we use the variables total tax revenues and non-resource tax revenues in logarithms
3.2 Stylized facts
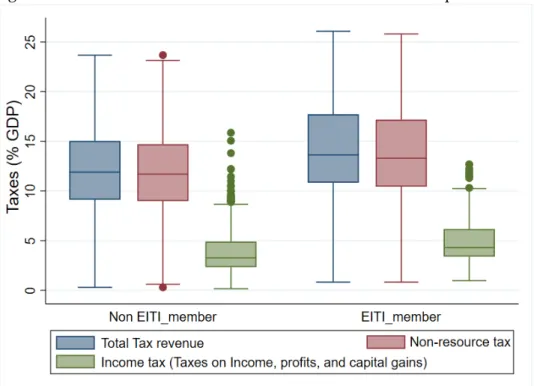
Governments of resource-rich countries receive revenues from taxing extractive companies, royalties,
and economic rent-sharing arrangements. The mustache box diagram in fig.1visualizes the distribution
of tax revenues in EITI members before and after commitment. It can be seen that for each type of tax revenue, the range is higher for EITI member periods. The same is true for the median tax revenues, i.e., the amount that divides the distribution of tax revenues into two equal shares for EITI member periods
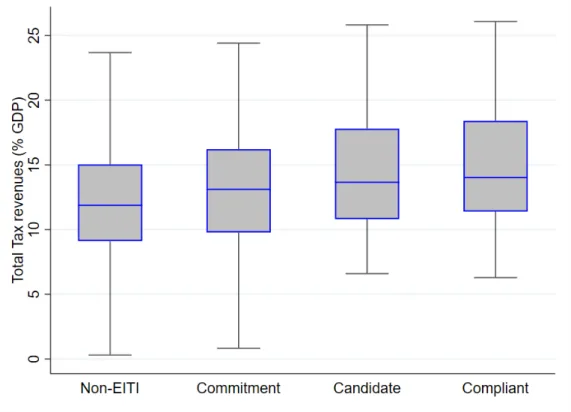
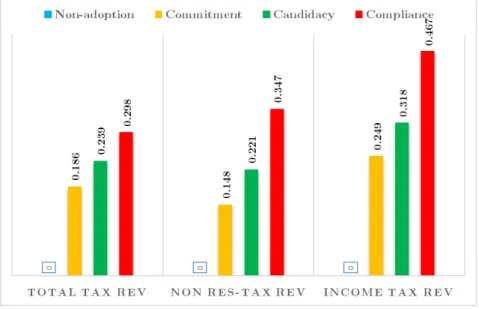
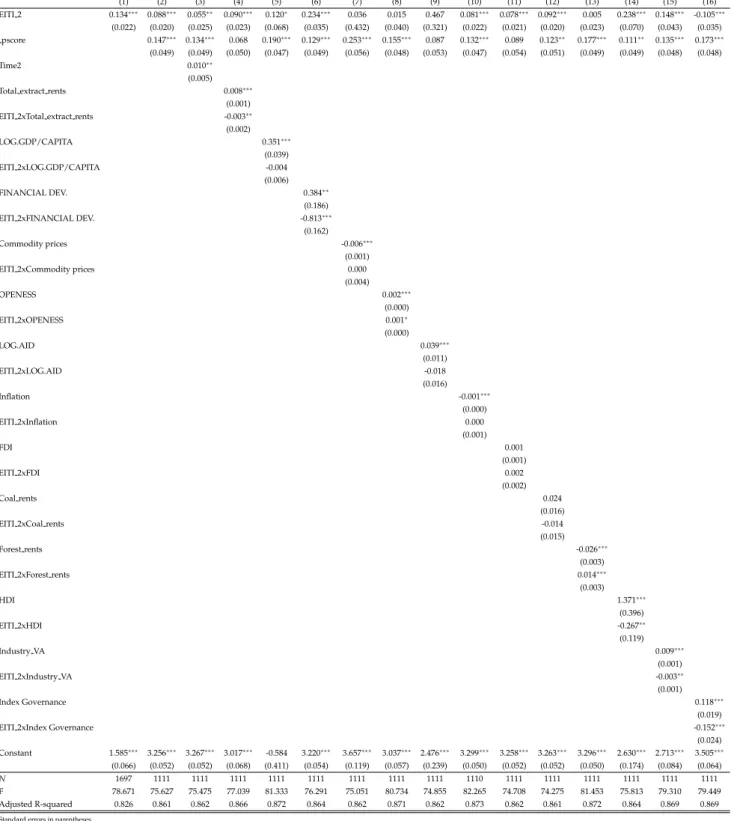
is higher than the non-EITI period. However, we can see from the mustache box diagram in figure2
that the median of the tax revenues distribution increases with the stages of EITI implementation
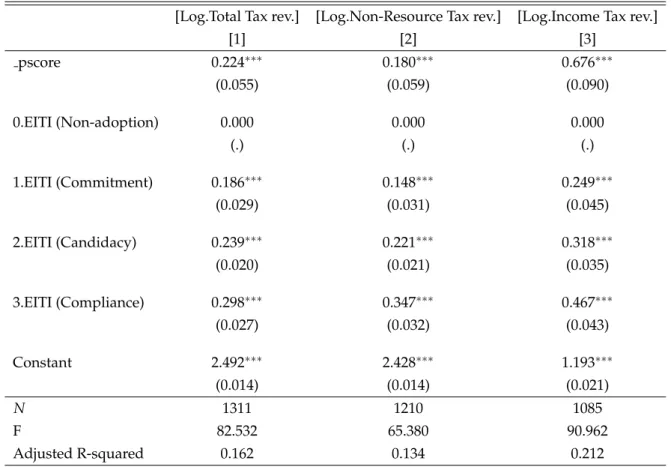
(Non-EITI, commitment, candidate, and compliance). Unlike the mustache box diagrams, Figure3considers
the period before the commitment to implement EITI and countries that are not yet EITI Members. This figure shows the relationship between natural resource dependency (sum of oil, mining, and gas rents) and non-resource tax revenues. We find that the mobilization of non-resource tax revenues is a decreasing function of natural resource dependency. However, the slope of the adjustment line is less steep in EITI members than in non-EITI members. This reflects the more responsible use of revenues under the EITI standard. We explain this by creating linkages with the rest of the economy, such as job creation and the allocation of revenues to productive expenditures that generate other non-resource tax revenues. The implementation of EITI, therefore, helps to mitigate the crowding out of non-resource tax revenues. In other words, the negative effect of extractive resource dependence on non-resource fiscal revenues is mitigated for EITI members. At the end of our statistical analysis, countries would mobilize more revenue by implementing EITI and more by achieving compliance status. Before concluding these results, we conduct an econometric verification because the stylized representation of economic variables does not take into account specific endogenous factors. Likewise, the periods before and after EITI are not necessarily comparable. In the following, we begin an analysis using propensity score matching on two more comparable groups.
Figure 2: Distribution of total tax revenues according to EITI implementing stage
4
Empirical strategy
Our objective is to evaluate the treatment effect of EITI implementation on tax revenue mobilization and considering the selection bias. The treatment is the EITI implementation for a given country over a given period. We refer to EITI members as the treated group and non-EITI members as the control group. The equation of the estimated average treatment effect on the treated (ATT) is expressed as follows:
ATT=E[(Yit1−Yit0)|EIT Iit =1] =E[Yit1|EIT Iit =1] −E[Yit0|EIT Iit =1] (1)
where EITI is the dummy (independent variable) corresponding to the EITI implementation and Y is the
domestic tax revenues. Yit0|EIT Iit=1 is the value of tax revenue mobilization at time t that would have
been observed if an EITI members i had not implemented the EITI and Yit1|EIT Iit =1 the outcome value
actually observed in the same country. Equation (1) tells us that a simple comparison between the value of tax revenue mobilization observed in the treatment group and the value of tax revenue mobilization observed for the same countries if they had not implemented the EITI would give an unbiased estimate of ATT. However, the main difficulty in estimating the ATT is that the second term on the right-hand
side(E[Yit0|EIT Iit = 1]) is not observable. We cannot observe the value of tax revenues of an EITI
member if it had not implemented the EITI standard. We face an identification problem, as is often the case with experimental studies.
A simple approach commonly used to address this difficulty and assessing the causal effect would consist of comparing tax revenues of the treated (EITI-counties) with those of the control group
(non-EITI countries) having similar observed characteristics (Rubin,1974). This means that the treated group
would have had tax revenues similar to those in the control group in the absence of EITI. In that respect, the difference in outcome between the two groups can be attributed to the treatment effect. This ap-proach is possible if and only if the decision of the country to implement EITI standards is random. It will raise selectivity bias problems if the decision to implement the EITI is not random. However, the decision to implement the EITI standards may be non-random, as choices to join or no may be corre-lated to a set of observable that also affects tax revenue mobilization. Then we will have the ”selection on observables” problem, which can lead to an overestimation of the impact of EITI implementation on tax revenues. Traditional linear regression is an unreliable method in this case (for detailed discussions,
seeDehejia and Wahba,2002;Heckman et al.,1998). We use various propensity score matching (PSM)
methods recently developed in the treatment literature to address the selection problem on observable6
(Rosenbaum and Rubin,1983).
4.1 Matching on propensity scores
The PSM method consists of comparing EITI and non-EITI members having similar observed char-acteristics so that the difference in tax revenues values between the two groups of countries can be attributed to the effect of treatment. In other words, to determine treatment effects, it is essential that before the experimental treatment is implemented, the two groups (EITI and non-EITI members) are as comparable as possible.
The first assumption needed to apply the PSM method is the ”conditional independence” (Y0, Y1 ⊥
EIT I|X). It requires that conditionally to observable (X) unaffected by the treatment, the outcomes be
independent of the EITI implementation dummy. Under this assumption, equation (1) can be rewritten as follows:
ATT=E[Yit1|EIT Iit =1, Xit] −E[Yit0|EIT Iit =0, Xit] (2)
where we have replaced E[Y0
it|EIT Iit = 1] with E[Yit0|EIT Iit = 0, Xit], which is observable. The PSM
method would consist of matching processed units to control units with similar values of X. As the number of covariates in X increases, matching on X will be difficult to implement in practice. To
over-come this large problem, we followRosenbaum and Rubin(1983) which proposes a possibility to match
the treated units and control units on their propensity scores. The Propensity Score (PS) is the prob-ability of implementing the EITI standard, conditional on the observable covariates (X), and can be estimated using simple probit or logit models.
p(Xit) =E[EIT Iit|Xit] =Pr(EIT Iit=1|Xit) (3)
A second assumption needed to apply propensity score matching is the ”common support,” i.e., the existence of some comparable control units for each treated unit. This condition ensures that each EITI country, a counterfactual in the group of Non-EITI countries. Observations with the same PS have a
positive probability of being treated or untreated: 0 < p(Xit) < 1. This implies that the propensity
score distribution is substantially equal in the two groups of countries. Using PSM, the estimated ATT now can be as:
ATT= E[Yit1|EIT Iit=1, p(Xit)] −E[Yit0|EIT Iit =0, p(Xit)] (4)
We consider here a variety of commonly matching algorithms to assess the effect of treatment because
the difference in matching criterion (see Section5.3and5.4).
4.2 Expected effects of independent variables
Lujala(2018) argues that it is crucial to examine what factors influence a country’s decision to join
and implement the Standard, to understand whether and how adherence to the EITI Standard can affect resource governance and development. We estimate the PS using a probit model with the binary vari-able EITI as the dependent varivari-able. The aim is to measure the correlation of the control varivari-ables with the probability of implementing the EITI standard. Based on existing literature, our primary selection equation consists of three categories of structural factors that can influence both EITI implementation and tax revenue mobilization: internal motivation, internal capacity, and external pressure, such as
development agencies and organizations (seeLujala,2018).
Internal motivation. We assume that countries with a relatively higher level of dependence on the extractive sector are more likely than countries with a lower dependence rate to implement the EITI to
prevent the curse and attract more FDI. Along the same lines,Oge¨ (2016) argues that acceptance of the
EITI by leaders of resource-rich countries was to consolidate their international prestige as enthusiastic reformers, which would allow them to both maintain and attract foreign investment. Through cross-country and interrupted time series analyses, the author reveals that EITI members not only have higher levels of FDI than non-members but see their FDI levels increase once countries join the initiative. The World Bank justifies the EITI’s creation with the ”paradox of abundance”. We expect that Extractive
rents (similarly for coal rents and forest rents) will positively affect the likelihood of implementing the
EITI, as indicated in the literature (seePitlik et al.,2010;Oge¨ ,2016;Kasekende et al.,2016;David-Barrett
and Okamura,2016;Lujala,2018). All of these studies also find that developing countries are likely to
implement the EITI Standard faster than richer countries. In addition to benefiting more from the EITI,
these countries may face external pressures for the reason of receiving international assistance. Lujala
(2018) using both GDP per capita and the squared of GDP per capita, provide evidence of a curvilinear
correlation between the two variables with the EITI implementation decision for a given country. In our specific case, which consists only of developing countries, we expect a positive impact of GDP per capita on the likelihood of implementing the EITI. This is also valid for the Human Development Index (HDI). In most developing countries, the industrial exploitation of natural resources is generally carried out by
multinational companies (Manyika et al.,2013). The governments of these countries not equipped with
adequate technology for resource exploitation should adopt incentive policies to attract foreign direct
investment (FDI). Following the evidence ofDavid-Barrett and Okamura(2016), andLujala(2018) we
assume that a higher level of FDI flows is positively associated with the likelihood of implementing the
EITI. The resource-rich countries receive even more FDI after becoming EITI members (Oge¨ ,2016).
Internal capacity. Most resource-rich countries are still in a primary insertion into international trade. The World Bank calls on these countries to comply with EITI standards to attract FDI in the ex-tractive sector to increase their exports. We, therefore, expect a negative relationship between the high
level of past Trade openness and the likelihood of EITI implementation. Pitlik et al.(2010) don’t find a
significant effect. Although the industry remains embryonic in most developing countries, it proves to be an important source of tax revenues. It includes value added in mining, manufacturing, construc-tion, electricity, water, and gas. We assume that countries with relatively high Industrial value added will be less interested in implementing the EITI standard. About the quality of institutions, countries with a good performance in control of corruption, Government effectiveness and enforcement of Rules of laws will be less interested in implementing the EITI compared to others. Countries that are more corrupt than
others are more likely to start the EITI process (Lujala,2018). The countries with high corruption and
high dependence on extractive rents are less likely to implement the EITI quickly (David-Barrett and
Okamura,2016). Other studies suggest that the corruption in the EITI members may decrease in
imple-menting periods (Papyrakis et al.,2017;Villar and Papyrakis,2017). However, Regulatory quality and
Voice & Accountability, which refer much more to democracy, could motivate countries to join EITI. Governments that respect civil rights may tend to adopt progressive norms. At the same time, the
so-cial society can exert greater pressure on the government to implement the EITI standard (Lujala,2018).
In authoritarian regimes, NGOs will not have some freedom to voice their concerns in this process and
act as whistle-blowers (Oge¨ ,2017).
External pressure. dependence on development agencies and international organizations can
in-fluence a country’s likelihood of implementing the EITI (Lujala and Rustad, 2012; Sovacool and
An-drews,2015). We assume that countries which receive high levels of incoming development assistance
are likely to implement the EITI Standard faster than others, asDavid-Barrett and Okamura (2016);
Lujala(2018). These countries need some guarantee of transparency to continue to receive aid. The
Natural Resources Governance Institute (NRGI) indicates that nowadays, resource-rich countries tend to turn away from multilateral loans at the detriment of private sources of finance. We capture the effects of macroeconomic fluctuations through the Inflation rate, Commodity Prices, and Financial
develop-ment index. We expect a negative relationship between the high level of past Inflation rate, and Financial development index and the likelihood of EITI implementation, and positive effect for Commodity prices.
5
Baseline results
The estimation process of the average treatment effect of EITI implementation on the tax revenue mo-bilization is done in two steps. The first consists of estimating the propensity scores with a binary outcome model (probit model in our case), while the second consists of matching treated (EITI mem-bers) and untreated (Non-EITI memmem-bers) observations to estimate the average treatment effect on the treated (ATT).
5.1 The estimation of propensity scores
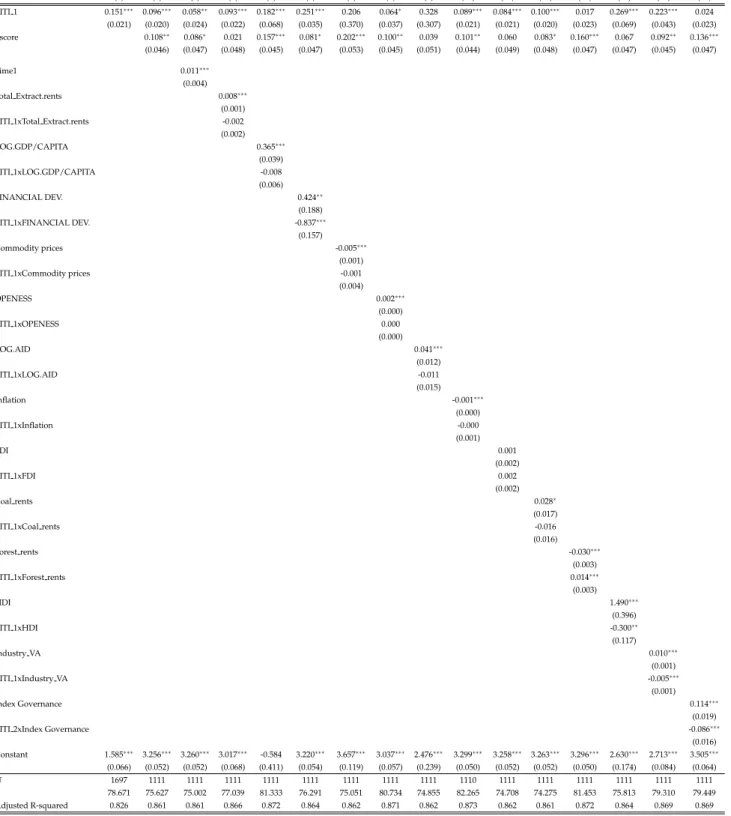
Table 1 reports the probit estimates of propensity scores on the full sample, which includes only
developing resource-rich countries, based on starting dates of EITI implementation (respectively to the date of commitment, date of the candidate, and date of compliance). Recall that EITI implementation is a binary variable. It takes the value one during the period that a given country implement EITI and 0 otherwise. Most of the coefficients are significant and have the expected signs for EITI commitment. Al-most all explanatory variables are also significant for EITI candidates and EITI compliance. Total extrac-tive rents, GDP per capita, commodity prices, AID, FDI, coal rents, forest rents, HDI, regulatory quality, and voice and Accountability are positively correlated with EITI implementation. However, financial development, industry value-added, institutional composite index, control of corruption, government effectiveness, and the rule of law are negatively associated with the likelihood of EITI implementation. The overall significance of the regression is reasonable, with a pseudo R2 of about 20%. After estimat-ing the propensity score for the sample, it is important to ensure that for each EITI member, there are at least one non-EITI members that have the same propensity score.
T able 1: Pr obit estimates of the pr opensity scor e EITI commitment EITI Candidate EITI Co mpliance (1) (2) (3) (4) (5) (6) (1) (2) (3) (4) (5) (6) (1) (2) (3) (4) (5) (6) T otal extract. rents 0.045 ∗ ∗ ∗ 0.048 ∗ ∗ ∗ 0.045 ∗ ∗ ∗ 0.057 ∗ ∗ ∗ 0.047 ∗ ∗ ∗ 0.067 ∗ ∗ ∗ 0.045 ∗ ∗ ∗ 0.048 ∗ ∗ ∗ 0.043 ∗ ∗ ∗ 0.055 ∗ ∗ ∗ 0.047 ∗ ∗ ∗ 0.064 ∗ ∗ ∗ 0.038 ∗ ∗ ∗ 0.039 ∗ ∗ ∗ 0.037 ∗ ∗ ∗ 0.049 ∗ ∗ ∗ 0.040 ∗ ∗ ∗ 0.050 ∗ ∗ ∗ (0.006) (0.006) (0.006) (0.006) (0.006) (0.007) (0.006) (0.006) (0.007) (0.007) (0.006) (0.007) (0.008) (0.008) (0.008) (0.008) (0.008) (0.008) LOG.GDP/CAPIT A 0.045 ∗ ∗ ∗ 0.042 ∗ ∗ ∗ 0.050 ∗ ∗ ∗ 0.053 ∗ ∗ ∗ 0.045 ∗ ∗ ∗ 0.079 ∗ ∗ ∗ 0.049 ∗ ∗ ∗ 0.048 ∗ ∗ ∗ 0.053 ∗ ∗ ∗ 0.056 ∗ ∗ ∗ 0.049 ∗ ∗ ∗ 0.080 ∗ ∗ ∗ 0.045 ∗ ∗ 0.043 ∗ ∗ 0.047 ∗ ∗ 0.056 ∗ ∗ 0.046 ∗ ∗ 0.077 ∗ ∗ ∗ (0.016) (0.016) (0.016) (0.017) (0.016) (0.018) (0.017) (0.017) (0.017) (0.017) (0.017) (0.019) (0.022) (0.022) (0.022) (0.023) (0.022) (0.024) Financial Dev . -2.499 ∗ ∗ ∗ -2.764 ∗ ∗ ∗ -2.454 ∗ ∗ ∗ -3.530 ∗ ∗ ∗ -2.649 ∗ ∗ ∗ -4.147 ∗ ∗ ∗ -2.608 ∗ ∗ ∗ -2.929 ∗ ∗ ∗ -2.405 ∗ ∗ ∗ -3.512 ∗ ∗ ∗ -2.764 ∗ ∗ ∗ -4.112 ∗ ∗ ∗ -3.309 ∗ ∗ ∗ -3.355 ∗ ∗ ∗ -3.191 ∗ ∗ ∗ -4.202 ∗ ∗ ∗ -3.488 ∗ ∗ ∗ -4.368 ∗ ∗ ∗ (0.591) (0.581) (0.594) (0.574) (0.586) (0.580) (0.625) (0.614) (0.628) (0.608) (0.618) (0.613) (0.838) (0.827) (0.844) (0.842) (0.828) (0.826) Inflation -0.015 ∗ ∗ ∗ -0.015 ∗ ∗ ∗ -0.013 ∗ ∗ ∗ -0.012 ∗ ∗ ∗ -0.015 ∗ ∗ ∗ -0.011 ∗ ∗ ∗ -0.026 ∗ ∗ ∗ -0.026 ∗ ∗ ∗ -0.025 ∗ ∗ ∗ -0.023 ∗ ∗ ∗ -0.026 ∗ ∗ ∗ -0.023 ∗ ∗ ∗ -0.036 ∗ ∗ ∗ -0.036 ∗ ∗ ∗ -0.035 ∗ ∗ ∗ -0.034 ∗ ∗ ∗ -0.036 ∗ ∗ ∗ -0.034 ∗ ∗ ∗ (0.004) (0.004) (0.004) (0.004) (0.004) (0.004) (0.005) (0.005) (0.005) (0.005) (0.005) (0.005) (0.007) (0.007) (0.007) (0.007) (0.007) (0.007) Commodity prices 0.048 ∗ ∗ ∗ 0.048 ∗ ∗ ∗ 0.046 ∗ ∗ ∗ 0.043 ∗ ∗ ∗ 0.049 ∗ ∗ ∗ 0.040 ∗ ∗ ∗ 0.056 ∗ ∗ ∗ 0.054 ∗ ∗ ∗ 0.054 ∗ ∗ ∗ 0.050 ∗ ∗ ∗ 0.056 ∗ ∗ ∗ 0.046 ∗ ∗ ∗ 0.025 ∗ ∗ 0.025 ∗ ∗ 0.024 ∗ ∗ 0.021 ∗ ∗ 0.024 ∗ ∗ 0.015 (0.009) (0.009) (0.009) (0.008) (0.009) (0.008) (0.010) (0.010) (0.010) (0.009) (0.010) (0.009) (0.011) (0.011) (0.011) (0.010) (0.011) (0.011) Openess (T rade) -0.002 ∗ -0.003 ∗ -0.003 ∗ -0.003 ∗ ∗ -0.002 ∗ -0.004 ∗ ∗ ∗ -0.004 ∗ ∗ ∗ -0.005 ∗ ∗ ∗ -0.004 ∗ ∗ ∗ -0.005 ∗ ∗ ∗ -0.004 ∗ ∗ ∗ -0.006 ∗ ∗ ∗ -0.002 -0.002 -0.002 -0.003 -0.002 -0.004 ∗ (0.001) (0.001) (0.001) (0.001) (0.001) (0.001) (0.002) (0.002) (0.002) (0.002) (0.002) (0.002) (0.002) (0.002) (0.002) (0.002) (0.002) (0.002) LOG.AID 0.411 ∗ ∗ ∗ 0.400 ∗ ∗ ∗ 0.401 ∗ ∗ ∗ 0.381 ∗ ∗ ∗ 0.418 ∗ ∗ ∗ 0.411 ∗ ∗ ∗ 0.385 ∗ ∗ ∗ 0.375 ∗ ∗ ∗ 0.380 ∗ ∗ ∗ 0.361 ∗ ∗ ∗ 0.390 ∗ ∗ ∗ 0.386 ∗ ∗ ∗ 0.465 ∗ ∗ ∗ 0.466 ∗ ∗ ∗ 0.463 ∗ ∗ ∗ 0.464 ∗ ∗ ∗ 0.463 ∗ ∗ ∗ 0.472 ∗ ∗ ∗ (0.046) (0.046) (0.045) (0.045) (0.047) (0.046) (0.048) (0.047) (0.047) (0.047) (0.048) (0.048) (0.067) (0.067) (0.067) (0.069) (0.067) (0.070) FDI 0.025 ∗ ∗ ∗ 0.024 ∗ ∗ ∗ 0.025 ∗ ∗ ∗ 0.022 ∗ ∗ ∗ 0.025 ∗ ∗ ∗ 0.027 ∗ ∗ ∗ 0.031 ∗ ∗ ∗ 0.030 ∗ ∗ ∗ 0.032 ∗ ∗ ∗ 0.029 ∗ ∗ ∗ 0.032 ∗ ∗ ∗ 0.033 ∗ ∗ ∗ 0.003 0.003 0.003 0.001 0.003 0.004 (0.008) (0.008) (0.008) (0.008) (0.008) (0.008) (0.008) (0.008) (0.008) (0.008) (0.008) (0.008) (0.007) (0.007) (0.007) (0.008) (0.007) (0.007) Industry V .A -0.026 ∗ ∗ ∗ -0.026 ∗ ∗ ∗ -0.026 ∗ ∗ ∗ -0.030 ∗ ∗ ∗ -0.027 ∗ ∗ ∗ -0.035 ∗ ∗ ∗ -0.024 ∗ ∗ ∗ -0.024 ∗ ∗ ∗ -0.023 ∗ ∗ ∗ -0.027 ∗ ∗ ∗ -0.024 ∗ ∗ ∗ -0.031 ∗ ∗ ∗ -0.018 ∗ ∗ ∗ -0.018 ∗ ∗ -0.018 ∗ ∗ -0.019 ∗ ∗ ∗ -0.019 ∗ ∗ ∗ -0.023 ∗ ∗ ∗ (0.006) (0.006) (0.006) (0.006) (0.006) (0.006) (0.006) (0.006) (0.006) (0.006) (0.006) (0.006) (0.007) (0.007) (0.007) (0.007) (0.007) (0.007) Coal rents 0.153 ∗ ∗ 0.146 ∗ ∗ 0.149 ∗ ∗ 0.142 ∗ ∗ 0.162 ∗ ∗ ∗ 0.087 0.137 ∗ ∗ 0.133 ∗ ∗ 0.133 ∗ ∗ 0.129 ∗ ∗ 0.144 ∗ ∗ 0.082 0.149 ∗ ∗ ∗ 0.148 ∗ ∗ ∗ 0.146 ∗ ∗ ∗ 0.141 ∗ ∗ ∗ 0.150 ∗ ∗ ∗ 0.107 ∗ ∗ (0.061) (0.061) (0.062) (0.060) (0.061) (0.059) (0.057) (0.056) (0.058) (0.056) (0.057) (0.054) (0.044) (0.044) (0.044) (0.044) (0.044) (0.043) For est rents 0.053 ∗ ∗ ∗ 0.057 ∗ ∗ ∗ 0.051 ∗ ∗ ∗ 0.064 ∗ ∗ ∗ 0.052 ∗ ∗ ∗ 0.059 ∗ ∗ ∗ 0.042 ∗ ∗ ∗ 0.047 ∗ ∗ ∗ 0.039 ∗ ∗ ∗ 0.053 ∗ ∗ ∗ 0.042 ∗ ∗ ∗ 0.049 ∗ ∗ ∗ 0.028 ∗ 0.030 ∗ 0.025 0.042 ∗ ∗ 0.029 ∗ 0.033 ∗ (0.012) (0.012) (0.012) (0.013) (0.012) (0.013) (0.013) (0.013) (0.013) (0.013) (0.013) (0.013) (0.016) (0.016) (0.016) (0.017) (0.016) (0.017) HDI 4.024 ∗ ∗ ∗ 3.897 ∗ ∗ ∗ 4.222 ∗ ∗ ∗ 3.820 ∗ ∗ ∗ 3.890 ∗ ∗ ∗ 4.053 ∗ ∗ ∗ 4.032 ∗ ∗ ∗ 3.907 ∗ ∗ ∗ 4.312 ∗ ∗ ∗ 3.846 ∗ ∗ ∗ 3.906 ∗ ∗ ∗ 4.057 ∗ ∗ ∗ 3.543 ∗ ∗ ∗ 3.493 ∗ ∗ ∗ 3.676 ∗ ∗ ∗ 3.291 ∗ ∗ ∗ 3.488 ∗ ∗ ∗ 3.764 ∗ ∗ ∗ (0.552) (0.547) (0.556) (0.538) (0.549) (0.546) (0.581) (0.575) (0.591) (0.569) (0.577) (0.576) (0.745) (0.743) (0.756) (0.743) (0.741) (0.752) Index Governance.(e) -0.331 ∗ ∗ ∗ -0.291 ∗ ∗ ∗ -0.129 (0.071) (0.075) (0.095) Cntrl of Corr uption(e) -0.428 ∗ ∗ ∗ -0.304 ∗ ∗ ∗ -0.211 (0.111) (0.116) (0.148) Gov . Ef fectiveness(e) -0.523 ∗ ∗ ∗ -0.578 ∗ ∗ ∗ -0.276 ∗ (0.121) (0.129) (0.163) Regulatory Quality(e) 0.202 ∗ ∗ 0.166 0.461 ∗ ∗ ∗ (0.100) (0.106) (0.146) Rule of Law(e) -0.492 ∗ ∗ ∗ -0.410 ∗ ∗ ∗ -0.096 (0.108) (0.114) (0.145) V oice and Account.(e) 0.545 ∗ ∗ ∗ 0.504 ∗ ∗ ∗ 0.521 ∗ ∗ ∗ (0.076) (0.079) (0.108) Constant -15.886 ∗ ∗ ∗ -15.376 ∗ ∗ ∗ -15.586 ∗ ∗ ∗ -13.983 ∗ ∗ ∗ -15.964 ∗ ∗ ∗ -14.330 ∗ ∗ ∗ -16.112 ∗ ∗ ∗ -15.486 ∗ ∗ ∗ -16.172 ∗ ∗ ∗ -14.414 ∗ ∗ ∗ -16.074 ∗ ∗ ∗ -14.492 ∗ ∗ ∗ -14.697 ∗ ∗ ∗ -14.716 ∗ ∗ ∗ -14.719 ∗ ∗ ∗ -13.791 ∗ ∗ ∗ -14.425 ∗ ∗ ∗ -13.669 ∗ ∗ ∗ (1.447) (1.418) (1.422) (1.364) (1.458) (1.378) (1.559) (1.525) (1.549) (1.486) (1.564) (1.493) (1.957) (1.959) (1.943) (1.901) (1.942) (1.928) N .O bs . 1221 1221 1221 1221 1221 1221 1221 1221 1221 1221 1221 1221 1221 1221 1221 1221 1221 1221 Pseudo R2 0.208 0.203 0.206 0.196 0.207 0.230 0.207 0.201 0.211 0.197 0.205 0.228 0.177 0.177 0.178 0.188 0.175 0.207 Standar d err ors in par entheses ∗p < 0.10, ∗ ∗p < 0.05, ∗ ∗ ∗p < 0.01. Dependent variable: EITI =1 if a country is ITIE and 0 otherwise . (e) = Estimate
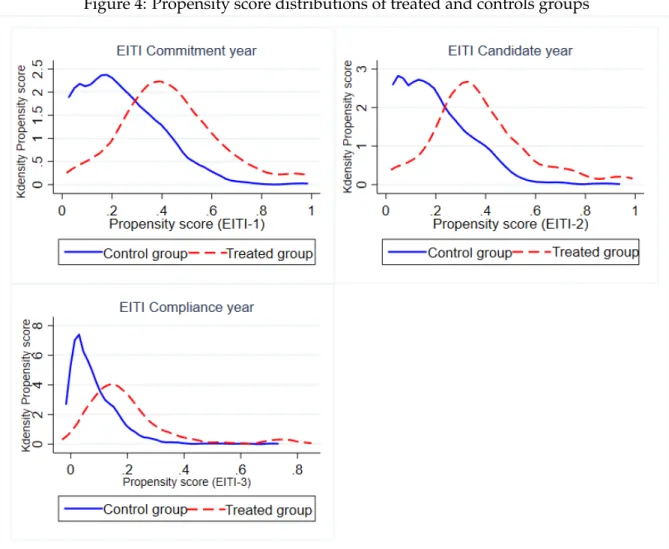
5.2 Common support of Propensity Score
According to Heckman et al.(1999), the common support is an area of overlap of treated and
un-treated individuals on the set of propensity score values. It ensures that for each of the un-treated indi-viduals, there is at least one individual in the control group with simulated observed characteristics
(Bryson et al.,2002). The two main techniques for determining common support are the comparison of
minima and maxima between the two groups of individuals (Dehejia and Wahba,1999) and
compar-ison of trimming distributions (Smith and Todd,2005). The first is to retain all treated and untreated
individuals, except those with no counterfactual. The propensity score of the latter is lower than the minimum (respectively higher than the maximum) score of the individuals in the control group. A dis-advantage of this method is that observations within limits will be discarded even if they are close to the limits. We use the second method, which estimates the density of the distribution in the two groups (trimming). We exclude the untreated individuals for whom the proportion of potential counterfactual is lower, i.e., the treated individuals with a propensity score very close to the propensity score of the
untreated individuals under consideration. Figure4shows a fictitious situation in which the propensity
score distribution supports the treatment group and the control group largely overlap, which is a good case for allowing matches. This indicates the existence of common support between EITI members and non-EITI members and verifies the second assumption to apply propensity score matching.
5.3 Results from matching of basic model
We use four PSM algorithms commonly used in the literature to match each EITI member with
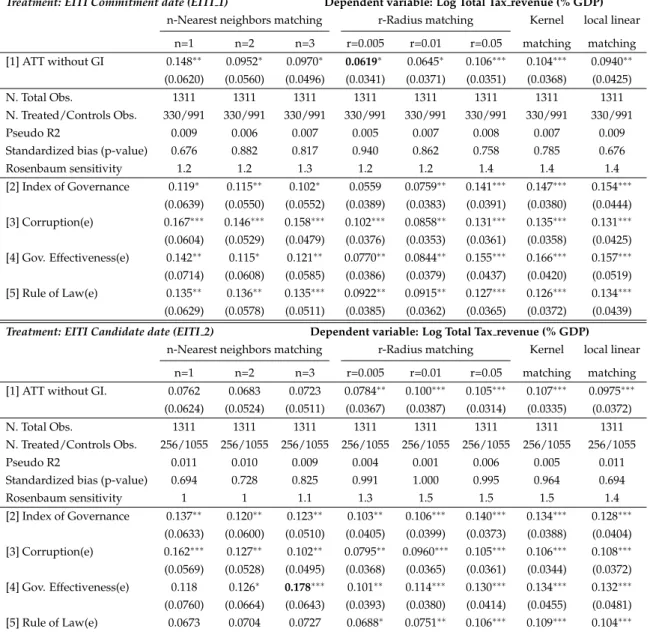
non-EITI members given the closeness of their propensity scores7. Table2reports the results from matching
concerning Total tax revenues, presented by the ATT (Average Treatment effect Treated). Recall that the treatment here consists of implementing the EITI. Considering that the treatment starts from the date of the country’s commitment or candidacy, the control group includes only non-ITIE countries. However, considering the treatment starting from the date of the country’s compliance to EITI standard, the control group is formed only by EITI commitment and/or candidate countries that have not yet obtained compliant status.
The first three columns show the results of n-Nearest neighbors matching (n-NNM), with n = 1,2,3
(LaLonde,1986). This technique is subject to the risk of inaccurate matching when the nearest neighbor
is numerically distant. The following three columns show the results of r-Radius matching (r-RM), which matches a treated unit to the control units with estimated propensity scores falling within a radius (or caliper) of length r (we consider a small radius r=0.005, a medium radius r=0.01, and a large radius r=0.05). In other words, each EITI member is associated only with a non-EITI member whose
propensity score falls within a predefined neighborhood to that of EITI member country (Dehejia and
Wahba, 2002). This approach has an advantage because it uses only the number of matching units
available within a predefined radius. A possible drawback is that it is difficult to know a priori the reasonable radius. We also consider Kernel matching (KM), where a treated unit (EITI members) is matched to a weighted average of all control units (non-EITI members). All non-EITI members are used but weighted by their propensity score closeness to EITI members. Moreover, all control units contribute to the weights, so the variance is then reduced. The further the control unit is from the treated
unit, the lower the weight (Dehejia and Wahba,2002). Finally, we consider the regression-adjusted local
linear matching (LLRM) in the last column. This method developed by (Heckman et al.,1998) is similar
to kernel matching but includes a linear term in the weighting function instead of kernel. Each of these types of methods has advantages and disadvantages. A contrast between the most straightforward method (Nearest neighbors matching) and the most complex (Kernel matching ) reflects the classic dilemma between bias and variance. In practice, it is recommended to test the sensitivity of the results
according to the method used. We followDehejia and Wahba(2002) and compute standard errors by
bootstrapping because the matching estimator has no analytical variance.
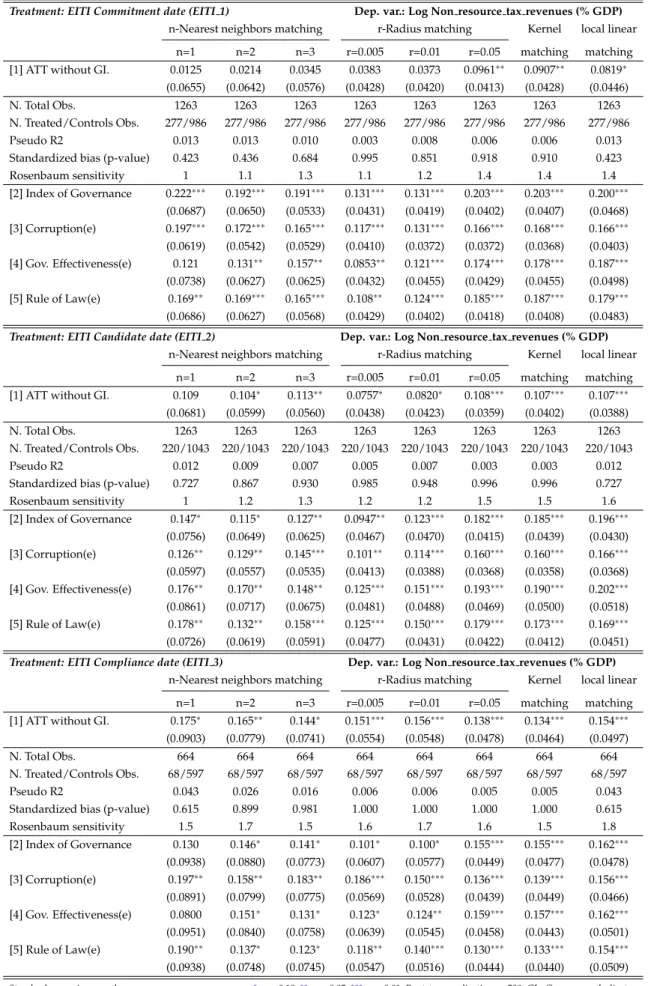
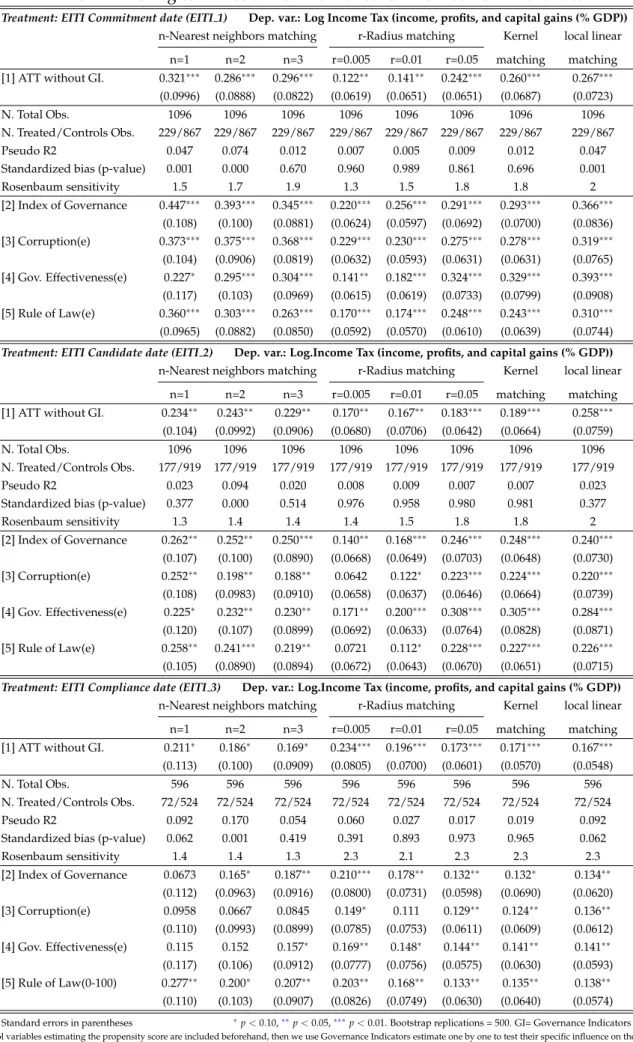
Table 2 indicates that the estimated ATT remains positive and statistically significant for all the
matching algorithms. Regardless of the stage considered (commitment, candidate, or compliance) or the date of implementation of the EITI, we can notice a significant improvement in the estimated ATT. Our main results are twofold.
First, EITI committed and candidate countries are more effective than non-EITI countries in tax revenue mobilization. According to our estimations, EITI members increases total tax revenues by an
average value ranging between e0.0619 to e0.178 (1.06 to 1.20) percentage points8 compared to non-EITI
members. Assuming that EITI implementation starts from the commitment date or the candidacy date, it turns out that the treatment effects on total tax revenues are slightly identical. This could be explained 7While matching EITI members with non-EITI members, we limit the analyses to ”common support.” This restriction
allows us to exclude treated countries whose propensity score is above the maximum or below the minimum of non-treaties. This is a sine qua non condition to avoid structural confusion bias when estimating treatment effects with the propensity score. (Dehejia and Wahba,1999;Lucotte,2012)
by the fact that the duration is quite short (2 years on average) between the countries commitment date and their Candidacy date. On the other hand, the improvement of the treatment effect is pronounced between these two stages if we consider them independently, i.e., at their respective periods (see Table
A1 and Fig. 5 for fixed effects regression using the function control approach ). Nevertheless, the
analysis of the stylized facts suggested that the median tax revenues are slightly higher for a country at the candidate stage than at the commitment stage.
Second, compliance with the EITI standard allows for additional tax revenues compared to the com-mitment and candidate status. This, because the ATT estimates using EITI compliance as the treatment variable, included in the control group, only those that are implementing the EITI but are not yet com-pliant (i.e., committed and/or candidate countries). In this case, EITI compliance as a treatment variable estimates the additional revenue that EITI committed and/or Candidate countries would receive if they were Compliant. According to our estimations, EITI compliance increases total tax revenues by an
av-erage value ranging between e0.0844 to e0.122 (1.09 to 1.13) percentage points compared to non-compliant
members (EITI committed and/or candidate countries).
Our results support the theoretical arguments presented in Section 2.3 and confirm stylized facts
(Section 3.2) that EITI implementation has encouraged the governments of developing countries to
improve tax revenue collection. We also control for the sensitivity of some indicators of governance quality by adding an index calculated by the principal component analysis, then individually. There is a clear improvement to the estimated ATT for all the governance indicators relating to commitment and EITI candidate status but mixed for compliance status. This could be explained by the fact that almost all non-compliant EITI countries have made significant and satisfactory progress and have, therefore, good institutions. In other words, the institutional governance of the two groups seems quite similar.
In addition to the graphic evidence of common support (Fig.4), we also check the quality of the
matching through the other three main diagnostic tests. First, the pseudo-R2 shows that our control variables significantly explain the probability of implementing the EITI, given that its values after
matching are ’fairly low’ (see for instanceSianesi, 2004; Caliendo and Kopeinig, 2008). Second, the
diagnostic test based on the standardized bias evaluates the balancing score (see for instanceSianesi,
2004; Caliendo and Kopeinig,2008; Lechner, 2001). According to Rosenbaum and Rubin (1985), the
p-value associated with the standardized bias should be above the critical value of 10%. The results sat-isfy the conditional independence assumption. This indicates no significant difference between ”EITI” and ”non-EITI” observable characteristics within the selected common support. Third, the Rosenbaum bounds sensitivity test shows whether there are unobserved variables that simultaneously affect the
treatment (EITI adherence) and the outcome variable (tax revenues) (Rosenbaum, 2002). The results
suggest that there is no hidden bias9. As a result, the matching estimators are robust. Our results
are robust to using an alternative measure of tax revenues (Non-resource tax and Income tax) and the different stages of EITI implementation.
9In order not to clutter the tables, we do not display the diagnostic tests of the control of governance indicators, but it