Dependency of Human Operator
Performance Quality upon Task Complexity
bySi-John Automo
B.S. Mechanical Engineering University of Minnesota, 1991Submitted to the Department of Mechanical Engineering in
Partial Fulfillment of the Requirements for the Degree of
Master of Science in Mechanical Engineering at the
MASSACHUSETTS INSTITUTE OF TECHNOLOGY
September 1996@ 1996 Massachusetts Institute of Technology
All rights reserved
Signature of Author:
Department of Mechanical Engineering August 9, 1996
Certified by:
_-(-- T-Iachael W. Golay Profesr of Nuclear Engineering Thesis Supervisor
Certified by:
Thomas E. Sheridan Professor of Mechanical Engineering Thesis Reader Accepted by:
Ain A. Sonin Professor of Mechanical Engineering O rc,-.:, ' Chairman, Committee for Graduate Students
DEC
0
3
1996
Dependency of Human Operator Performance Quality
upon Task Complexity
by
Si-John Automo
Submitted to the Department of Mechanical Engineering in Partial Fulfillment of the Requirements for the Degree of Master of Science in Mechanical Engineering
Abstract
Increasing task complexity is claimed to be responsible for causing human operating errors, while a significant number of system failures are due to operating errors. An experimental study reported here was conducted to isolate varying task complexity as an important factor affecting human performance quality. Earlier work concerning problems of nuclear power plants has shown that human capability declined when dealing with increasing system complexity. The goal of this study was to investigate further the relationship between human operator performance quality and the complexity of tasks served to human operators. This was done by using a simple, interactive, dynamic, and generalizable computer model to simulate the behavior of a human-operated dynamic fluid system. Twenty two human subjects participated to the experiment. They were intensively trained to be skillful before allowed to perform a task in the experiment.
The model contained 15 water tanks, arranged as 5 layer cascade. Each tank had two controllable outlet valves through which water could flow out of the tank, and one controllable inlet valve trough which water could flow into the tank. All tanks were connected in a closed loop which preserved the amount of water circulating in the system. Water valves shown in the computer display were simulated by sliders, movable by a computer mouse. Human subjects could control the amount of water in each tank by changing
opening of the slider attached to the tank. Each tank has a specific target level, at which water was supposed to be stabilized by human subjects. In each trial, the system was initially stable, meaning that the amount of water inside each tank was fixed within ± 10% acceptable level tolerance. After t seconds, the valves between N, number of tanks were perturbed. The values of these two parameters were randomly determined by the computer. Human subjects were told to immediately respond to return the system to a stable state
condition. Late response by the human subject caused the perturbations to propagate, potentially resulting into increased system complexity. Such a potential could be reduced as human subjects in the experiment responded to the initial perturbations only, using the knowledge that propagation could be diminished by restoring only the initially-perturbed tanks. Task complexity was quantified by means of two measures: the number of perturbed tanks and the information content of the system. The time required by a human subject to complete a task served as a measure of the human performance quality. The effects of task complexity on human reliability were also investigated in this experiment.
The experimental results shows that there exists a systematic relationship between the time needed to complete a task and the associated task complexity with significant variability around the averaged data. The variation of the human performance quality in this experiment might be caused by the existence of different
strategies used by human subjects to complete a task, by training factor, and by the need for more human subjects data. However, the results supported the second hypothesis: as the complexity of a task increases, the time required to complete the task increases, meaning the human performance quality drops. Plot of human reliability suggests the existence of a threshold value of information content of a task above which human reliability significantly drops. These ideas hopefully are generalizable for use in a model where human reliability depends upon the system complexity.
Thesis Supervisor: Michael W. Golay Thesis Reader: Thomas B. Sheridan Title: Professor of Nuclear Engineering Title: Professor of Mechanical Engineering
Acknowledgments
I would like to acknowledge the sponsor of this project, the United States Department of Energy. A special gratitude goes to my thesis advisor, Professor Michael W. Golay, whose patience and continuous professional guidance made this project very challenging and pleasant. Thanks also go to Professor Thomas Sheridan for being my thesis reader.
I also wish to thank Kurniawan Darmawangsa, who introduced me to NeXTSTEP programming and who helped me design the first version of CASCADE, the interactive software used in the human factor experiments. Thanks go to several UROP students who helped beta-test CASCADE: Marc Berte, Jeremy Lueck and Michael Margetts. Thanks go also to all the human subjects involved in the experiments.
Table of Contents
A b stract ... 2
Acknowledgments ... 4
Table of Contents ... 5
List of Figures and Tables ... 6
Chapter 1 Introduction ... 9 1.1 Background ... 9 1.2 Information Theory ... 12 1.3 Prior W ork ... 15 Chapter 2 Experimental M ethod ... 19 2.1 Introduction ... ... 19 2.2 Design M otivation ... 20
2.3 Experimental Design Approach ... 23
2.4 Description of the Experimental System ... 26
2.5 Description of the Tasks Assigned to the Human Subjects ... 31
2.6 Data Collection M ethods ... 36
2.7 Planning for Data Analysis ... 40
2.7.1 Quantification of Task Complexity and Human Performance Quality 41 2.7.2 Effects of Perturbation Propagation ... ... 57
2.7.3 Hypotheses ... 57
2.7.4 Experimental Task Completion Strategies of the Human Subjects ... 58
Chapter 3 R esu lts ... ... ... ... 61
3.1 Experimental Results 3.1.1 Individual Normalized W ater Level in Each Tank ... 64
3.1.2 The Sensitivity of the Water Level Stabilization Acceptance Criteria ... 69
3.1.3 Time Required to Stabilize the System as a Function of the Number of Tank Perturbations ... 72
3.1.4 Time Required to Stabilize the System as a Function of the Information Content ... ... ... 76
3.1.5 The Relationship of Human Reliability to the Number of Perturbations . 79 3.1.6 The Relationship of Human Reliability to the Information Content ... 85
3.1.7 The Effects of Perturbation Propagation ... 87
Chapter 4 Discussion ... ... 91
Chapter 5 Conclusions ... ... 97
References ... 99
Appendix A: The Governing Equations for the Cascading Waterfall Fluid System ... 101
Appendix B: Human Subject Data ... 110
List of Figures and Tables
Figure
Caption
2-1
The Graphical User Interface of the System.
2-2
Logical View of the Closed Loop Water Flow System
Corresponding to that of Figure 2-1.
2-3A
Curve Showing All Possible Cases of Perturbed Valves, N,,
and Corresponding Perturbed Tanks, N,.
2-3B
Curve Showing All Possible Cases of Perturbed Valves, N,,
and Corresponding Perturbed Tanks, N, (in Logarithmic Scale).
2-4
Curves of Probability Distribution of Perturbed Valves, N,,
and Corresponding Perturbed Tanks, N,.
3-1
Individual Tank Water Level Histories for a Case of Two Tank
Perturbations.
3-2
Individual Tank Water Level Histories for a Case of Nine Tank
Perturbations.
3-3
Individual Tank Water Level Histories for a Case of Five Tank
Perturbations.
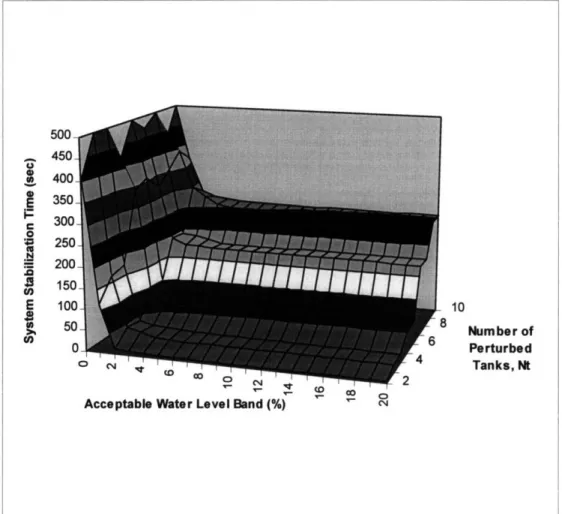
3-4
Example of Three-dimensional Surface Plot of Human
Performance Results in Stabilizing the System as Indicated by
the Stabilization Time as, a Function of the Number of Perturbed
Tanks, the Acceptable Water Level Band.
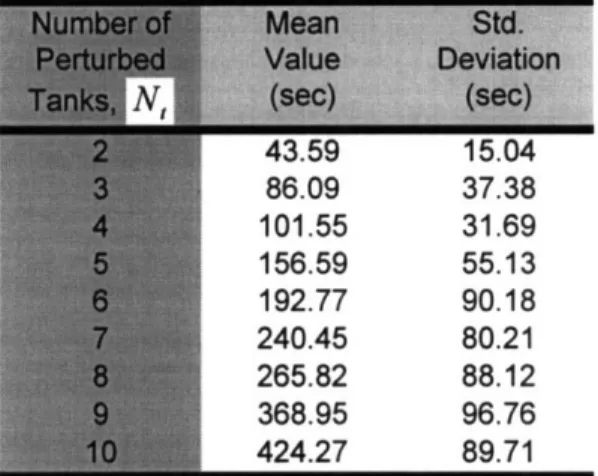
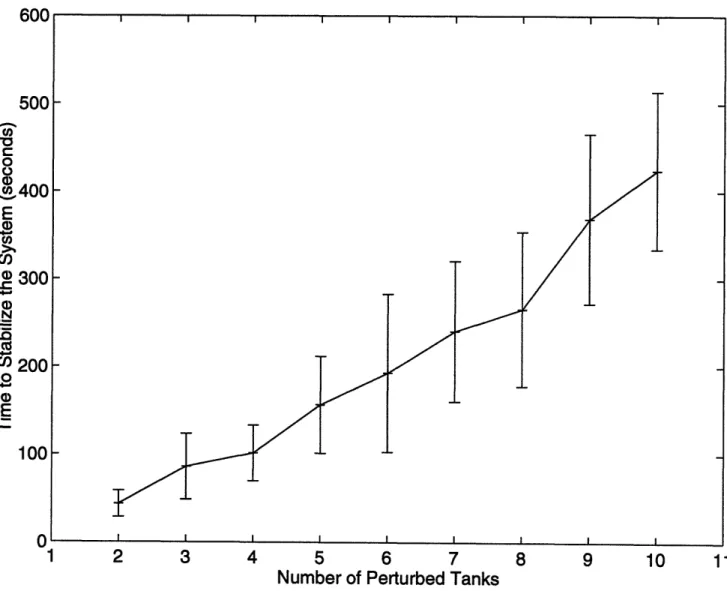
3-5
Plot of the Mean System Stabilization Time Duration (second)
as a Function of Number of Perturbed Tanks.
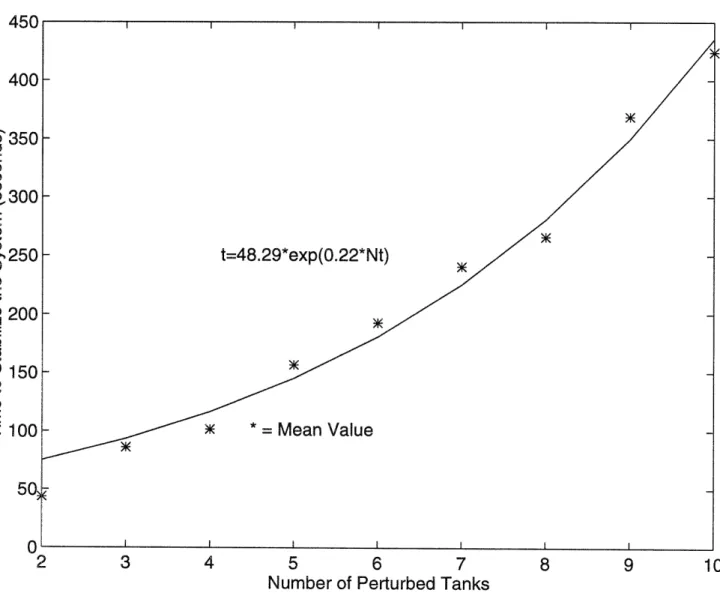
3-6
Least Squares Fitting of Human Performance Quality Data,
Showing the Mean Time Needed to Stabilize the System,
t,
versus the Number of Tank Perturbations, N,.
Plot of the Mean System Stabilization Time Duration as a
Function of Information Content, H.
3-8
Least Squares Fitting of Human Performance Quality Data,
Showing the Mean Time Needed to Stabilize the System,
t,
versus the Tank Information Content, H.
3-9
Plot of Mean Human Reliability as a Function of the Number of
Tank Perturbations, as the Time Limit was Increased.
3-10
Plot of Mean Human Reliability as a Function of the
Information Content, as the Time Limit was Increased.
3-11
Mean Time for System Stabilization as a Function of Task
Information for Several Values of Tank Propagation Time.
A-1
Schematic of Logical View of the Cascade Model.
A-2
Graphical User Interface of the System
B-1
-
Individual Human Performance Quality Data as a Function of
B-22
the Information Content
B-23
Average Data Associated with Figures B-1
-
B-22.
B-24
-
The Effects of Propagation
B-29
Table
2-1
Guidelines for Designing the Experiment
2-2
Experimental Design Approach
2-3
Factors Contributing to Human Operating Performance
2-4
An Example of How a Set of Tasks or Trials Were Served to the
Human Subjects.
2-5
List of the Information Collected During a Single Experiment
2-6
The Table Enumerating All Possible Cases of Perturbed Valves,
N,, and Corresponding Perturbed Tanks, N,.
2-7
Table of the Probability Distribution of Perturbed Valves, N,,
and Corresponding Perturbed Tanks, N,.
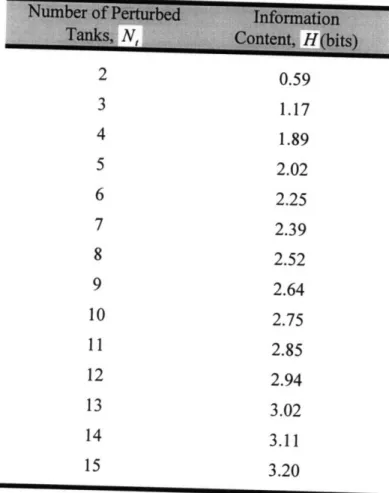
2-8
Information Content, H, versus Number of Perturbed Tanks, N,
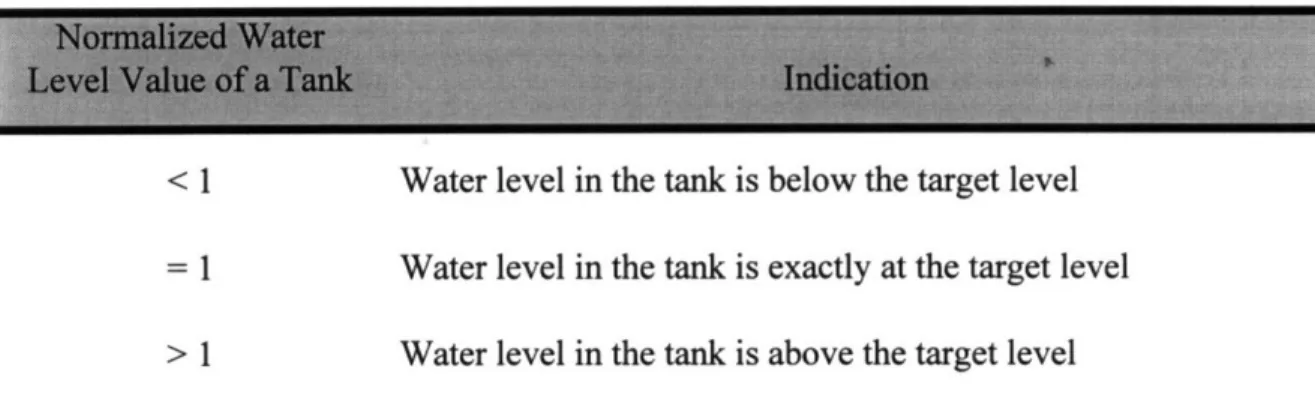
3-1
Physical Meaning of the Tank Normalized Water Level
3-2
Table of Time Required to Stabilize the System as a Function of
Number of Perturbed Tanks, N,.
3-3
Counts of the Number of Successes or Failures in
Accomplishing a Task Given a Maximum Allowable Time for
System Stabilization of z Seconds.
3-4
The Relationship between The Threshold Values of Human
Reliability and the Time Limit, z.
Chapter 1
Introduction
The purpose of the work reported here is to investigate the dependence of human operator performance quality upon increasing task complexity. This was done by using a simple, interactive, dynamic, and generalizable computer model to simulate the behavior of human-operated dynamic fluid system. Twenty two human subjects participated in the experiment with the computer model.
1.1 Background
The background and theory behind the work reported here, including the literature survey establishing the foundation upon which this work was motivated, are explained in this chapter.
There are several reasons why the study of human performance quality in system operations are significant. Some of these reasons are the following :
1. Human errors in system operations can be crucial, since human-operated system become more and more complex as a result of a recent trend toward greater automation and computerization (Park, 1987).
2. In system operations where the complexity of the tasks assigned to human operators varies, it is reasonable to expect operator performance quality to vary as well.
any of the following three purposes, which are analogous to those suggested by Hollnagel (1993):
(a) A pragmatic purpose, which is to provide a means for understanding when
specific human-operated system changes will carry the amount of task complexity beyond the capacity of the human operator.
(b) An engineering purpose, which is to provide a basis for improving the system
design, based on the knowledge of the task to be performed.
(c) A scientific purpose, which is to gain more knowledge and provide better theories about human-operated systems and operator performance quality as they depend upon changing task complexity.
3. A study by Meister indicated that 20 to 50% of all equipment failures are due to human errors, and a large proportion of these errors occur during system operations (Dhillon, 1986). This means that the reliability of the human element has to be included in an overall system reliability analysis in order to obtain a correct picture of the system reliability. This fact was first recognized by H. L. Williams in 1958.
Human errors can be classified into the following categories: operating errors, assembly errors, design errors, inspection errors, installation errors, and maintenance errors (Dhillon, 1986). Operating errors are those caused by operating personnel. Rigby suggested that most humans err because they have the capability of doing many different things in many diverse ways. Several more additional factors are believed to cause operating errors, such as improper procedures, high task complexity and overload
conditions, poor personnel selection and training, operator carelessness and lack of interest, and poor ergonomics.
The study reported here is concerned with the degree to which operating errors are affected by task complexity. Humans have limited capacities for perceiving, attending, remembering, calculating, and so on (Proctor, 1994). Errors are likely to occur when the task requirements exceed these capacity limitations. Hence, it is critical to understand the
relationship between the task complexity or system complexity and human reliability so that the systems may be built in such a way as to minimize operating errors. (Hermanson,
1994).
There are two difficult problems that must be solved in investigating such a relationship:
" First, that of how to isolate the task complexity from other factors causing operating
errors. In reality, it is impossible to fully exclude other factors. Carefully planning for a consistent experimental method can reduce the effects of other factors, however.
• Second, that of how to quantify the task or system complexity. Each system has a
uniqueness in terms of how many possible states that it can have. The quantification of complexity may be more difficult in the operation of a system whose complexity changes as a function of time. Usually, problem complexity is defined in terms of the system initial complexity, and any subsequent increase in complexity can be regarded as an element of the human operator response.
Generally, a scalar variable can be used as a task complexity index (He, 1990). This variable could be the number of alternative choices a decision maker faces. A more sophisticated technique of quantifying task complexity, as has also been widely used by researchers in investigating human perceptual and cognitive phenomena, is based upon information theory. This quantity is called the information content, regarded as the opposite of the entropy in terms of what it measures. Information theory is discussed in greater detail in Section 1.2.
The goal of the work reported here was to characterize conceptually and to build a computer model of a human-operated system, to carefully design an experiment utilizing this model, and to perform a consistent experiment which to determine the dependency of human operator performance quality upon a task of varying complexity.
1.2 Information Theory
Information theory is briefly explained in this section. It is the theory used in the task complexity quantification in the work reported here.
Information theory provides for the measurement of information. Information is defined as knowledge or news that reduces one's uncertainty or enhances the probability of being correct about the true state of a system (Park, 1987). Little information is given by a message that describes only a relatively known general truth or does not reduce any uncertainty associated with a problem. Information is perceived when uncertainty is reduced.
As one increases the amount of information concerning the state of a problem, the one's probability of making a correct decision about the problem is enhanced. The amount of information necessary to decide between two equally likely alternatives is called the bit, which is the unit of information content.
Information content is a measure of information contained within a system, which is useful for diagnosing the true state of a system. If there are n equal probable choices of the true system condition, the information content of the system can be calculated as:
1
H=log
2n=log
2-(11)
P
where H is the information content, and p is the probability of occurrence of a single
state.
In the case of unequal probabilities of the alternatives available to a decision
maker, a surprise value for a single event i , hi, can be defined as:
1
h,
= log 2
i(1.2)
where p, is the probability of the i -th event. The total information content is the weighted average of the surprise value according to the respective probabilities of occurrence of the different alternatives:
H
:
=
pih,
=
--
iPi
log
2pi
(1.3) Information content measures the order of a system, while to the contrary, the entropy measures the disorder of a system. The information content required to reduce the system disorder is as much as the entropy it takes to increase the system disorder. This fact makes both terms, information content and entropy, interchangeably used. This is also the basis for quantifying the complexity of the tasks performed by human subjects in the experimental work reported here.In the experiment reported here, the system used in the experiment was subject to a certain randomly selected perturbations which increased the system disorder. Returning the system to its initial state was the human subjects task. The quantity that could be calculated directly was the entropy of the system or task, as each task corresponded to an event referring to a particular set of perturbations serving to increase the system disorder. The probability of occurrence of such event, though unknown to the human subjects, was precisely known by experimental model designers. The entropy value, however, was also equal to the information content required to remove the system's disorder or to return the system back to its original state. The quantification of task complexity in the experiment reported here is based upon the information theory, and is discussed in greater detail in
1.3 Prior Work
Few studies have been performed recently concerning the dependence of human reliability upon task complexity. Studies by Golay, Hermanson, and He in the early
1990s had established a foundation for the experimental work reported here.
However, an information based theory of human performance was developed from as early as 1940s (Sanders, 1993). The theory was soon utilized in the
experimentation within cognitive psychology. The impact of the theory has slowly progressed, however, to the point that it is still unable to reveal the mysteries of human information processing. Despite this limitation, the concept of information content have frequently been used to describe the stimuli and responses associated with an information processing task.
In 1952, in research measuring the human response time to a random stimulus, Hick varied the number of flashing lights perceived by human subjects, while the human subject's task was to push certain buttons associated with the flashing lights (Hick, 1952). Hick discovered that the reaction time increased linearly with an increasing number of flashing lights. He concluded that the reaction time increased as the complexity of the situation increased.
Hyman continued on conducting an experiment very similar to Hick's a year later. However, he varied the probability of occurrences of the visual stimuli instead of the number of visual stimuli (Hyman, 1953). As he discovered the results, he concluded that reaction time was a linear function of the stimulus information. This finding progressed to become the Hick-Hyman Law.
In 1988, Seong, et. al. conducted a study applying Hick-Hyman Law, but they utilized the information theory to further develop a methodology for creating designs of nuclear power plant system which are efficient to diagnose. In the study, pumps and valves were networked and the information content present in the resulting arrangement could be calculated. The purpose of the study by Seong, et. al. was to reduce human error in diagnosing a system with failed components by reducing system complexity while assuring an efficient physical design at low cost. The study of complexity measures of fault diagnosis tasks had also been explored by Rouse, et. al. in 1979 and Golay, et. al. in
1988.
The principle of the Hick-Hyman work, is that the frequency of failure is a linear function of the system complexity index. In 1990, He, et. al. performed an experimental study in an effort to discover the dependence of human deductive capabilities upon problem complexity. The operator response situation in the experiment was constructed so that he only had partial information about the system. Under a time constraint of 60 seconds, the operator was allowed to make a certain number of diagnoses to determine the true state of the system. After each diagnosis, the computer would respond with some
information comparing the operator's diagnosis and the true system state. Thus, after each diagnosis, the operator would have additional information about the true state of the system. The results showed that Hick-Hyman principle was not a useful model for predicting the relation between the operator performance and system complexity in this case, as the results suggested the existence of a threshold value of complexity below which the operator performed very well. The operator performance deteriorated very fast after the threshold value of complexity was passed.
In 1994, Hermanson, et. al. built a computer simulated nuclear power system model for human factors experimental purposes, and had human subjects react to the perturbations of this system randomly served to them. The goal of the experiment was to measure human reliability in the light of differing amounts of task information content. Information theory was applied in this work. Based upon the earlier work described before, this work offered a hypothesis of finding the same kind of information threshold value as what previously observed by He, et. in 1990. The experimental results supported the hypothesis, and two conclusions were drawn. First, human reliability decreases monotonically with increasing information content. Second, there exists a threshold value of information content below which a human could deal with the task very successfully, but above which the success of an individual decreased steadily.
The success of these studies motivated the experimental work reported here. This study made use of information theory as well. The significant differences are the
following:
" The model created is more general or generalizable to other engineering fields, as it
utilizes a simple fluid dynamics problem rather than a nuclear power plant problem.
" The model utilizes a dynamic closed-loop control of a system, because many
human-operated physical systems are dynamic systems. Section 2.4 describes this model in detail. Also a dynamic close-loop system can require human subjects to make decisions in a very limited amount of time. Human operators typically will be prone to error under such conditions.
" The calculation of information content in the system for any particular task presented to the human subjects was based upon careful calculations of the probability of all possible alternative events as part of the task complexity quantification.
• Propagation of perturbations were introduced to a dynamic system. The problem
complexity could be defined in terms of the system initial information content far more easily than if it were defined by taking into account the propagation of the
initially-introduced perturbations. A sample of experimental results showing the perturbation propagation effects was analyzed in this work.
The goal of the experiment in the work reported here was to investigate the dependency of human operator performance quality upon task complexity. The hypothesis is that the human performance quality decreases as the task complexity
increases. The existence of a one-to-one relationship between human operator performance quality and task complexity is suggested in the hypothesis being tested.
Also, an additional hypothesis of this work is that an exponential form is obtained in the relationship between human operator performance quality and task complexity. The human operator performance quality measure used was the time needed to stabilize the perturbed system. If human reliability was the measure of human performance quality, there may exist a threshold value of human performance quality beyond which the human reliability abruptly drops, similar to what have been discovered by He and Hermanso
Chapter 2
Experimental Method
2.1 Introduction
Two things are described in this chapter:
" The conceptual design and implementation of the experiment performed in the work
reported here
m The associated experimental method.
The conceptual design of the experiment performed in the work reported here was motivated by a set of rules as is discussed in Section 2.2. This design motivation offers certain guidelines that are reflected by the experiment. The design for the experiment was developed in an iterative process focused upon obtaining a reliable experimental method. The design approach in conjunction with the relevant guidelines is discussed in
Section 2.3.
The experiment utilized a personal computer with an Intel 486-based processor, capable of simulating the experimental system and tasks of varying complexity very well. Section 2.4 is devoted to the description of the experimental system, while the section following it fully describes the human subject tasks alone. In the experiment, these tasks were exposed to and completed by the selected human subjects.
Preparing for data collection was crucial in our work, since a good experiment demands a reliable, accurate and rapid data collection method. Section 2.6 explains both the manual and automatic data collection methods used in the experiment.
Section 2.7 explains the plans for data analysis that had to be developed prior to the experiment. These plans included the system identification, such as determination of all components and variables having the potential to affect the human operator
performance. The most critical plan for data analysis in this research study was to quantify the task complexity, given the requirement of successfully finding a one-to-one correlation between the task complexity and the human performance quality. Such correlation would be determined by the experimental results. However, based upon the quantification of task complexity and earlier research studies, hypotheses could be suggested. The experimental results would then reveal the validity of the suggested hypotheses.
Finally, Section 2.8 describes all of the strategies used by the human subjects in completing the tasks served to them in the experiment. Confirming that the different strategies were feasible and available to the human subjects would help in explaining the variation of human performance quality across all the different strategies performed by the human subjects.
2.2 Design Motivation
The experiment was used to measure human performance quality in tasks of varying complexity. As is discussed previously, most system failures are caused by human
operating errors. These errors originate from several sources, and one of them is task complexity. Human capacity to deal with a task decreases as the task complexity rises. A study by Meister (Dhillon, 1986) indicated that 20 to 50% of all equipment failures are due to human errors. Most of these errors occur while humans operate the system's equipment. In many such situations as humans operate the system's equipment, the tasks served to the human operators appear to be complex enough for them to lose their
capacity to successfully deal with the associated tasks.
The experiment conducted in the work reported here was motivated by the
significance of investigating human performance quality against task complexity, and by how the results of such investigation can help system designers prevent system failures due to human errors, the experiment reported here was conducted. The experiment was focused upon isolating task complexity as the dominant factor affecting human
performance. The experiment also reflected several important guidelines, listed in Table 2-1.
The experiment performed in the work reported here was based upon tests
involving volunteer human subjects attempting to control a dynamic system, the behavior of which was simulated using a personal computer. The difficulty of the problems served to the subjects was varied and the corresponding time needed to stabilize the system was measured.
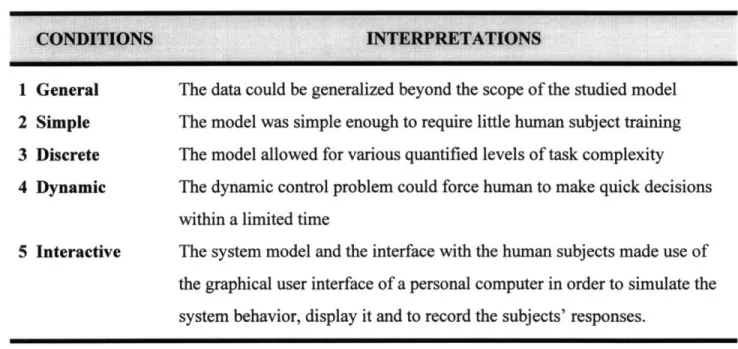
Table 2-1. Guidelines for Designing the Experiment
CONDITIONS
General Simple Discrete Dynamic 5 Interactive INTERPRETATIONSThe data could be generalized beyond the scope of the studied model The model was simple enough to require little human subject training The model allowed for various quantified levels of task complexity The dynamic control problem could force human to make quick decisions within a limited time
The system model and the interface with the human subjects made use of the graphical user interface of a personal computer in order to simulate the system behavior, display it and to record the subjects' responses.
In designing this experiment, the computer model of the system in this experiment had to obey the following conditions; to be:
" General
" Simple
" Discrete
" Dynamic " Interactive.
Being general means that the data collected could be generalized beyond the scope of the model. The model in this experiment utilized a fluid dynamics control problem, and is explained in the following sections. The purpose of this requirement is that the implications to other human operated system could be established.
The system had to be simple enough in order for one to learn easily how to control it, so as to require reasonably little human subject training. However, it had to allow for various levels of task complexity.
The system, modeled as a human control problem, had to be dynamic with a small time scale of variation so that the human subjects were forced to make quick decisions within a limited time. Human errors normally happen under such condition.
The model of the system and the interface with the human subjects made use of the NeXTSTEP 3.2 graphical user interface in order to simulate the system behavior and to display it, and to record the subjects' responses. The human subject could interact with the program just as in a computer game. The interaction between a human subject and the system is discussed in detail in the following sections.
Hence, those guidelines were reflected in the system developed here for the purpose of investigating the human performance quality in tasks of varying complexity.
2.3 Experimental Design Approach
This section describes the experimental design approach used in conjunction with the guidelines previously stated.
The system used in the experiment is modeled to present a fluid dynamics control problem. This system is explained in greater detail in the next section. Implemented as a computer model, the system reflects the five desirable conditions stated in the previous
section. In order to be useful, it was necessary for the computer software to be tested and debugged thouroughly. The system was then carefully analyzed so that the roles of all of the variables affecting the operator performance were determined.
The next step in the approach was to select some people having the potential to become good human subjects. On the basis of proximity, native capabilities and interests, MIT engineering students were selected and paid for participation in this experiment. The engineering students, who were selected to participate as human subjects, were presumed to have good insight into the system prior to training. Then, they went through sufficient training to become familiar with the system. During the training, the human subjects were asked to perform some randomly selected tasks. If they could perform several number of tasks reasonably well in a consistent manner, they were judged to have gained enough familiarity with the system to permit them to be used to
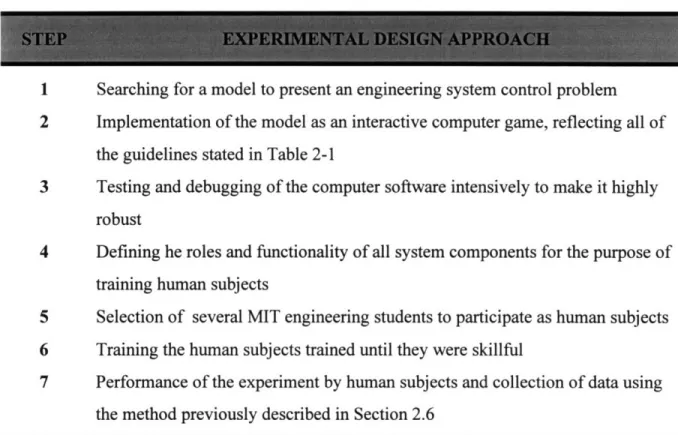
Table 2-2. Experimental Design Approach
1 Searching for a model to present an engineering system control problem 2 Implementation of the model as an interactive computer game, reflecting all of
the guidelines stated in Table 2-1
3 Testing and debugging of the computer software intensively to make it highly robust
4 Defining he roles and functionality of all system components for the purpose of training human subjects
5 Selection of several MIT engineering students to participate as human subjects 6 Training the human subjects trained until they were skillful
7 Performance of the experiment by human subjects and collection of data using the method previously described in Section 2.6
become fully trained. Therefore, the role of training as one of the factors affecting human performance could be reduced, and hopefully is eliminated. How much training required by each human subject varies depending on his/her skills. For example, a human subject who is a computer game player usually does not need as much training as other human subjects who are not game players.
After training, the human subjects were asked to perform the tasks of the real experiments. Which specific tasks they were exposed to, is explained in great detail in the next section. Their performance for each task was recorded. If the performance turned out to be significantly improved during the experiment, the training factor was still
dominant. In such cases, the human subjects were still in transition to the fully-trained performance regime. The data recorded from individuals still in the transition regime were eliminated from the final state.
The tasks were served to the human subjects in sets. One set consisted of 9 tasks. How many sets of tasks were completed by each individual depended upon the
consistency of the results obtained. For the same level of task complexity, the human performance was not expected to vary greatly. These variations could not be totally eliminated, however. In refinement of the experiment, factors other than task complexity were significantly reduced prior to the collection of data from the experimental subjects.
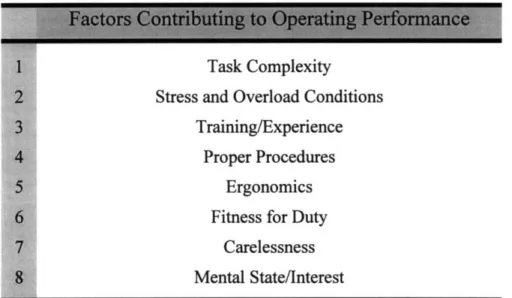
Table 2-3. Factors Contributing to Human Operating Performance
Partly Taken From H.S. Blackman & J.C. Byers, Idaho National Engineering Laboratory-LMIT. In
The mental states of the human subjects had to be considered while the
experiment with them were being conducted. A useful human subject had to be able to concentrate on his/her goal of successfully accomplishing the tasks served to him/her. A mental state deviating from such a goal could impair his/her performance. In practice, human subjects were allowed to take a break after several sets of tasks. The break duration was limited to a value less than 10 minutes, however, so that their capabilities would not cool down.
This section describes the experimental design approach used in our work. This work concentrated upon training of the human subjects. The results of the experiments would be inconclusive or would not serve the experimental goal if the degree of training were still an important factor of performance. That is why all human subjects were ensured to be highly skillful prior to data collection from the experimental tests.
2.4 Description of the Experimental System
This section describes the system used in the experiments. All important components and variables of the system are introduced. Their roles in affecting human performance
quality are described in Section 2.7.
The closed-loop system consisted of 15 water accumulator tanks and 30 control valves as can be seen in Figure 2-1 and Figure 2-2. The system presents a fluid dynamics control problem, where the driving force causing liquid flow is the gravitational
acceleration. Each tank functioned as a water container. By modifying the opening the flow area of a valve, a human subject could control the water flow rate through the valve.
The flow rate of the water coming out of a valve was modeled as being proportional to the valve flow area, since the valve surface friction was modeled to exist. The net flow rate experienced by a tank, the difference between the tank outlet and inlet flow rate, affected the rate of change of the tank water level according to Equation (A.26). Appendix A presents the derivation of the system differential equations, based on the conservation of mass or continuity principle.
There were two kinds of valves for each tank: inlet and outlet. Each tank had two outlet valves and initially, each tank was filled with water at a certain steady level. The water level in the tank could be controlled by means of any of the valves connected to the tank. Since each valve connected a pair of tanks, the water levels in the two connected tanks could be changed by means of a change in the corresponding valve flow area. Opening an inlet valve would increase the water flow into a tank, while opening an outlet valve would decrease the water flow out of the tank.
The tanks were arranged into five layers of cascade. The first layer consisted of a single tank, the second layer had two tanks, the third layer consisted of three tanks, and so on as shown in Figure 2-1 and Figure 2-2.. All tanks were shown on the computer screen to have the same height. However, the modeled tank capacity was very large, thereby, precluding the possibility of overflow (see Section 2.5). The cross sectional area for each tank was not the same between cascade layers. However, the total cross sectional area of all tanks in each layer was designed to have the same value. As a result, the tank in the top layer -there was only one tank in this layer -had the largest cross sectional area in the
system and its area was equal to five times the area of each of the tanks in the fifth, or bottom layer.
E CO 0 *M'-4
I-0
10 Cl '-m4 •mq !, cceThis kind of arrangement would give each layer the same capacity of storing water. Each tank in the first four layers was connected to the tanks just above it and to the tanks just below it as shown in Figure 2-1 and Figure 2-2. All tanks in the first four layers experience the downstream water flow. This is not the case for the fifth of bottom layer. In the bottom layer, all tank outlets were connected to the tank at the very top layer. The total flow rate into the top tank was modeled as being equal to the sum of the outlet flow rates from the tanks of the bottom layer in the cascade. This arrangement created a closed-loop flow system where the total volume of liquid in the tanks remained constant. Linking flow feedback to the top tank layer conserved the amount of water circulating and made the system stable behavior be controllable by human subjects after the perturbations were introduced to the system . Imposing a certain target water level and level tolerance for each tank, within which the human subjects had to re-stabilize the water within the system, forced the human operator to respond quickly to any system perturbation. The human subject tasks are explained more clearly in Section 2.5.
The water levels in the tanks and the positions of the valves were described in terms of by rectangular view bars and sliders on the computer monitor as parts of the NeXTSTEP user interface pallets. As a result, the water motion could be clearly
animated in the display. The slider values were adjustable by the means of the computer mouse.
The water flow rate coming out of a tank was proportional to the square root of the product of the water level in that tank, and the corresponding outlet valve flow area.
The feedback flow was based upon a negatively signed gravitational constant, which resulted in upward flow. All other factors like friction factor were included as part of the
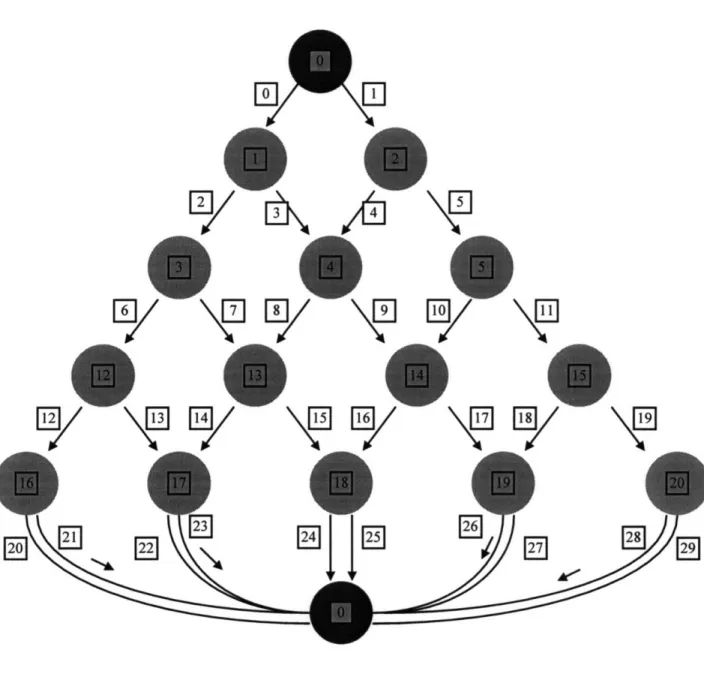
Figure 2-2. Logical View of the Closed Loop Water Flow System
Corresponding to that of Figure 2-1. Each circle or node denotes a tank and
each line with arrow denotes a valve. This figure shows the identifying
code numbers of the valves and tanks of the system. These identifiers are
used subsequently in the experimental data analysis.
M-Li
M,-\
LAl
\
1U
V__\L 7
UV~
D I
2
kV
F2
Oý
E]
r291
l____
/ " Ij "ZI
r r\L U/ \ ý
J \ I I I.^Ný,
U/Y
.. ii I.m .I----flow proportionality constant.
Figure 2-2 shows the schematic or logical view of the system corresponding to the graphical user interface of the system depicted in Figure 2-1. A tank is represented by a filled circle or node, numbered from 0 to 14. A valve is shown by a line, connecting two tanks. Notice that all tanks at the fifth (bottom) layer are connected to the top layer. This is done in order to fulfill the close-loop flow requirement of the system.
The logical view is helpful in the quantification of task complexity, as is
discussed in Section 2.7.1. In quantifying the task complexity of each perturbation, the number of cases in which a fixed number of perturbed valves were connected to a specific number of perturbed tanks were required to be found (see Section 2.7.1). The logical view of the system is almost the same as a binary tree structure, except for the connection between the bottom and top layers. In counting the number of possible cases where a fixed number of perturbed valves were connected into a specific number of perturbed tanks, the binary tree data structure and the associated search algorithm were used. For each tank that was perturbed, the node was marked as "visited". The total number of visited nodes would then be equal to the number of perturbed tanks.
2.5 Description of the Tasks Assigned to the Human
Subjects
In becoming trained, the human subjects were required to master both the functionality and control skills of the system. Then they were ready to participate in the experiments.
The following section describes the tasks served to the human subjects in the experiments.
The computer model used in the experiment was designed to be interactive.
Pressing a start button in the display activated the system. The following situations would then happen as the computer program was run.
At the beginning of an experimental run, the system was stable. Each tank contained water at a certain stable level, consistent with the settings of its associated control valves. After a short randomly selected period of time, the system was disturbed by a randomly selected set of valve perturbations expressed as random changes in the valves property. These perturbations were merely the results of random changes in valves property. As is explained in the previous section, a valve proportionality constant affected the flow rate of water coming into or out of the corresponding tanks. Any single change of the valve property is defined as a valve perturbation. The system itself had 30 valves, letting the number of valve perturbations range from 1 to 30.
As the water levels in some tanks might be affected by these valve perturbations, all the tanks were potentially subject to perturbations as well. Hence, the valve
perturbations were translated into tank perturbations. There were 15 tanks in the system, resulting in a maximum of 15 possible tank level perturbations. Any perturbed tank either lost or gained water, compared to its initial inventory. In the computer display, the perturbed tank was marked by a red dot, located just below the tank. This indicator told the human subject exactly which tanks, but not which valves, were being perturbed. Hence, human subjects could see the perturbations before responding by the means of these visual display:
* The red dot indicator, located just below the perturbed tank, * The water level change in the perturbed tank.
As previously stated, each tank contained water at the same level before occurrence of the perturbations. Each experiment was begun from this system state, when the water level was inside a band whose height was 20% of the tank height. Following the perturbations, the task of a human subject was to return the system to stability as soon as possible and in a consistent effort. If the water level was not in motion at any level within that + 10% band, the tank was stable. Consequently, when all tanks were in such condition, the system was said to be stable. Or in other words, the subject's task was to adjust any necessary valve openings in order to return the water level within the ±10% band. The human subject needed to keep the system stable for at least 5 seconds in order to be judged to have completed the task successfully. The computer automatically stopped running after the human subject completed a task successfully. The human subject data -the number of valve and tank perturbations, the time required to stabilize the system, and the normalized water level as a function of time in each tank -were all recorded as the experimental run proceeded.
During this transient period, as a human subject struggled to stabilize the system, water might flow excessively into a perturbed tank. In this case, a warning sign appeared just above the tank informing the human subject about the overflow, indicating that the
tank's water level was greater than the full level, indicated on the computer monitor. In order to conserve the volume of water circulating in the system, the water overflowing into a tank was not displayed but stored as part of the total amount of water inside that
tank. Hence, virtually all tanks had unlimited heights, but a warning was given when any tank had been filled with water beyond its displayed height. Hence, there was no real overflow of water within the system. The warning symbol consisted of a red dial capable of showing the human subject of how much overflow that the tank had experienced. As a result, the human subjects could see the excess of water level from the red dial above the associated water tank.
It was critical to stress to the human subjects that these tasks had to be performed immediately after the initial perturbations occurred. Late response would permit the perturbations to propagate to downstream tanks. For example, when a tank of interest kept losing the water which it stored because of a late response by a human subject, the tanks just below it would also be perturbed even if they and their valves were previously undisturbed.
There were two types of perturbations. The first type of perturbation, termed an initial perturbation was caused by random changes in a valve property, generated by computer program. The second type of perturbation came from the propagation of a tank level change due to any of these two sources: the initial perturbations and subsequent human errors.
The level propagation caused by the initial perturbations was not prevented by the human subjects. Over a time scale, ranging from seconds to about one minute, this type of propagation could occur. The number and magnitude of the initial perturbations were large enough to affect other tanks which were initially undisturbed, even though the human subject tried to respond as quickly as he/she could.
A tank perturbation caused by propagation could be repaired by a human subject without touching any valves directly connected to the propagated tank. In fact, a human subject could concentrate upon only the initially perturbed tank. If the human subject responded fast enough to the initial perturbations, all other propagation could be consequently repaired as well. When there were a large number of perturbations, some level propagation could hardly be prevented, thereby tempting the human subject to change the opening of the valves directly connected to the propagated tank. As a result, the system might be somewhat in chaos with the propagation eventually affecting all available tanks.
The second type of perturbation was caused by human errors. When human subjects made incorrect decisions, leading to the unnecessary touching of sliders, a further system perturbation could occur.
The human subjects realized that they did not have to touch unnecessary valves, and that such actions could increase the number of perturbations. These perturbations were caused by changes in the properties of certain valves. Touching of previously unchanged valves made the system harder to repair. As a result, the effective task complexity could be increased due to the increased number of disturbed tank. If all human subjects were aware of the importance of touching only the initially-disturbed valves, the initial number of perturbed tanks could be used to represent the task complexity very well.
How fast the human subject was supposed to react to a set of valve perturbations, depended on the magnitudes of the perturbations themselves. The human subjects were made aware of the fact that the system was designed to be equally sensitive in each of the
five cascade layers. Being equally sensitive meant that the capacity of a tank receiving or disposing of water had to be proportional to its capacity for holding water. With that motivation, valves connected to different tanks had different capacities of passing water through themselves. A valve capable of passing a large amount of water was identified by its larger size, with the smallest change of its opening having a greater effect upon the flow rate than that of a valve of smaller size. Hence, the tank at the top layer had the largest cross sectional area and largest outlet valve size while each of the five tanks of the bottom layer had the smallest cross sectional areas and the smallest outlet valve sizes. This arrangement could help to prevent unnecessary accumulation of water at certain tanks or layers when the human subjects had too little control of what would happen.
The equal sensitivity concept was physically presented in the computer display. Since all tanks were equal in height, larger cross section areas of the tanks were shown by larger rectangular bases in the computer interface. Similarly, the larger valve capacities were simulated by means of larger slider sizes.
2.6
Data Collection Methods
This section describes the methods used to collect the experimental data. Data were collected from 22 students by using both automatic and manual methods. These methods were kept consistent with the common standards human performance data collection methods (Dhillon, 1986). The computer acted as an instrument for automatic data recording of task performance. The manual method was demonstrated by sampled observations of the human subject characteristics in performing a particular task and also
by interviews with the human subjects. Most of the data were recorded automatically,
because automatic data recording was capable of collecting the human subject data such as water level and number of perturbations reliably, accurately and rapidly. This data recording method was repeatedly tested for its robustness before it was used for the experiments.
Each human subject carried out trials that came in sets. Each trial or task represented a certain amount of complexity. Although the system had 15 tanks, only a maximum of 10 tank perturbations were programmed to initially occur. Propagation of these initial perturbations was expected to happen, so up to a maximum of 15 tanks were expected to be perturbed. The time it took for a subject to complete a system stabilization task ranged from just under half a minute to about 10 minutes.
As the amount of water in the system was conserved, the system could experience
as few as two initial perturbations. One set of trials consisted on nine tasks, each of them
corresponded to the number of initial tank perturbations ranging from 2 to 10. However,
each task within a set was not presented in the order of its number of initial tank
perturbations, but rather were presented in a random order. An example of a typical case
is shown below.
Table 2-4. An Example of How a Set of Tasks or Trials Were
Served to the Human subjects
1 2 3 4 5 6 7 8 9 8 5 4 10 7 9 2 6 3
In each trial, the following information was automatically recorded:
1. The human subject's initials.
Hence, the human subject was able to identified for an interview after the experiment.
2. The stabilization time step, measured from the moment when the initial perturbations occurred until the system stability was restored. During each second after the
perturbations occurred until the end of the case trial, the normalized water level was recorded.
3. The number of slider and tankperturbations. 4. The locations of the perturbations.
5. The magnitudes of the perturbations.
For perturbed sliders, this referred to the change factors of their proportionality constants. For the perturbed tanks, this referred to their volumetric change factors.
6. The normalized water level in each tank.
This referred to the ratio of the actual water level to its initial stable level. The normalized water level was used as a stability index. If it were equal to unity, this meant the tank was at a stable position.
Table
2-5.
List of the Information Collected During a Single Experiment
1 Stabilization Time, measured from the start of perturbations until the end of each trial 2 Human Subject's Initials
3 Numbers of Perturbed Sliders and Perturbed Tanks 4 Locations of Perturbations
5 Magnitudes of Perturbations 6 Normalized Water Levels
--2.7
Planning for Data Analysis
This section explains the plans for data analysis that had to be formulated prior to the start of the experiments. These plans included the system identification, used to determine all components and variables having the potential to affect the human task performance. The most critical challenge in this research study was to quantify task complexity, given the requirement of finding a one-to-one correlation between the task complexity and the human performance quality. Such correlation would be determined by the experimental results. However, based on the quantification of task complexity and earlier research studies, hypotheses could be suggested. The experimental results would then reveal the validity of an associated hypothesis.
Data analysis began with system identification, requiring that all components and variables that might affect the human performance be identified. The identification was also made before the data collection method was prescribed into the computer program. The information recorded during the trials were the historic variables affecting or dependent upon the human performance.
Before the effect of task complexity upon human operator performance could be determined, the task complexity had to be defined and quantified, and the human operator performance had to be defined as well. Then, a hypothesis could be established based on the quantification of the complexity. The plans also include the description of all
possible strategies available to the human subjects in order to complete the tasks served to them.
2.7.1 Quantification of Task Complexity and Human
Performance Quality
Prior to the experiment, there was a need for establishing hypotheses. The hypotheses would give a direction of what to expect and how to present useful experimental results associated with the experimental goal. These hypotheses could be established when the task complexity had been quantified. This section describes the quantification of task
complexity and human performance quality.
The following treatment was based upon observations and earlier studies of human tasks performance. A human subject in our experiment required more time to
re-stabilize the system as more initial perturbations were introduced into the system. The stabilization time was correlated to the number of perturbations. A successful
quantification involved finding a systematic correlation between the two variables. Based upon the facts above, the stabilization time was chosen as the measure of the quality of human operator performance. The more time that a human subject needed to stabilize the system, the lower was his performance quality. Several other quantities could also be observed from the plot of time versus task complexity. Human reliability, defined as the probability that a human operator could successfully complete a task within a given time frame, could serve as another measure of human performance quality.
The number of perturbed tanks -or simply the number of perturbations -increased
water levels, were perceived by a human subject during an experiment. The more tanks that were perturbed, the more complex was the task to stabilize the system.
Another idea of measuring the task complexity of a given system was based on the information theory. Information content can be defined as follows:
Ns
H = -" pi log
2 (Pi), (2.1) i=1where H, n, and p, denote, consequently, the information content, the number of system
states, and the probability of occurrence of the i"h state, respectively. The unit of the information content is the (dimension-less) bit.
For the system used in the experiment, each task had a distinct measure of information content, as each task corresponded to a specific number of perturbed tanks and corresponding probability distribution of number of perturbed valves (or sliders). For each task, a human subject had several possible choices for deciding on how many
relevant valves had been perturbed and modifying them in order to restore system
stability. The likelihood of identifying the correct set of perturbed valves depended upon the probability distribution of the number of valves needed to be modified to complete a
successful task. How to formulate such a probability distribution is described next. It has previously been described how a set of perturbed valves corresponds to a set of perturbed tanks. The change of a single valve can perturb exactly two tanks that are connected by the means of that valve. For the case of two valves or more, a careful
analysis had to be performed in order to identify the numbers of perturbed valves and corresponding perturbed tanks. Figure 2-2 helps establishing an algorithm for this quantification. The schematic or logical view of the system can be thought as a binary tree structure with exception at the last layer. After the system structure was established, the effects of perturbed valves on nodes could be investigated using the following method. A node attached to a perturbed valve would be classified as having been
'visited', meaning that it was also perturbed. The locations of the perturbed valves could be modified, and all visited nodes could be tracked or counted. Using such a method, it is possible to count all possible cases or events involving a certain number of valves
affecting a specific number of nodes or tanks.
For example, take the case of two perturbed valves, summarized as follows:
N If the valves were those closely attached to a common tank on the bottom layer on the
cascade, their changes would perturb only two tanks. As can be seen in Figure 2-2, these valves are the pair of valves that have the following indexes: 20 and 21, 22 and 23, 24 and 25, 26 and 27, 28 and 29.
N If the valves were those attached to a common tank on any other layer on the cascade,
their changes would perturb three tanks. Any pair of valves that have the indexes between 0 and 19, and were connected to the same tank, were classified into this group (see Figure 2-2).
0 However, these two valves might also be attached to different tanks on any layer
valves that have the indexes between 0 and 19, and were not connected the same tank, were classified into this group (see Figure 2-2).
Hence, two valve changes could perturb two tanks, three tanks and four tanks
depending on which valves were changed. A corresponding analysis could be performed
for higher number of valve changes.
The investigation continued with an effort to find the number of occurrences for each case of N, number of valves perturbing N, number of tanks. For example, for the
value ofN, equal to two, let us investigate the algorithm used to find all the occurrences
for each case of two tanks perturbing two tanks, two tanks perturbing three tanks, and two tanks perturbing four tanks. If i is the valve index, based on Figure 2-2, then i ranges from zero to 29, since there are 30 valves within the system. Then, the algorithm can be summarized as follows:
* Look for all pairs of valve combination, for example: 0,1 pair of valves perturbing 3 tanks
0,2 3 0,3 3 0,4 4 0,5 4 1,21 3 20,21 2
* Now, notice that there are three possibilities of how many tanks that two valves can perturb. For each possibility or group, find the total number of occurrences for all pairs of valve combinations within the system.
A similar algorithm can be applied to the case of three perturbed valves or more. For the case of three perturbations, one should look for all triplets of valve combination instead of all pairs of valve combination. The same thing applies to four perturbations, five and so on. All these occurrences are summarized in Table 2-6. In addition, the
corresponding curves for fixed values of N, are shown as well in Figure 2-3A and 2-3B.
The table shows that for each task with N, number of tanks perturbed, a
probability distribution of Nnumber of perturbed valves could be generated. This probability distribution was shown in Table 2-7 and Figure 2-4.
0 0 0) 0 U "0 a) "0 ,.6 0 a4) Ua) o0 )4 a) (CD O a) H a) Hf oo00000o 00000 +++++ 00000 00000 ooooo 00000 WWWW 00000 00000 000ooo0 00000 00000 00001o 0000 J 00000 +++++ WWWWW o0000o 0000 0000o 00000 +++++ 88oow 00 0 f 000oo 00000
+++
0
CV++ WWWW 00000 00000 00000 +++++ wWWWW 000o0 w o w w 0000 ++++ OOCDO)q q q q a o00oo
++ w w 00 onLf 0 +4 + S0 D0CV n P1 "0 a), 0000000000 000 000o o o0 ++++++++++ WW L WWWww N IcT CLO ID 0 0 LO CD 000000 aoo wwwwwwwwww++++++++++C-4
V
V-:
V-
o
n
C6
C6 T-
cu V
00em0Cm000 ++++++++++ wwwwwwwwww 0 l) CE) D00 0 00 00000000 CD00000000WWWWWWWWW-co mN
D
Coooooo
o0o000000o - OI,-oo00000OV-
MCD0
0a D
0000 0000 wwww 0000 0000 0000 o0000 0000 0000 0000 0000 wUwww 0000 0000 0000 0000 0000 0000 0000 0000 0000 0000 01000 0000 0000 00000000 000000Cb-CQ)CD(f) ?c090 oco00 +++++++++ 80000~Vr) 0000000000 +++++++++ wwwwwwwwww 80000C04L CI)I~ 000 C)(V ~ O )C It 0800hC~lO bcO 000000000 wwwwwwwwww 0000000006 wwwwwwwwww 0000000000 wwwwwwwwww 000C'0C0 r'0-U 00'-+ e++ -' Lcej+ wwwL wwwwL1www 6 6cO()Or O (~U C•
-C5
0 0 0 C) 1-4 Co0 O0 oo w u 00 00c 0 0 S+ 0000 00 00 00 w w 00 00w 0 0 0 00008888 0000 0000 8880000 0000 008800 0000 WWWW 0000 0000 0000 0000 ++++ 0000 0000 0000++++ WWWW 0000 0000 WwWW 00000000 0 C~f) co r WWWWW 0L40O):- 000000000,-0000000000 wwwwwwwwww 0000000000 0000000000 000000000CI 0000000000 wwwwwwwwww 000000000 0 0000000000 0000000000 ++++++++++ o0ooooo00o 0000000000 0000000000 0000000000 wwwwwwwwww++++++++++ 00000000O O• 000080008)-0000000000 wwwwwwwwww++++++++++ 0000000000 00000000m0
6 6 6 6 6 6 6 6( cli
V-a) 0 aC4 d) 0 0 0 a) F--0 0 00 oo oo ood o00 oo ++ 00 oo 00 oo 00 oo OOd 00 + + I ww 00 00 66 c -- wa) cis a) 0 Co ua) cu "0a) e0 a) 0C,, a) (U 0 0 a) o o 2 0 a-E 2 L"3 z o I0 0 W w W W w sose) Jo JoeqWnN cm c)V-r) r a) 9~~ CL