HAL Id: hal-01191462
https://hal.inria.fr/hal-01191462
Submitted on 1 Sep 2015
HAL is a multi-disciplinary open access
archive for the deposit and dissemination of
sci-entific research documents, whether they are
pub-lished or not. The documents may come from
teaching and research institutions in France or
L’archive ouverte pluridisciplinaire HAL, est
destinée au dépôt et à la diffusion de documents
scientifiques de niveau recherche, publiés ou non,
émanant des établissements d’enseignement et de
recherche français ou étrangers, des laboratoires
from Ligand Specific Features to Binding Affinity
Predictions
Simon Marillet, Marie-Paule Lefranc, Pierre Boudinot, Frédéric Cazals
To cite this version:
Simon Marillet, Marie-Paule Lefranc, Pierre Boudinot, Frédéric Cazals. Dissecting Interfaces of
Anti-body -Antigen Complexes: from Ligand Specific Features to Binding Affinity Predictions. [Research
Report] RR-8770, Inria Sophia Antipolis. 2015, pp.61. �hal-01191462�
0249-6399 ISRN INRIA/RR--8770--FR+ENG
RESEARCH
REPORT
N° 8770
September 2015Antibody - Antigen
Complexes:
from Ligand Specific
Features to Binding
Affinity Predictions
Simon Marillet and Marie-Paule Lefranc and Pierre Boudinot and
Frédéric Cazals
RESEARCH CENTRE
SOPHIA ANTIPOLIS – MÉDITERRANÉE
from Ligand Specific Features to Binding
Affinity Predictions
Simon Marillet
∗and Marie-Paule Lefranc
†and Pierre
Boudinot
‡and Frédéric Cazals
§Project-Team Algorithms-Biology-Structure Research Report n° 8770 — September 2015 — 58 pages
Abstract: Adaptive immunity is based on antigen-specific lymphocyte responses, with in particular B cells secreting seric immunoglobulins (IG) involved in the opsonization of bacteria and the neutralization of viruses. At the heart of these mechanisms is the formation of IG -Ag complexes, which challenge our understanding in terms of binding affinity and interaction specificity.
In this work, we dissect the interfaces of IG - Ag complexes with high resolution crystal structures, making a stride towards a better understanding of binding affinity and interaction specificity. First, we present global interface statistics clearly distinguishing ligand types (proteins, peptides, chem-ical compounds), and stressing the role of side chains. Second, we analyze the relative positions of CDR with and without antigen, exhibiting a remarkably conserved pattern involving seven seams between CDR. We also show that this generic pattern exhibits specific properties as a function of the ligand type. Finally, we present binding affinity predictions of unprecedented accuracy, with a median absolute error of 1.02 kcal/mol.
We anticipate that our findings will be of broad interest, not only in studying immune responses at the structural level, but also in bio-engineering and IG design, with IG used extensively in diagnostics and as well as therapeutic agents.
Key-words: Antibody - antigen complex; interface ; affinity; relative CDR locations
∗Inria and INRA (Unité de Virologie et Immunologie Moléculaires), France
†IMGT, IGH, CNRS, France
‡INRA, Unité de Virologie et Immunologie Moléculaires, Jouy-en-Josas, France
prédiction d’affinité de liaison
Résumé : L’immunité adaptative est basée sur une réponse lymphocytaire spécifique de l’antigène, les lymphocytes B sécrétant en particulier des immunoglobulines (IG) sériques im-pliquées dans l’opsonisation des bactéries et la neutralisation des virus. Au cœur de ces mé-canismes se situe la formation de complexes IG - Ag, défiant notre compréhension quant à la prédiction de l’affinité de liaison et de la spécificité des interactions.
Dans ce travail, nous disséquons les interfaces de complexes IG - Ag à partir de structures cristallographiques à haute résolution, faisant ainsi un pas en direction d’une meilleure com-préhension de l’affinité de liaison et de la spécificité des interactions. Premièrement, nous présen-tons des statistiques sur les interfaces dans leur globalité permettant de distinguer clairement les types de ligands et de souligner l’importance des chaines latérales. Deuxièmement, nous analysons les positions relatives des CDR en contact ou non avec un antigène, exhibant ainsi un motif remarquablement conservé impliquant sept coutures entre les six CDR. Nous montrons également que ce motif générique possède des propriétés spécifiques au type de ligand. En-fin, nous présentons des prédictions d’affinité d’une précision inégalée, avec une erreur absolue médiane de 1.02 kcal/mol.
Ces résultats sont d’intérêt général, non seulement pour l’étude des réponses immunitaires au niveau structural, mais également pour l’ingénierie biologique et le design d’IG, celles-ci étant largement utilisées pour les diagnostics et en tant qu’agents thérapeutiques.
1
Introduction
1.1
Immunoglobulins and the immune response
Adaptive immunity is based on antigen (Ag)-specific lymphocyte responses. Upon specific recog-nition of an antigenic epitope by a given receptor unique to a lymphocyte, this cell gets activated and proliferates, leading to a clonal expansion. B lymphocytes thus recognizes the native antigen through immunoglobulins (IG) or antibodies on their membranes. Following differentiation of lymphocytes into plasmocytes, IG are then secreted and bind the antigen as a soluble receptor. Seric IG can opsonize bacteria and facilitate their uptake by phagocytes, or neutralize viruses thus preventing recognition by their receptor or fusion with the target cell. During the secondary immune response, affinity maturation is responsible for the secretion of IG of higher affinity, a gain of up to three orders of magnitude being common.
Immunoglobulins fundamentally consist of two identical heavy (H) chains and two identical light (L) chains, each H chain being bound to an L chain by a disulfide bond and by noncovalent interactions between the variable domains VH and VL and the constant domains CH1 and CL. The antigen-binding site is located at the top of the paired VH and VL, and generally overlaps the two V domains. It mainly consists of three flexible loops on each V domain, called complementarity determining regions (CDR1-3) [72, 9].
Matching the universe of antigenic motifs specifically requires a very large diversity of recog-nition modes by immunoglobulins. This is achieved by a huge diversity of the loops constituting the antigen binding sites at the top of the VH and VL domains. The aforementioned CDR1 and 2 are encoded by the V gene and their diversity depends on genes and alleles, whereas the CDR3 loop corresponds to the site of the V(D)J rearrangements, which generate the highest sequence diversity [68], [55, Chapter 6].
1.2
IG - Ag complexes under the structural lens
From the structural standpoint, the functional relevance of an IG is described by its binding affinity for the targeted antigen and the specificity of such interactions. The specificity is critical to ensure that the response targets the antigen, and not, for example, a motif present on a self protein - and it is also the basis of immune memory and vaccination. The affinity sets the strength of the interaction and the time the antigen and the antibody are linked to each other. For the membrane bound IG, it determines if enough aggregation of surface IG and IG co-receptors occurs, so that a sufficient signal can be sent to the cell to induce activation and proliferation; for secreted IG, it sets the efficiency of IG-mediated pathogen opsonisation and/or neutralization, or IG effector properties (antibody-dependent cell-cytotoxicity (ADCC), complement-dependent cytotoxicity (CDC)), after binding to the target infected or tumoral cells [42]. In mouse and human, secondary immune responses are often accompanied by affinity maturation, a process during which B cells expressing IG with enhanced affinity are being selected. Such IG with higher affinity result from the selection of random mutations of their V(D)J genes produced by the enzyme activation-induced cytidine deaminase (AICDA, AID), which may modify the structure of the antigen binding site, hence the affinity of the interaction with the Ag.
The binding affinity is a thermodynamic parameter describing an equilibrium between three species, namely the partners and the complex they form. It is generally measured by a dis-sociation constant Kd of this equilibrium, or equivalently by the associated dissociation free energy. Thus, by nature, the affinity has enthalpic and entropic components. The enthalpic component describes the interaction energy. Generically, given two partners forming a complex, various parameters have been proposed to model the complex. Most of these parameters tar-get the interface, and describe its size and morphology, shape (number of patches), biochemical
properties (salt bridges, solvation, H bonds), or packing properties and have been studied using crystal structures of complexes, see [33, 46, 8, 48] and the references therein. More recently, it has also been shown that non-interacting atoms play an important role, intuitively related to solvent interactions [35]. For the particular case of IG - Ag complexes, it has been observed that interfaces tend to have a smaller size, have curvature dependent on the ligand size [47]. The entropic component accounts for the dynamics of the partners. In particular, it has been shown that preconfiguration/prerigidification of the binding site may yield a decreased entropic loss, hence a enhanced binding affinity [49, 59, 15, 60]. The specific role played in Ag binding by CDR also prompted the analysis of CDR specific statistics. Using a handful of structures, canonical structuresi.e. commonly occurring backbone CDR conformations were first reported [17] and subsequently updated [18, 2]. Moving from individual CDR to all CDR, correlations between canonical structures were further studied [70], highlighting the fact that selected com-binations are multi-specific, while others are specific of an antigen type. The VH CDR3 is the most variable and was therefore the focus of several studies [62, 53, 64] which defined and up-dated sequence-based rules to predict its conformations. More recently, these studies have been refined, based on a larger number of structures (of the order of hundreds instead of tens). For VL CDR3, new canonical structures were proposed [38], and for VH CDR3, previous rules were updated and complemented [36, 37]. The work of Chothia et al [17] was also refined using 300 nonredundant IG structures and a pre-processing based on CDR length [54]. Distinguishing lambda versus kappa chains, it has been shown that canonical conformations from the former are more diverse than those from the latter in the human and the mouse [13]. However, the use of canonical conformations was questioned [16], since general prediction methods for loops matched (or even outperformed) the prediction performances of methods exploiting specific rules associated with canonical structures of CDR. Finally, two related works [3, 58] studied the dif-ferential CDR lengths and SDRU (proportion of structures contacting the antigen at a given site) between ligand types. However, these analysis do not extend to predictions of the antigen type. More generally, the reader may consult [27] for a review of structural and genetic aspects of natural and artificial antibody repertoires.
While the previous analyses certainly shed light on antigen recognition modes, they fall short from providing complete information on binding affinity. Predicting binding affinities from structural data is a notoriously challenging problem, for protein complexes in general [34, 50], and for IG - Ag complexes in particular [45]. This actually owes to the intrinsic nature of Kd, namely a macroscopic property describing the chemical equilibrium associated with the two partners (IG and Ag) and the complex (IG - Ag, denoted IG/Ag in the IMGT nomenclature [25]). That is, the magnitude of Kd has an enthalpic component, qualifying the strength of the interaction, but also an entropic component qualifying the loss of dynamical properties upon complex formation – intuitively the formation of the IG - Ag complex restricts the degrees of freedom of both partners. These two competing interests illustrate the enthalpy - entropy compensation phenomenon [52, 24], which stipulates that a favorable enthalpic change upon association is accompanied by an entropic penalty. In [56] and [69] the authors have shown that a preconfiguration process of the variable domains can be induced by the constant domain 1 (CH1) of the heavy chain, suggesting that the isotype switching commonly occurring during B cell differentiation may affect the affinity through changes in the dynamic properties of the IG. Parallel to binding affinity, the notion of functional affinity or avidity which takes into account the (possibly negative) cooperativity between IG is highly relevant in-vivo. In that context, constant regions have been shown to influence the avidity [22, 23, 51, 57]. Likewise, am intact ball-and-socket joint between VH and CH1 domains has been shown to condition antibody neutralizing activity [39].
Contributions. This work sheds new light on IG - Ag interactions. We use the annotated IMGT/3Dstructure-DB [25], focusing on canonical complexes, each such complex involving ex-actly one variable domain from the heavy chain (VH), one variable domain from the light chain (VL) and one antigen (Ag). Of particular interest is the ligand type (reduced to protein, pep-tide and chemical in this paper, see Section 2.3). Upon extracting canonical complexes from the IMGT/3Dstructure-DB, our analysis relies on hierarchical Voronoi interface models, and involves three main steps. IG atoms are first marked as belonging to CDR or framework regions (FR), using the IMGT unique numbering [43]. (Practically, we use the following notations: CDR1-IMGT of VH is written VH CDR1 and FR3-CDR1-IMGT of VL is written VL FR3. Other CDR and FR follow the same scheme.) Subsequently, the interface between the IG chains and the Ag is determined using a Voronoi based model, and hierarchically decomposed into contributions from CDR, FR and other atoms.
Using these tools, we present novel analysis for IG - Ag complexes, in three directions. First, we report global interface statistics, in particular as a function of the ligand type, stressing the role of side chains and going beyond previous work solely based on backbone canonical conformations. In particular, these statistics discriminate between different ligand types, a key observation to understand binding specificity. Second, we present novel analysis of the relative contributions of CDR to binding, highlighting the relative positions of CDR. We notably mitigate the classical view of prominent contribution of CDR3 to the interface, showing that in terms of buried surface area, CDR3 on the one hand, and CDR1 + CDR2 on the other hand, must be considered on an equal footing. We also show that there exist a conserved pattern of contacts between CDR, with specific properties depending on the antigen type. Finally, we present binding affinity predictions of unprecedented accuracy.
2
Material and Methods
2.1
Voronoi Interface Models
Given a macro-molecular complex, an interface model is a structural model of the atoms account-ing for the interactions. Various interface models have been developed, based in particular on distance thresholds and loss of solvent accessibility [4]. In the sequel, we use the Voronoi based interface model, which is a parameter free construction improving on previous models in several aspects. Since we shall be using features of this model, we present it briefly. (See also Fig. 1 for an illustration on an IG - Ag complex.)
Solvent accessible models. The solvent accessible model (SAM) of a set of atoms is a model where each atom is represented by a ball whose radius is the van der Waals radius expanded by the radius rw = 1.4Å of a water probe accounting for a continuous solvation layer [28, 4]. A convenient construction to study SAM is the Voronoi (power) diagram defined by the atoms [28]. In particular, the Voronoi diagram induces a partition of the molecular volume, obtained by computing for each atom its Voronoi restriction, namely the intersection between its atomic ball and its Voronoi region. The volume of a restriction can be used to define packing properties: the raw packing propertyof one atom is plainly the volume of its restriction; the normalized packing propertyis the volume of the restriction normalized by the volume of the corresponding ball.
Buried surface area. The exposed surface of a SAM consists of the boundary of the union of balls defining the SAM. (Prosaically, the visible surface of the molecule.) This surface consists of spherical polygons, delimited by circle arcs (every such arc is located on the intersection circle of
two atoms), themselves delimited by points (each such point is found at the intersection of three spheres). When two molecules assemble to form a complex, the buried surface area (BSA) is the portion of the exposed surface of the partners which gets buried [46]. BSA has been shown to exhibit remarkable correlations with various biophysical quantities [32], and notably dissociation free energies for complexes involving moderate flexibility [48].
Voronoi interface. Consider the SAM of a complex whose partners are denoted A and B, and also involving water molecules tagged W. Two atoms are in contact provided that their Voronoi restrictions are neighbors. Pairs of type (A,B) define the AB interface, namely direct contacts between the partners. Focusing on W molecules sandwiched between the partners, pairs (A,W) and (B,W) correspond to water mediated interactions. It can be shown that all atoms from the partners identified this way form a superset of atoms loosing solvent accessibility [12]. The binding patch of a partner consists of its interface atoms. The atoms of the binding patch can be assigned an integer called its shelling order, which is a measure of the distance of this atom to the boundary of the patch it belongs to [8]. This information generalizes the core-rim model [46], and has been shown to provide STAR correlations with solvent dynamics, conservation of amino acids [8], and dissociation free energies [48].
The Voronoi facets associated to pairs of type (A, B) define the bicolor interface A − B (bicolor since there are two partners); those associated to pairs of type (A, W ) and (B, W ) define the mediated interface AW − BW , since interactions between A and B are mediated by W molecules; finally, the union of the bicolor and mediated interface define the tricolor interface ABW. Geometrically, this interface is a polyhedron separating the partners. The curvature of this polyhedron is easily computed [11], and has been shown to provide information on binding modes [12].
Application to IG - Ag complexes. We partition the set I of interface atoms into the atoms IIGcontributed by the IG, and the atoms IAg contributed by the Ag, so that I = IIG∪ IAg. It follows that the number of interface atoms |I| satisfies |I| = |IIG| + |IAg|. Similarly, we charge the Buried Surface Area BSA to the IG and Ag respectively, so that BSA = BSAIG+BSAAg. These quantities yield the average BSA per atom on IG and Ag side:
bsaIG= BSAIG |IIG| (1) bsaAg= BSA Ag |IAg| (2)
Note that the previous average surface areas are computed using interface atoms only–not the number of atoms or exposed atoms of the whole individual molecules.
2.2
Hierarchical Voronoi Interface Models
Consider a complex where partner A is an IG, and partner B an antigen. We wish to accom-modate the hierarchical structure of a Fab [42]. We focus on the variable domains of the heavy and light chains, denoted VH and VL respectively, and decompose each of them into seven regions, namely three Complementarity Determining Regions (CDR), and the four Framework Regions (FR) flanking them [43] (Supp. Table 1). For example, the domain VH is decomposed as FR1+CDR1+FR2+CDR2+FR3+CDR3+FR4.
Consider the partition of he variable domains VH and VL induced by the previous 14 labels. For the sake of conciseness and since we focus on interfaces involving the variable domains only,
the domains VH and VL are plainly denoted H and L. Using these notations, we partition the IGAginterface as follows:
• Hierarchical bicolor interface: IGAg = (L ∪ H)Ag = V LAg ∪ V HAg
• Hierarchical mediated interface: IGW − AgW = (LW − AgW ) ∪ (HW − AgW ) • Hierarchical tricolor interface: IGAgW = IGAg ∪ (IGW − AgW )
Analogously, the partition of the H (or L) V-domain into seven CDR and FR regions induces a partition of the HAg (or LAg) interface (Fig. 2).
2.3
The Dataset and Data Curation: the IMGT/3Dstructure-DB
Structure From a structural standpoint, we use the IG - Ag complexes from the IMGT/3Dstructure-DB (http://www.imgt.org/3Dstructure-IMGT/3Dstructure-DB/ [25]), corresponding to the category IG/Ag for IMGT complex type. Only PDB files are kept. This dataset featured 1363 complexes as of Jan-uary 2015. Of these complexes, 30 had been removed from the database by May 2015. We also discarded four files: two which contain only an IG and buffer molecules with no ligand (1MJU and 4KQ3), and two which contain an IG in complex with a molecule specifically crafted to bind the middle part of the IG (4GW1 and 4IOI). Each such complex is processed in order to identify canonical complexes (Supp. Section 7.1),
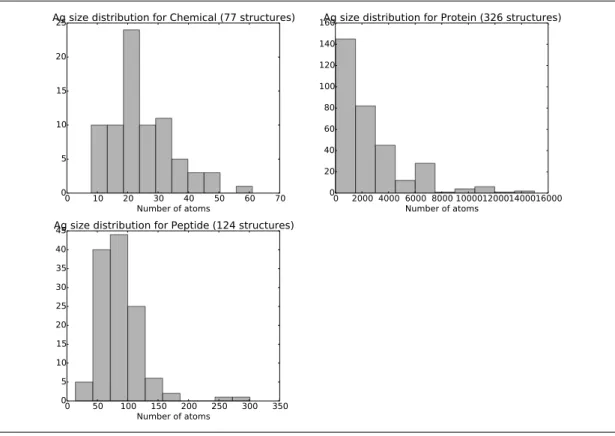
Upon inspecting these cases, two decisions are made. First, on the antigen side, we retain three types only (peptide, protein, chemical), due to the scarcity of cases involving other types (See also Supp. Fig. 11 for the distribution of ligands’ sizes.) Moreover, we also remove complexes involving multiple ligands types. For the same reason, regarding species, complexes are assigned to three classes human, mouse and other. A total of 529 complexes are retained after filtering for missing data, inconsistencies and redundancy (Supp. Table 2). CDR and FR limits of the VH and VL domains [41] are according to the IMGT unique numbering [43] (Supp. Table 1).
3
Results
3.1
Global interface analysis
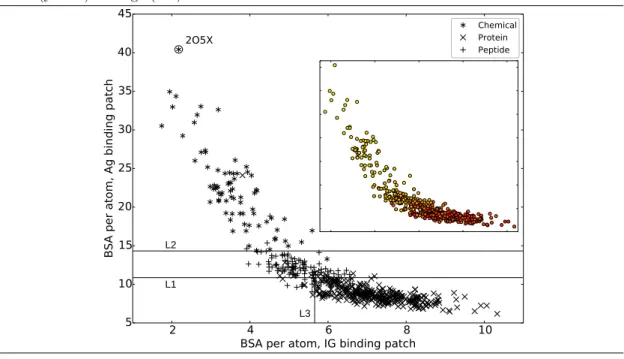
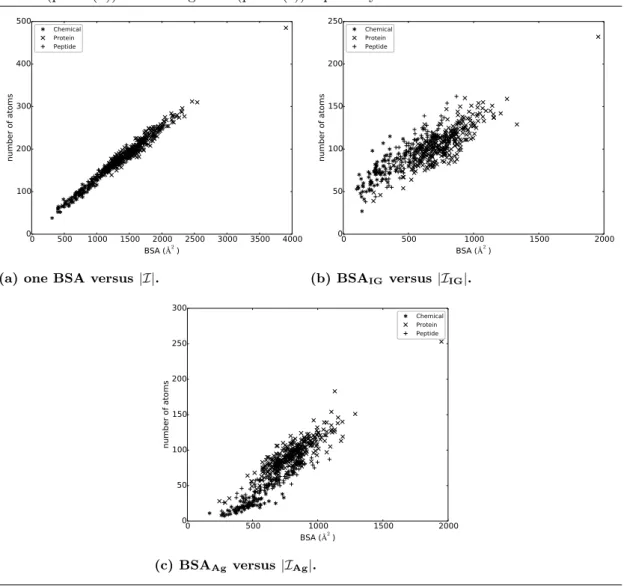
Signatures of binding patches exhibit a broken symmetry between the IG and Ag side. The simplest and most informative variable describing protein interfaces is the buried surface area (BSA) [32], a statistic known to strongly correlate with the number of interface atoms |I| (on our dataset: Pearson coefficient of 0.99, p-value < 2.225−308; see Supp. Fig. 13a). When considering the average BSA per atom for the IG and the Ag (Eqs. 1 and 2 respectively), weaker correlations are observed, since the Pearson coefficient drop to 0.83 for |IIG|and BSAIG (p-value = 5.176e−136, Supp Fig. 13b), and to 0.90 for |I
Ag|and BSAAg (p-value = 2.161e−189, Supp Fig. 13c). This is due to the shape complementarity between the interfaces on the IG and Ag size, causing the sum of the BSAs and the number of atoms on each side to balance out. Prosaically, for small ligands, the binding patch of the IG wraps around that of the Ag. This fact is also supported by the negative correlation between bsaIG and bsaAg (Fig. 3), with Pearson’s coefficient of -0.84 (p-value = 1.032e−143), and Spearman coefficient of -0.90 (p-value = 2.257e−188).
Strikingly, the ligand type has a strong influence on these quantities: complexes involving a chemical ligand have a higher bsaAg than those involving a peptide ligand which in turn have a higher bsaAg than those involving a protein ligand. Since chemical ligands are typically small
and protein ligands are usually large (Supp. Fig. 11), we checked the correlation between ligand size, bsaAg and bsaIG. Colors in the inset of Fig. 3 display the Ag size (number of atoms) instead of its type: although the gradient suggests an influence of the ligand size, there is a mix between large and medium-sized ligands in the right part of the plot. The circled outlier in Fig. 3 corresponds to entry 2O5X. It is a chimeric IG (gamma1-kappa Fab) in complex with a molecule of TRIS buffer. Since buffer molecules are usually not bound by IG, this is likely the result of a mis-labeling of such a molecule as ligand. Therefore unusual values of bsaAg and bsaIGcan help detecting issues in the dataset by checking blatant outliers.
Summarizing, the average BSA per atom is not symmetrical with respect to the IG and Ag side of the interface because of the shape complementarity of the two binding patches. This lack of symmetry depends itself on the type of ligand.
Signatures of binding patches also identify ligand types. The remarkable correlation between the average BSA per atom on the IG and Ag sides provides a strong indication of the ability of the two parameters bsaAg and bsaIG to characterize interfaces as a function of the ligand type (Fig. 3). To further check this hypothesis, we build a decision tree to hierarchically partition the two-dimensional space defined by bsaAg and bsaIG (Fig. 3, with the boundaries of the partition displayed as black lines, and Supp. Fig. 14). (Practically, we used the R package rpart with 10-fold cross validation, choosing the number of splits which minimize the cross validation error, and further pruning the tree.) With a classification error of 0.077 (Supp. Table 7), the regions defined by ligand types in the 2D parameter space indeed unambiguously determine the ligand type (Fig. 3).
In short, the average BSA per atom bsaIG and bsaAg provide a proxy for the curvature of binding patches on the IG and Ag sides, clearly discriminating between ligand types.
Side chain atoms: proportion at interface. A classical focus while analyzing IG - Ag interface has been the study of backbone conformations [18, 13]. To assess the role of side chains, we study the proportion of interface atoms belonging to a side chain (Supp. Fig. 15). Despite some variability, the median is always between 0.68 and 0.72 across categories. Additionally, there is no significant difference between species, ligand types or lambda/kappa IG.
The contacts made by atoms belonging to the backbone are therefore far from being negligible but are still outnumbered by side-chain atoms.
3.2
On the respective contacts of CDR with the antigen
We now leverage interface statistics, exploiting the decomposition of the binding patches induced by the CDR and FR regions (Fig. 2). Since CDR are essentially the only regions contacting the antigen (Supp. Table 6), we focus on these six regions in the sequel.
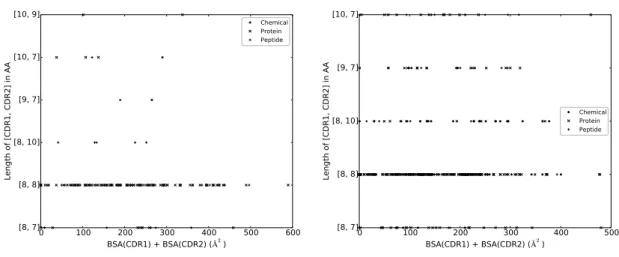
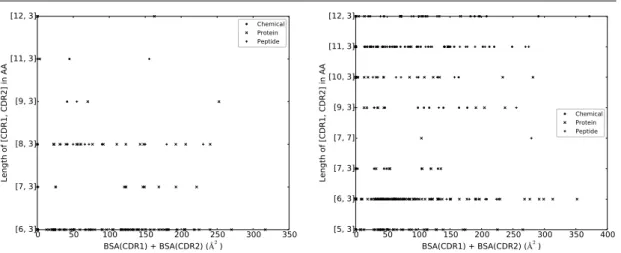
On the lengths of CDR. As IG diversity of complete repertoires or in responses to specific pathogens has been largely been studied by CDR3 length spectratyping [1, 10, 65], we analyze the relationship between CDR length and recognition mode, and extend our survey to CDR1 and CDR2. From the analysis of the length of the various CDR in our dataset (Supp. Section 6.2, Supp. Fig. 16), four important points stand out.
First, for VL, a reduced set of CDR length combinations accounts for more than a third of the dataset. Namely, a single combination of VL CDR1, VL CDR2 and VL CDR3 [6.3.9] accounts for 35% of the human IG, and five combinations account for 65%. Moreover, two combinations account for 54% of the murine IG. Such a coupling with CDR3 length does not occur in VH which is likely related to the differences in the rearrangement process between VL and VH. Namely,
VL CDR3 results from the recombination of only two genes, VL and JL, which reduces both combinatorial and junctional diversity. Additionally, the DNA nucleotidylexotransferase (DNTT) activity responsible of the nucleotide trimming and addition at the junction, is notoriously very low when VL V-J rearrangements occur. Altogether, this leads to shorter junctions in VL compared to VH. Second, our results confirm that VH CDR3 is the main region of diversity in terms of CDR length which underlines the power of the CDR3 length spectratyping approaches for repertoire characterization. Indeed, for the human dataset, apart from a peak at 12 amino-acids (AA) (15% of the dataset), the lengths of 94% of VH CDR3 are evenly distributed between 10 and 22 AA. The situation is similar for murine IG with a peak at 12 AA (19% of the dataset) as well, and 71% of VH CDR3 spread between 11 and 15 AA. On the other hand, both VH CDR1 and VH CDR2 are made of 8 AA for 81% of the human dataset, and for 66% of the murine dataset. Third, VL CDR2 is always of length 3 in the human, and has length 7 in only two murine IG. It is the least variable of all CDR and the shortest one on average. Finally, VL CDR1 length is more variable than that of VL CDR3 in the mouse. Indeed, VL CDR1 has 6 and 11 AA in 38% and 22% of the murine dataset, respectively, whereas 86% of murine IG have a VL CDR3 of length 9, which is due to the well known lack of DNTT activity at the time of VL V-J rearrangements.
BSA: contribution of VH versus VL. In an IG - Ag complex, it is generally believed that VH contributes more to the recognition than VL. With a BSA of VH strictly larger than that of VL for 457/529 complexes (86%) (Fig. 4), our analysis supports this claim. Among those 72 complexes for which the BSA of VL is larger than that of VH, the proportions of chemical, peptide and protein ligands are 22%, 32%, 46%, respectively–to be compared to those of the whole dataset: 15%, 24%, 62%, respectively. This is hardly conclusive, considering the small number of such complexes. The analysis of outliers bears some interest (circled cases, Fig. 4). The case 4OGY consists of a human IG (gamma1-kappa Fab) in complex with a protein (plasma kallikrein). The ligand, is strongly shifted toward VH. Moreover, VH CDR1 and VH CDR3 protrude from the Fab and extensively contacts the ligand. As for 3NGB, it results from a spurious assignment of Ag chains to the IG. Because four identical biological units are in the file and the IMGT annotation puts all four ligand chains as a single ligand, a part of the interface with VH actually comes from crystal contacts. This example shows that annotations issues can be detected by checking blatant outliers.
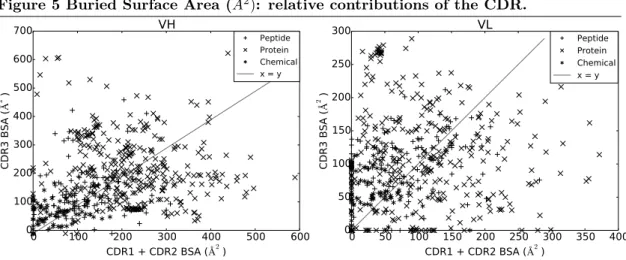
BSA: contributions of the CDR within a V-domain. To refine the previous analysis, we use our hierarchical interface models and dissect the BSA into contributions by the CDR within a V-domain. This analysis shows a great deal of variation independent from the species or the ligand type (Figs. 5). A common observation is that the sum of contributions of CDR1 and CDR2 essentially matches that of CDR3 for both VH and VL. Namely, for 244/529 complexes (46%) BSA(VH CDR1) + BSA(VH CDR2) > BSA(VH CDR3). This is less obvious for VL since BSA(VL CDR1) + BSA(VL CDR2) > BSA(VL CDR3) for 218/529 complexes (41%). A Wilcoxon signed-rank test does not find a significant difference between the BSA of VH CDR1 + VH CDR2 and VH CDR3 (two-sided p-value = 0.1821), but does for VL CDR1 + VL CDR2 and VL CDR3 (two-sided p-value = 0.0004,) which confirms the previous results.
In the sequel, we call free CDR a CDR which does not loose any solvent accessibility–none of its atoms is buried by an atom of the antigen. Complexes with free VH CDR1 or VH CDR2 are not uncommon since they occur for 48/529 (9%) and 53/529 (10%)) complexes, respectively (Fig. 5a). This is much rarer for VH CDR3 (7/529 occurrences, 1%).
On the other hand, 255/529 (48%) complexes involve a free VL CDR2 (Fig. 5b), a fact to be interpreted in the context of a lesser length variability and, as we shall see, a location on the
side. 74/529 (14%) complexes have an free VL CDR1 and 39/529 (7%) complexes have an free VL CDR3 which is almost seven times as much as VH CDR3.
In short, CDR1 and CDR2 contribute essentially as much as CDR3 in terms of BSA. Addi-tionally, VH CDR3 is almost always at interface, whereas it is only the case for VL CDR2 in half of the dataset. Finally, VL CDR tend to be away from interface more often than VH CDR. CDR: lengths versus BSA. It has been observed that CDR length differ between different antigen types [21, 58], a finding suggesting that CDR length influences the binding site shape to accommodate the ligand. Since all the atoms of a CDR may not contribute to the interface, we investigated the correlation between the length of a CDR and its contribution to the BSA (Figs. 6 and 7). Because of their shared genomic origin, we group CDR1 and CDR2 and subsequently investigate the relationship between (CDR1, CDR2) pairs and BSA on the one hand, and CDR3 and BSA on the other hand.
As illustrated by the scatter plots, a CDR of a given length can display widely varying levels of BSA. These results confirm that CDR lengths must be complemented to fully describe the involvement of a CDR in the interaction with he Ag. This is backed up up by the very limited ability of neural networks trained on sequence data only to predict the ligand type bound by an IG in [21].
3.3
On the relative positions of CDR
The relative position of CDR is instrumental to understand binding modes, and has already been described qualitatively (e.g., [21, Fig. 1]). To make such description quantitative (Figs. 8 and 9), we study the seams i.e. the contact curves between the six CDR. Since six CDR yield a total of 15 pairs, our goal is to understand which pairs are in close vicinity. To this end, we consider seams associated with all types of ligands, which, abusing terminology, we call consensus seams, as well as seams observed for specific types of ligand.
More formally, recall that the boundary of a surface accessible model (SAM, see Section 2.1) consists of spherical polygons, circle arcs, and points. For a given CDR, two sets of atoms are of particular interest, namely the atoms making up the boundary of the SAM and the subset of these atoms which are found at the interface with the ligand. We note in passing that median values of the ratios between these two sets are 19%, 23%, 25%, for VH CDR1, VH CDR2, VH CDR3, respectively, and 18%, 10% and 24% for VL CDR1, VL CDR2 and VL CDR3, respectively.
Consider two CDR, and one set of atoms per CDR (either exposed atoms, or interfacial ex-posed atoms). The seam between these two sets of atoms is the contiguous set of circle arcs separating these two sets of atoms, if any. Its length is defined as the cumulative length of its constitutive circle arcs (Fig. 8). Practically, the seams associated with exposed and interfa-cial exposed atoms yield complementary pieces of information: the former describe the relative positions of CDR; the latter provide information on the ligand position across these seams.
We computed the length of seams observed between all pairs of CDR on groups of complexes involving (i) the same ligand type, namely protein, peptide or chemical, and (ii) the same type of VL domain, namely V-kappa or V-lambda. Denoting x and y two seam lengths, we define the maximum normalized differenceas the following number ∈ [−100, 100]:
MND(x, y) = 100 · x − y
max(x, y). (3)
Given two CDR, we use the MND to compare the median value observed on a class of IG - Ag complexes, against the median value observed over all complexes – this latter value being referred
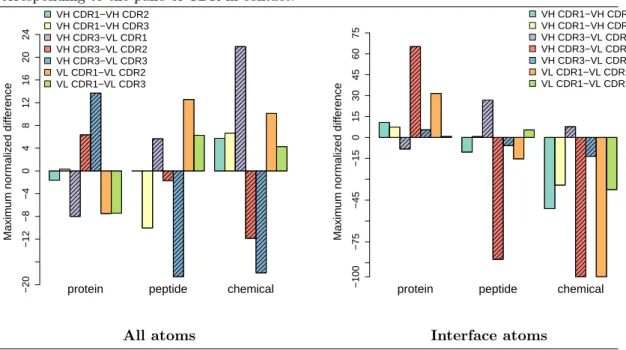
to as the consensus value or the value of the consensus seam. It is negative when the class-specific value is smaller than the consensus value, positive when it is greater and null if they are equal. Consensus seams. We observe that the existing inter-chain contacts are the same when con-sidering either all atoms or interface atoms only (Fig. 9, supp. Figs. 19 and 20). Intuitively, the Ag spreads evenly on the surface of the IG, covering all the seams.
Considering intra-chain contacts, we notice that the same are found in the VH and VL domains, namely CDR1 – CDR2 and CDR1 – CDR3. However, considering all atoms, these seams are slightly longer in VH with respectively 24.6 Å and 30.9 Å versus 16.0 Å and 26.9 Å for VL. The same applies for interface atoms with 13.3 Å and 14.9 Å for the VH versus 3.9 Å and 13.9 Å for VL, respectively. This is likely because CDR from VH are longer on average than those from VL. Interestingly, the seams length is divided by approximately two when considering only interface atoms except for seam VL CDR1 – VL CDR2 where the it is divided by four.
For inter-chain contacts and considering all atoms, the length of the seam between VH CDR3 and VL CDR3 is slightly smaller than, but comparable to, those existing intra-chain seams (14.5 Å versus a median of 25.5 Å). The contacts VH CDR3 – VL CDR1 and VH CDR3 – VL CDR2 are rather unexpected and are of length of 10.0 and 5.9 Å, respectively. For interface atoms, the length of the seam between VH CDR3 and VL CDR3 is 10.3 Å versus a median across all other nonzero intra-chain seams of 12.6 Å.
Summarizing, the pattern of seams is the same either when considering all exposed CDR atoms, or only interface atoms. Moreover, VH CDR3 is the one making most contacts with other CDR, and VH CDR3 and VL CDR3 account for most of the inter-domain contacts. Comparison between ligand types. We use the maximum normalized difference (Eq. 3) to compare the consensus seam length and those observed for specific ligand types. When considering seams for all the atoms, it is clearly seen that large values of MND have opposite signs for proteins on the one hand, and peptides and chemicals on the other hand (Fig. 10), an observation in line with the previously observed differences between ligand types. The relative locations of the CDR are therefore different between ligand types. Intuitively, these differences witness pre-formed features of CDR that will accommodate a particular ligand type. Moving to seams between interface atoms only, a similar observation is also expected. This turns out to be the case, except for the seam VH CDR3–VL CDR1, for which larger values are observed for peptides and chemicals (Fig. 10, left). In general, VL CDR1 shows differences opposite to VL CDR2 and VL CDR3 with respect to VH CDR3. This hints for a different role at the interface and potentially different dynamical properties.
Comparison between V-lambda and V-kappa domain. For all atoms, the largest length differences between V-kappa and V-lambda are found for the seams VH CDR1 – VH CDR2 (24.7 versus 20.4 Å, Supp Fig. 27), VH CDR2 – VH CDR3 (0.0 versus 3.2 Å) and VH CDR3 – VL CDR1 (9.4 versus 12.2 Å). Interestingly, two out of three are within VH and all involve VH CDR3. For interface atoms, the largest length differences between V-kappa and V-lambda are found for the seams VH CDR3 – VL CDR1 (5.6 versus 8.4 Å, Supp. Fig. 28), VL CDR1 – VL CDR3 (14.2 versus 11.0 Å).
The V-kappa/V-lambda classification only pertaining to the light chain, it is sound to find differences in the relative positions of VL CDR1 and VL CDR3. Considering the differences observed for VH CDR, one has to recall that the pairing between heavy and light chains is a criterion during the selection of productive IG. It could be that IGLV and IGKV of light chains have preferences for different sets of IGHV of heavy chains which would explain why looking
at IG with kappa light chains versus lambda light chains results in structural differences in the heavy chains.
3.4
Affinity prediction
As recalled in Introduction, estimating the affinity of an IG for an antigen is a challenging problem, due in particular to the necessity to estimate the entropic penalty inherent to binding. In [50], we developed an affinity estimation strategy yielding state-of-the-art results, selecting sparse linear regressors defined from a pool of 12 variables aiming at modeling the enthalpic and entropic changes upon binding. Of particular interest are variables coding atomic packing properties, and the position of atoms on binding patches, using their shelling order (Fig. 1 and [50]). To fit a model, we use the structure affinity benchmark (SAB) [34], a dataset containing 144 cases, each case being described by three crystal structures (the unbound partners and the complex) and the experimentally measured binding affinity. Interestingly, the SAB contains 17 IG - Ag cases1. We therefore trained the general model from [50] using the 139 − 14 cases, to predict the affinities of the selected 14 IG - Ag cases. We note in passing that the iRMSD and the total RMSD between the bound and unbound form of the IG are always smaller than 1.24 Å and 0.95Å respectively. That is, the 14 cases are essentially rigid body docking cases, a property which, however, does not warrant easiness of binding affinity prediction [50].
Upon performing the affinity prediction, our model predicts 9 (64.29 %), 13 (92.86 %) and 14 (100 %) of the Kdwithin one, two and three orders of magnitude respectively, with a median absolute error of 1.024 kcal/mol (Supp. Fig. 31). From an absolute affinity prediction error, these results are satisfactory, as predicting Kd within one order of magnitude is essentially the best one can hope for without modeling subtle effects such as the pH in particular [31]. From a relative standpoint, they are also informative, as an affinity enhancement of two orders of magnitude is typically observed during affinity maturation [60].
4
Discussion
This paper presents a comprehensive analysis of IG - Ag complexes and their interfaces, based on state-of-the-art modeling tools relying upon hierarchical Voronoi interface models and related geometric constructions. Our dissection of IG - Ag interfaces yields a number of novel insights, which may be summarized by considering the whole interface level and the CDR level.
Global interface statistics. While a classical focus in previous work has been the classifi-cation of backbone conformations, an endeavor boiling down to comparing backbone traces, we focus instead on interfacial atoms, as identified by a solvent accessible model. In doing so, one observes that side chains contribute approximately twice as many atoms than backbones. While this statistic stresses the need to consider all interface atoms rather than backbone ones only, modeling side chains accurately enough to encompass their incidence on binding thermodynamic and kinetic properties is extremely challenging, due in particular to correlations between ro-tameric states of side-chains. The length of CDR3 also raises difficulties, and as an extreme case, one may consider exceptionally long VH CDR3, such as thos found in bovine antibodies, where multiple cysteines facilitate the formation of disulfide bonds and microfolds [71, 7].
1 (PDB IDs: 1AHW, 1BJ1, 1BVK, 1DQJ, 1E6J, 1FSK, 1IQD, 1JPS, 1MLC, 1NCA, 1NSN, 1P2C, 1VFB,
1WEJ, 2JEL, 2VIR and 2VIS). However, 1IQD and 1NSN are discarded as only an upper bound on their Kdis
provided in the SAB. Furthermore, 1E6J is also discarded because too many atoms could not be matched between the bound and unbound structures.
Additionally, the simplest and most informative variable describing protein interfaces being the buried surface area (BSA), we refine this statistic by computing the average BSA contributed by interfacial atoms from the IG (statistic bsaIG) and the Ag (statistic bsaAg). These quantities turn out to be clear signatures of the ligand type, a property which can further be exploited for classification purposes. While the classification of IG - Ag interfaces into classes depending on structural features has already been addressed [14, 40], our parameters are the first ones yielding such a clear separation between specific antigen types.
Contributions of CDR. In considering IG - Ag interfaces, it is generally believed that VH CDR3 plays a prominent role [73] and is the most variable, a property owing to the ge-netic V(D)J rearrangement mechanisms underlying its formation and that it is the one with dominant contribution to the Ag binding. To refine this view, our goal has been to precisely characterize the respective contributions of CDR at interfaces, and the relative positions of the six CDR along with the ligand position across them.
For the roles of all CDRs, while we confirm the prominent role of VH CDR3, we also observe that in terms of buried surface area, the contribution of VH CDR3 is essentially matched by the joint contributions of VH CDR1 and VH CDR2. Thus, in terms of binding affinity and while focusing on the interaction energy between the IG and the Ag, a precise description needs to consider VH CDR3 and VH CDR1 + VH CDR2 on an equal footing. The BSA has long been known as a simple and informative descriptor of interfaces [4], and we show that the average BSA per atom is a signature of the ligand type bound by an IG. Since we also show that the length of CDR does not correlate with their BSA, we suggests that despite the statistical significance of correlations between CDR length and ligand type [21], predicting the ligand type bound by an IG requires more than only CDR length information. Moreover the fact that CDR of the same length can have radically different contribution at the interface, calls into question the classification of CDR into canonical structures based on individual CDR lengths [54]. Finally, we also note that VL CDR2 hardly contributes to the interface for chemical ligands, and very little in general.
As far as the relative position of CDR is concerned, a precise characterization was missing to complement qualitative views [20, Chapter 4]. We fill this gap analyzing seam statistics, namely contiguous boundaries between pairs of CDR, for all CDR atoms, and also for interfacial CDR atoms. Remarkably, out of 15 possibles seams, only seven appear, and these are remarkably conserved–irrespective of the ligand type or the category of atoms considered. Phrased differently, the same seams occur within VH and VL, but they are longer in VH. Several other remarkable facts emerge from this analysis. First, the arrangement of CDR are more similar between peptide and chemical ligands than between peptide or chemical ligands and protein ligands. In a similar vein, the seam between VL CDR1 and VL CDR2 contributes more to the interface for protein ligands than for peptide or chemical ligands. These features specifically identify the ligand targeted, a property complementing the observations already made at the whole interface level. Second, VL CDR2 is often away from the interface.
We finally note that our approach favors a purely geometric description of the IG and the IG - Ag complex structures, and that, as such, it complements the numerous analyses focused on CDR amino acid composition and length based on sequence data [61, 30, 26, 19] [6, 67, 5]. Affinity prediction. To complement the previous analysis, we applied recent binding affinity predictors based on the same structural parameters [50] so as to predict the binding affinity of 14 IG with their respective Ag. These are all rigid cases as the interface RMSD and whole IG RMSD were below 1.24 and 0.95 Å, respectively. The predictions of Kdare accurate within two orders of magnitude for all but one complex and within one order of magnitude for 9 of them.
Although they were obtained on a very small dataset, these results suggest that predictions at this level of accuracy for IG may be easier than for more general protein - protein complexes [50].
However, obtaining more accurate predictions, say within one order of magnitude or equiva-lently within 1.4 kcal/mol remains an open problem, as taking subtle entropic effects coding the dynamics appears mandatory [60].
Future work. This work proposes novel parameters shedding light on the specificity of IG for their antigens, and the binding affinity of the corresponding complexes. Outstanding questions remain, both to model interfaces of IG - Ag complexes, and to model whole IG.
At the interface level, predicting the geometry of a complex given the unbound partners, and the associated affinity remains a daunting challenge. The classical route consists of using sampling techniques and docking algorithms to generate poses for the complex, which are further ranked by scoring functions aiming at detecting the most plausible ones. Our work bears promises in this pipeline, as our structural parameters (in particular the BSA per atom and the seam patterns) may be used to check that the complex selected matches the specific observations raised, in particular as a function of the ligand type. Likewise, upon generating a valid geometry, our affinity prediction tools can be used to predict the affinity–a strategy calling again for tests on more cases. Together, these tools could lead to consequent advances in antibody design [45, 63]. At the whole IG level, various structural features of IG proteins influence their properties whence their efficacy in the immune response. These include the ball-and-socket joint relating VL and VH, the CL and CH1 constant domains [44, 66], and more generally the constant regions which have been shown to influence the avidity [22, 23, 51, 57], and are involved in IG effector properties, such as ADCC or CDC [29]. A quantitative assessment of the role of these features requires going beyond the IG - Ag interface level, with a clear focus on the dynamics of the whole IG protein. In doing so, novel ideas will be needed to sample efficiently conformations of whole IG, and study the associated (potential, free) energy landscapes.
5
Artwork
Figure 1 Voronoi interface model of an Immunoglobulin - Antigen (IG - Ag) com-plex, defined from the solvent accessible model of the crystallographic complex. The IG consists of H and L chains, with here the VH and VL domains shown in grey (cartoon repre-sentation), while the Ag consists of the chain in blue (CPK representation). (Top left) IG - Ag complex, with the six complementarity determining regions (CDR) colored using the IMGT con-ventions (VH CDR1: red, VH CDR2: orange, VH CDR3: purple, VL CDR1: blue, VL CDR2: green, VL CDR3: green-blue). (Top right) The Voronoi interface is a polyedral model separat-ing the partners, whose parameters (area, curvature) convey information of the bindseparat-ing modes. (Bottom left)The Voronoi interface can be divided into concentric shell. Each shell contains the Voronoi facets which are at the same minimum distance from the interface boundary. This distance is called the shelling order of the facet (SO for short). For instance, purple facets touch the boundary (SO=1), blue facets must cross a purple facet to reach the boundary (SO=2), and so on. (Bottom right) Each face of the Voronoi interface involves two interacting atoms, either from the partners or the interfacial water molecules sandwiched between them. The buried surface area(BSA) on each partner (by the second partner and interfacial water) is of prime in-terest to describe the interface. For the IG, the BSA can be charged to the CDR and framework regions (FR). (Bottom right inset) The interface atoms of a partner define its binding patch, and, similarly to the Voronoi interface, can be shelled into concentric shells (from the outside to the core), defining a distance to the patch boundary. The binding patch on the IG side is shown from above (inset) to get a clearer view of all the shells.
Figure 2 Hierarchical decomposition of the Voronoi interface of Fig. 1. The IG (or the Fab fragment) is decomposed into heavy (H) and light (L) chains (one H and one L per Fab) whose variable domains only (VH and VL) are of interest in this study. These domains are further decomposed into three complementarity determining regions (CDR) and four framework regions (FR). These fourteen primitive labels induce a partition of the Voronoi interface and binding patches.
IG
Ag
IG-Ag complex Hierarchical decomposition W Partners: IG and Ag
IG
WAg
H L L V H V L V H V L Interfacial water molecules CDR1 CDR2 CDR3 F R1 F R2 F R3 F R4 CDR1 CDR2 CDR3 F R1 F R2 F R3 F R4 FabFigure 3 Average buried surface areas per atom (Equations (1) (2)): bsaIG versus bsaAg. (Main panel) Scatter plot as a function of the ligand type. The three lines show the separators defined by the decision tree rules, separating the ligand types (see main text and Supp. Fig. 14). (Inset) Color gradient indicating the ligand size, in number of atoms, from small (yellow) to large (red).
2 4 6 8 10
BSA per atom, IG binding patch 5 10 15 20 25 30 35 40 45 BSA p er atom , Ag bind ing patc h Chemical Protein Peptide 2O5X L1 L2 L3
Figure 4 Buried Surface Area (A2): relative contributions of the VH and VL. 0 200 400 600 800 1000 1200 1400 1600 1800 BSA of VH 0 100 200 300 400 500 600 700 BSA of VL Peptide Protein Chemical x = y 3NGB 4OGY
Figure 5 Buried Surface Area (A2): relative contributions of the CDR.
0 100 200 300 400 500 600 CDR1 + CDR2 BSA ( 2 ) 0 100 200 300 400 500 600 700 CDR3 BS A ( 2 ) VH Peptide Protein Chemical x = y
(a) Relative contributions of the CDR from VH.
0 50 100 150 200 250 300 350 400 CDR1 + CDR2 BSA ( 2 ) 0 50 100 150 200 250 300 CDR3 BS A ( 2 ) VL Peptide Protein Chemical x = y
Figure 6 VH CDR length versus BSA.VH CDR1 and VH CDR2 are grouped due to their common genomic origin.
0 100 200 300 400 500 600 BSA(CDR1) + BSA(CDR2) ( 2) [8, 7] [8, 8] [8, 10] [9, 7] [10, 7] [10, 9] Length of [CDR1, CDR2] in AA Chemical Protein Peptide
(a) VH CDR1 and VH CDR2, Human. Five com-plexes are discarded because of aberrant VH CDR1 and VH CDR2 lengths (see Supp. Section 6.2).
0 100 200 300 400 500 BSA(CDR1) + BSA(CDR2) ( 2) [8, 7] [8, 8] [8, 10] [9, 7] [10, 7] Length of [CDR1, CDR2] in AA Chemical Protein Peptide (b) VH CDR1 and VH CDR2, Mouse. 0 100 200 300 400 500 600 700 BSA ( 2) 5 10 15 20 25 Length in AA Chemical Protein Peptide
(c) VH CDR3, Human. Twelve complexes are dis-carded because of aberrant VL CDR1 and VL CDR2 lengths (see Supp. Section 6.2).
0 100 200 300 400 500 BSA ( 2) 4 6 8 10 12 14 16 18 20 Length in AA Chemical Protein Peptide (d) VH CDR3, Mouse.
Figure 7 VL CDR length versus BSA.VL CDR1 and VL CDR2 are grouped due to their common genomic origin.
0 50 100 150 200 250 300 350 BSA(CDR1) + BSA(CDR2) ( 2) [6, 3] [7, 3] [8, 3] [9, 3] [11, 3] [12, 3] Length of [CDR1, CDR2] in AA Chemical Protein Peptide
(a) VL CDR1 and VL CDR2, Human. The [CDR1.CDR2] lengths [6.3] characterize both V-kappa and V-lambda. The other lengths charac-terize either kappa ([7.3], [11.3] and [12.3]) or V-lambda ([8.3] and [9.3]). 0 50 100 150 200 250 300 350 400 BSA(CDR1) + BSA(CDR2) ( 2) [5, 3] [6, 3] [7, 3] [7, 7] [9, 3] [10, 3] [11, 3] [12, 3] Length of [CDR1, CDR2] in AA Chemical Protein Peptide
(b) VL CDR1 and VL CDR2, Mouse. The [CDR1.CDR2] lengths [7.7] and [9.3] characterize V-lambda. The other lengths characterize V-kappa.
0 50 100 150 200 250 300 BSA (2) 4 6 8 10 12 14 16 18 20 Length in AA Chemical Protein Peptide (c) VL CDR3, Human. 0 50 100 150 200 250 300 BSA ( 2) 8 9 10 11 12 13 Length in AA Chemical Protein Peptide (d) VL CDR3, Mouse.
Figure 8 Relative position of CDR analyzed with seams statistics. Heavy chain (chain B) from 1A2Y, with CDR shown using the IMGT color scheme, namely red: CDR1, orange: CDR2, purple: CDR3. The seam between two CDR is the the curve separating their exposed atoms in their solvent accessible representations. It consists of circle arcs contributed by pairs of intersecting atoms. On this example, the seam between VH CDR1 and VH CDR2 involves 11 circle arcs (in green).
CDR1
CDR2
CDR3
Figure 9 Consensus representations for seams between CDR.The contacts between the 6 CDR are represented as a graph, with one edge between two CDR for which seam statistics were collected. The statistic reported is the median value of all the observations (in Å). Dashed edges show inter-chain contacts. See section 6.3 for equivalent figures as a function of the ligand type, species or V-kappa/V-lambda domain.
VH CDR2 VH CDR1 VH CDR3 VL CDR3 VL CDR1 VL CDR2 24.60 30.89 14.55 10.00 5.94 26.89 15.97 VH CDR2 VH CDR1 VH CDR3 VL CDR3 VL CDR1 VL CDR2 13.30 14.87 10.34 5.98 0.77 13.88 3.89
Figure 10 Comparison between the consensus median seam lengths and the median lengths for specific ligand types. The y axis represents the maximum normalized difference (Eq. (3)) between the consensus median length and the median length for specific ligand types. Filled bars correspond to inter-chain contacts. Note that for a given ligand type, there are 7 bars corresponding to the pairs of CDR in contact.
protein peptide chemical
Maxim um nor maliz ed diff erence −20 −12 −8 −4 0 4 8 12 16 20 24 VH CDR1−VH CDR2 VH CDR1−VH CDR3 VH CDR3−VL CDR1 VH CDR3−VL CDR2 VH CDR3−VL CDR3 VL CDR1−VL CDR2 VL CDR1−VL CDR3
protein peptide chemical
Maxim um nor maliz ed diff erence −100 −75 −45 −15 0 15 30 45 60 75 VH CDR1−VH CDR2 VH CDR1−VH CDR3 VH CDR3−VL CDR1 VH CDR3−VL CDR2 VH CDR3−VL CDR3 VL CDR1−VL CDR2 VL CDR1−VL CDR3
All atoms Interface atoms
Acknowledgements. Patrice Duroux is acknowledged for his help with the IMGT/3Dstructure-DB database.
References
[1] A. Ademokun, Y-C. Wu, V. Martin, R. Mitra, U. Sack, H. Baxendale, D. Kipling, and D.K. Dunn-Walters. Vaccination-induced changes in human b-cell repertoire and pneumococcal igm and iga antibody at different ages. Aging cell, 10(6):922–930, 2011.
[2] B. Al-Lazikani, A.M. Lesk, and C. Chothia. Standard conformations for the canonical structures of immunoglobulins. Journal of molecular biology, 273(4):927–948, 1997.
[3] J.C Almagro. Identification of differences in the specificity-determining residues of antibodies that recognize antigens of different size: implications for the rational design of antibody repertoires. Journal of Molecular Recognition, 17(2):132–143, 2004.
[4] R. Bahadur, P. Chakrabarti, F. Rodier, and J. Janin. A dissection of specific and non-specific protein–protein interfaces. JMB, 336(4):943–955, 2004.
[5] J. Benichou, J. Glanville, E.T. Luning Prak, R. Azran, T.C. Kuo, J. Pons, C. Desmarais, L. Tsaban, and Y. Louzoun. The restricted DH gene reading frame usage in the expressed human antibody repertoire is selected based upon its amino acid content. The Journal of Immunology, 190(11):5567–5577, 2013.
[6] S. Birtalan, Y. Zhang, F.A. Fellouse, L. Shao, G. Schaefer, and S.S. Sidhu. The intrin-sic contributions of tyrosine, serine, glycine and arginine to the affinity and specificity of antibodies. Journal of molecular biology, 377(5):1518–1528, 2008.
[7] Y. Bordon. Cow traps are structurally unique. Nature Reviews Immunology, 13(471), 2013. [8] B. Bouvier, R. Grunberg, M. Nilgès, and F. Cazals. Shelling the Voronoi interface of protein-protein complexes reveals patterns of residue conservation, dynamics and composi-tion. Proteins: structure, function, and bioinformatics, 76(3):677–692, 2009.
[9] J.D. Capra and J.M. Kehoe. Hypervariable regions, idiotypy, and the antibody-combining site. Adv. Immunol, 20(1), 1975.
[10] R. Castro, L. Journeau, H.P. Pham, O. Bouchez, V. Giudicelli, M-P. Lefranc, E. Quillet, A. Benmansour, F. Cazals, A. Six, S. Fillatreau, O. Sunyer, and P. Boudinot. Teleost fish mount complex clonal IgM and IgT responses in spleen upon systemic viral infection. PLOS Pathogens, 9(1):e1003098, 2013.
[11] F. Cazals. Revisiting the Voronoi description of protein-protein interfaces: Algorithms. In T. Dijkstra, E. Tsivtsivadze, E. Marchiori, and T. Heskes, editors, International Conference on Pattern Recognition in Bioinformatics, pages 419–430, Nijmegen, the Netherlands, 2010. Lecture Notes in Bioinformatics 6282.
[12] F. Cazals, F. Proust, R. Bahadur, and J. Janin. Revisiting the Voronoi description of protein-protein interfaces. Protein Science, 15(9):2082–2092, 2006.
[13] A. Chailyan, P. Marcatili, D. Cirillo, and A. Tramontano. Structural repertoire of im-munoglobulin λ light chains. Proteins: Structure, Function, and Bioinformatics, 79(5):1513– 1524, 2011.
[14] A. Chailyan, P. Marcatili, and A. Tramontano. The association of heavy and light chain variable domains in antibodies: implications for antigen specificity. FEBS Journal, 278(16):2858–2866, 2011.
[15] C.A. Chia-en, W. Chen, and M.K. Gilson. Ligand configurational entropy and protein binding. PNAS, 104(5):1534–1539, 2007.
[16] Y. Choi and C.M. Deane. Predicting antibody complementarity determining region struc-tures without classification. Molecular Biosystems, 7(12):3327–3334, 2011.
[17] C. Chothia and A.M. Lesk. Canonical structures for the hypervariable regions of im-munoglobulins. J. Mol. Bio, 196(4), 1987.
[18] C. Chothia, A.M. Lesk, A. Tramontano, M. Levitt, S.J. Smith-Gill, G. Air, S. Sheriff, E.A. Padlan, D. Davies, W.R. Tulip, et al. Conformations of immunoglobulin hypervariable regions. Nature, 342(6252):877–883, 1989.
[19] L.A. Clark, S. Ganesan, S. Papp, and H.W.T van Vlijmen. Trends in antibody sequence changes during the somatic hypermutation process. The Journal of Immunology, 177(1):333– 340, 2006.
[21] A.V.J. Collis, A.P. Brouwer, and A.C.R. Martin. Analysis of the antigen combining site: correlations between length and sequence composition of the hypervariable loops and the nature of the antigen. Journal of molecular biology, 325(2):337–354, 2003.
[22] L.J. Cooper, A.R. Shikhman, D.D Glass, D. Kangisser, M.W. Cunningham, and N.S. Greenspan. Role of heavy chain constant domains in antibody-antigen interaction. appar-ent specificity differences among streptococcal IgG antibodies expressing idappar-entical variable domains. The Journal of Immunology, 150(6):2231–2242, 1993.
[23] L.J.N Cooper, D. Robertson, R. Granzow, and N.S. Greenspan. Variable domain-identical antibodies exhibit IgG subclass-related differences in affinity and kinetic constants as deter-mined by surface plasmon resonance. Molecular immunology, 31(8):577–584, 1994.
[24] J. Dunitz. Win some, lose some: enthalpy-entropy compensation in weak intermolecular interactions. Chemistry & biology, 2(11):709–712, 1995.
[25] F. Ehrenmann, Q. Kaas, and M-P. Lefranc. IMGT/3Dstructure-DB and IMGT/DomainGapAlign: a database and a tool for immunoglobulins or antibodies, T cell receptors, MHC, IgSF and MhcSF. Nucl. Acids Res., 38:D301–307, 2010.
[26] F.A. Fellouse, P.A. Barthelemy, R.F. Kelley, and S.S. Sidhu. Tyrosine plays a dominant functional role in the paratope of a synthetic antibody derived from a four amino acid code. Journal of molecular biology, 357(1):100–114, 2006.
[27] W.J.J Finlay and J.C. Almagro. Natural and man-made v-gene repertoires for antibody discovery. Frontiers in immunology, 3, 2012.
[28] M. Gerstein and F.M. Richards. Protein geometry: volumes, areas, and distances. In M. G. Rossmann and E. Arnold, editors, The international tables for crystallography (Vol F, Chap. 22), pages 531–539. Springer, 2001.
[29] L.W. Guddat, L. Shan, Z-C. Fan, K.N. Andersen, R. Rosauer, D.S. Linthicum, and A.B. Edmundson. Intramolecular signaling upon complexation. The FASEB journal, 9(1):101– 106, 1995.
[30] I. Ivanov, J-M. Link, G. Ippolito, and H.H. Schroeder. Constraints on hydropathicity and sequence composition of HCDR3 are conserved across evolution. The antibodies, 7:43–67, 2002.
[31] J. Janin. A minimal model of protein–protein binding affinities. Protein Science, 23(12):1813–1817, 2014.
[32] J. Janin, R. P. Bahadur, and P. Chakrabarti. Protein-protein interaction and quaternary structure. Quarterly reviews of biophysics, 41(2):133–180, 2008.
[33] S. Jones and JM Thornton. Principles of protein-protein interactions. PNAS, 93(1):13–20, 1996.
[34] P.L. Kastritis, I.H. Moal, H. Hwang, Z. Weng, P.A. Bates, A. Bonvin, and J. Janin. A structure-based benchmark for protein-protein binding affinity. Protein Science, 20:482– 491, 2011.
[35] P.L. Kastritis, J.P.G.L.M. Rodrigues, G.E. Folkers, R. Boelens, and A.M.J.J. Bonvin. Pro-teins feel more than they see: Fine-tuning of binding affinity by properties of the non-interacting surface. J.M.B., 426:2632–2652, 2014.
[36] O.V. Koliasnikov, M.O. Kiral, V.G. Grigorenko, and A.M. Egorov. Antibody CDR H3 modeling rules: extension for the case of absence of Arg H94 and Asp H101. Journal of bioinformatics and computational biology, 4(02):415–424, 2006.
[37] D. Kuroda, H. Shirai, M. Kobori, and H. Nakamura. Structural classification of CDR-H3 revisited: A lesson in antibody modeling. Proteins: Structure, Function, and Bioinformatics, 73(3):608–620, 2008.
[38] D. Kuroda, H. Shirai, M. Kobori, and H. Nakamura. Systematic classification of CDR-L3 in antibodies: Implications of the light chain subtypes and the VL–VH interface. Proteins: Structure, Function, and Bioinformatics, 75(1):139–146, 2009.
[39] N.F. Landolfi, A.B. Thakur, H. Fu, M. Vásquez, C. Queen, and N. Tsurushita. The integrity of the ball-and-socket joint between V and C domains is essential for complete activity of a humanized antibody. The Journal of Immunology, 166(3):1748–1754, 2001.
[40] M. Lee, P. Lloyd, X. Zhang, J.M. Schallhorn, K. Sugimoto, A.G. Leach, G. Sapiro, and K.N. Houk. Shapes of antibody binding sites: qualitative and quantitative analyses based on a geomorphic classification scheme. The Journal of organic chemistry, 71(14):5082–5092, 2006.
[41] M-P. Lefranc. Immunoglobulin (IG) and T cell receptor (TR) genes: IMGT® and the birth and rise of immunoinformatics. Frontiers in Immunology, 5:22, 2014.
[42] M-P. Lefranc and G. Lefranc. The immunoglobulin FactsBook. Academic Press, 2001. [43] M-P. Lefranc, C. Pommié, M. Ruiz, V. Giudicelli, E. Foulquier, L. Truong, V.
Thouvenin-Contet, and G. Lefranc. IMGT unique numbering for immunoglobulin and T cell receptor variable domains and Ig superfamily V-like domains. Developmental & Comparative Im-munology, 27(1):55–77, 2003.
[44] A. Lesk and C. Chothia. Elbow motion in the immunoglobulins involves a molecular ball-and-socket joint. Nature, 8(335):188–90, 1988.
[45] S.M. Lippow, K.D. Wittrup, and B. Tidor. Computational design of antibody-affinity im-provement beyond in vivo maturation. Nature biotechnology, 25(10):1171–1176, 2007. [46] L. Lo Conte, C. Chothia, and J. Janin. The atomic structure of protein-protein recognition
sites. JMB, 285(5):2177–2198, 1999.
[47] R.M. MacCallum, A.C.R. Martin, and J.M. Thornton. Antibody-antigen interactions: con-tact analysis and binding site topography. Journal of molecular biology, 262(5):732–745, 1996.
[48] N. Malod-Dognin, A. Bansal, and F. Cazals. Characterizing the morphology of protein binding patches. Proteins: structure, function, and bioinformatics, 80(12):2652–2665, 2012. [49] V. Manivel, N.C. Sahoo, D.M. Salunke, and K.V.S Rao. Maturation of an antibody response is governed by modulations in flexibility of the antigen-combining site. Immunity, 13(5):611– 620, 2000.
[50] S. Marillet, P. Boudinot, and F. Cazals. High resolution crystal structures leverage protein binding affinity predictions. Under revision, (NA), 2015. Preprint: Inria tech report 8733.
[51] N McCloskey, MW Turner, P Steffner, R Owens, and D Goldblatt. Human constant regions influence the antibody binding characteristics of mouse-human chimeric IgG subclasses. Immunology, 88(2):169–173, 1996.
[52] G. Meng, N. Arkus, M.P. Brenner, and V.N. Manoharan. The free-energy landscape of clusters of attractive hard spheres. Science, 327(5965):560–563, 2010.
[53] V. Morea, A. Tramontano, M. Rustici, C. Chothia, and A.M. Lesk. Conformations of the third hypervariable region in the VH domain of immunoglobulins. Journal of molecular biology, 275(2):269–294, 1998.
[54] B. North, A. Lehmann, and R.L. Dunbrack. A new clustering of antibody CDR loop conformations. Journal of molecular biology, 406(2):228–256, 2011.
[55] W.E. Paul. Fundamental Immunology (7th Ed.). Lippincott Williams and Wilkins, Wolters and Kluwer, 2013.
[56] O. Pritsch, G. Hudry-Clergeon, M. Buckle, Y. Pétillot, J-P. Bouvet, J. Gagnon, and G. Dighiero. Can immunoglobulin CH1 constant region domain modulate antigen bind-ing affinity of antibodies? Journal of Clinical Investigation, 98(10):2235, 1996.
[57] O. Pritsch, C. Magnac, G. Dumas, J-P. Bouvet, P. Alzari, and G. Dighiero. Can isotype switch modulate antigen-binding affinity and influence clonal selection? European journal of immunology, 30(12):3387–3395, 2000.
[58] G. Raghunathan, J. Smart, J. Williams, and J-C. Almagro. Antigen-binding site anatomy and somatic mutations in antibodies that recognize different types of antigens. Journal of Molecular Recognition, 25(3):103–113, 2012.
[59] D. Rajamani, S. Thiel, S. Vajda, and C.J. Camacho. Anchor residues in protein-protein interactions. PNAS, 101(31):11287–11292, 2004.
[60] A. Schmidt, H. Xu, A. Khan, T. O’Donnell, S. Khurana, L. King, J. Manischewitz, H. Gold-ing, P. Suphaphiphat, A. Carfi, E. Settembre, P. Dormitzer, T. Kepler, R. Zhang, A. Moody, B. Haynes, H-X. Liao, D. Shaw, and S. Harrison. Preconfiguration of the antigen-binding site during affinity maturation of a broadly neutralizing influenza virus antibody. PNAS, 110(1):264–269, 2013.
[61] H.W. Schroeder, M. Zemlin, M. Khass, H.H. Nguyen, and R.L. Schelonka. Genetic control of DH reading frame and its effect of B-cell development and antigen-specific antibody production. Critical reviews in Immunology, 30(4):327–344, 2010.
[62] H. Shirai, A. Kidera, and H. Nakamura. Structural classification of CDR-H3 in antibodies. FEBS letters, 399(1):1–8, 1996.
[63] H. Shirai, C. Prades, R. Vita, P. Marcatili, B. Popovic, J. Xu, J.P. Overington, K. Hirayama, S. Soga, K. Tsunoyama, et al. Antibody informatics for drug discovery. Biochimica et Biophysica Acta (BBA)-Proteins and Proteomics, 1844(11):2002–2015, 2014.
[64] J. Shirai, A. Kidera, and H. Nakamura. H3-rules: identification of CDR-H3 structures in antibodies. FEBS letters, 455(1):188–197, 1999.
[65] A. Six, M.E. Mariotti-Ferrandiz, W. Chaara, S. Magadan, H-P. Pham, M-P. Lefranc, T. Mora, V. Thomas-Vaslin, A.M. Walczak, and P.Boudinot. The past, present, and future of immune repertoire biology–the rise of next-generation repertoire analysis. Frontiers in immunology, 4, 2013.
[66] R.L. Stanfield, A. Zemla, I.A Wilson, and B. Rupp. Antibody elbow angles are influenced by their light chain class. Journal of molecular biology, 357(5):1566–1574, 2006.
[67] C.A. Thomson, K.Q. Little, D.C. Reason, and J.W. Schrader. Somatic diversity in CDR3 loops allows single V-genes to encode innate immunological memories for multiple pathogens. The Journal of Immunology, 186(4):2291–2298, 2011.
[68] S. Tonegawa. Somatic generation of antibody diversity. Nature, 302(5909):575–581, 1983. [69] M. Torres, N. Fernández-Fuentes, A. Fiser, and A. Casadevall. The immunoglobulin heavy
chain constant region affects kinetic and thermodynamic parameters of antibody variable region interactions with antigen. Journal of Biological Chemistry, 282(18):13917–13927, 2007.
[70] E. Vargas-Madrazo, F. Lara-Ochoa, and J.C. Almagro. Canonical structure repertoire of the antigen-binding site of immunoglobulins suggests strong geometrical restrictions associated to the mechanism of immune recognition. Journal of molecular biology, 254(3):497–504, 1995.
[71] F. Wang, D.C. Ekiert, I. Ahmad, W. Yu, Y. Zhang, O. Bazirgan, A. Torkamani, T. Raud-sepp, W. Mwangi, M.F. Criscitiello, et al. Reshaping antibody diversity. Cell, 153(6):1379– 1393, 2013.
[72] T.T. Wu and E.A. Kabat. An analysis of the sequences of the variable regions of bence jones proteins and myeloma light chains and their implications for antibody complementarity. The Journal of experimental medicine, 132(2):211–250, 1970.
[73] J.L Xu and M.M. Davis. Diversity in the CDR3 region of VH is sufficient for most antibody specificities. Immunity, 13(1):37–45, 2000.
6
Supplemental: Results
6.1
Dataset
We use the IMGT/3Dstructure-DB database [25], version of January 2015. For each entry, the atoms of the complementarity determining regions (CDR) of the IG are annotated using the IMGT unique numbering scheme [43], recalled in Table 1. Out of 1363 submitted files, 1035 were processed (other were discarded because of various problems, see the report in appendix), 596 complexes were extracted after the redundancy was filtered, out of which 537 could be part of the analysis (26 other were discarded because there was no interface or the contacts were not made with the Fab of the IG)
Table 1 Amino acid positions associated with each IMGT label defining the decom-position of a V-domain into seven regionsPositions of the complementarity determining regions (CDR) using the IMGT numbering scheme [43].
Region FR1 CDR1 FR2 CDR2 FR3 CDR3 FR4
start-stop 1 - 26 27 - 38 39 - 55 56 - 65 66 - 104 105 - 117 118 - 128
Table 2 Summary of the number of IG - Ag complexes in each class of species / ligand type. The dataset includes VH (V-domains of heavy chains)and VL comprising V-KAPPA (V domains of kappa chains) and V-LAMBDA (V domains of lambda chains.
Mouse Human Other total
Peptide 81 34 11 126
Protein 191 104 31 326
Chemical 65 7 5 77
total 337 145 47 529
Table 3 Number of occurrences of the isotypes in the dataset
Isotype A G M Unknown