HAL Id: hal-00296158
https://hal.archives-ouvertes.fr/hal-00296158
Submitted on 22 Feb 2007
HAL is a multi-disciplinary open access
archive for the deposit and dissemination of
sci-entific research documents, whether they are
pub-lished or not. The documents may come from
teaching and research institutions in France or
abroad, or from public or private research centers.
L’archive ouverte pluridisciplinaire HAL, est
destinée au dépôt et à la diffusion de documents
scientifiques de niveau recherche, publiés ou non,
émanant des établissements d’enseignement et de
recherche français ou étrangers, des laboratoires
publics ou privés.
global tropospheric ozone
A. M. Aghedo, M. G. Schultz, S. Rast
To cite this version:
A. M. Aghedo, M. G. Schultz, S. Rast. The influence of African air pollution on regional and global
tropospheric ozone. Atmospheric Chemistry and Physics, European Geosciences Union, 2007, 7 (5),
pp.1193-1212. �hal-00296158�
© Author(s) 2007. This work is licensed under a Creative Commons License.
Chemistry
and Physics
The influence of African air pollution on regional and global
tropospheric ozone
A. M. Aghedo1,2, M. G. Schultz3, and S. Rast1
1Max Planck Institute for Meteorology, Hamburg, Germany
2International Max Planck Research School on Earth System Modelling, Hamburg, Germany 3ICG-II, Research Centre, J¨ulich, Germany
Received: 3 May 2006 – Published in Atmos. Chem. Phys. Discuss.: 4 July 2006 Revised: 19 January 2007 – Accepted: 15 February 2007 – Published: 22 February 2007
Abstract. We investigate the influence of African biomass burning, biogenic, lightning and anthropogenic emissions on the tropospheric ozone over Africa and globally using a cou-pled global chemistry climate model. Our model studies in-dicate that surface ozone concentration may rise by up to 50 ppbv in the burning region during the biomass burning seasons. Biogenic emissions yield between 5–30 ppbv in-crease in the near surface ozone concentration over tropical Africa. The impact of lightning on surface ozone is negli-gible, while anthropogenic emissions yield a maximum of 7 ppbv increase in the annual-mean surface ozone concentra-tion over Nigeria, South Africa and Egypt. Our results show that biogenic emissions are the most important African emis-sion source affecting total tropospheric ozone. The influence of each of the African emissions on the global tropospheric ozone burden (TOB) of 384 Tg yields about 9.5 Tg, 19.6 Tg, 9.0 Tg and 4.7 Tg for biomass burning, biogenic, lightning and anthropogenic emissions emitted in Africa respectively. The impact of each of these emission categories on African TOB of 33 Tg is 2.5 Tg, 4.1 Tg, 1.75 Tg and 0.89 Tg respec-tively, which together represents about 28% of the total TOB calculated over Africa. Our model calculations also sug-gest that more than 70% of the tropospheric ozone produced by each of the African emissions is found outside the con-tinent, thus exerting a noticeable influence on a large part of the tropical troposphere. Apart from the Atlantic and In-dian Ocean, Latin America experiences the largest impact of African emissions, followed by Oceania, the Middle East, Southeast and south-central Asia, northern North America (i.e. the United States and Canada), Europe and north-central Asia, for all the emission categories.
Correspondence to: A. M. Aghedo
(adetutu.aghedo@gmail.com)
1 Introduction
Air pollution emitted in Africa comes from four sources, mainly biomass burning, natural emission from vegetation and soil, lightning NOxemissions, and other anthropogenic
sources – such as emissions related to the combustion of fossil-fuel for energy, industrial, transport and domestic uses. Africa contributes a significant amount to the global emis-sions from the first three categories, while emisemis-sions from fossil fuel combustion are important only on the regional scale. Emissions of trace species (e.g. CO, NOx, volatile
or-ganic compounds (VOCs)) significantly affect tropospheric chemistry and lead to the formation of tropospheric ozone, which influences the radiative forcing (e.g. Naik et al., 2005; Dentener et al., 2005).
African biomass burning activities, generally categorised as savanna, forest and agricultural waste burning, are driven by the “slash and burn” agricultural practices that take place during the dry seasons – late November to early March in the northern hemisphere (NH), and July to October in the southern hemispheric (SH) part of Africa (Marenco et al., 1990). African biomass burning contributes about 40% to trace species emitted by global biomass burning activi-ties (Crutzen et al., 1979; Andreae, 1991; Helas et al., 1995, Schultz et al., 20071), and exerts a large influence on tro-pospheric chemistry (Crutzen and Andreae, 1990; Andreae, 1993; Helas et al., 1992, 1995; Marufu et al., 2000). Marufu et al. (2000) used a global chemistry transport model to test the sensitivity of tropospheric ozone over Africa to emissions from biomass burning from all over the world and found that about 16% of the 26 Tg tropospheric ozone burden (TOB) over Africa is due to these global biomass burning emissions.
1Schultz, M. G., Heil, A., Hoelzemann, J. H., Spessa, A.,
Thonicke, K., Goldammer, J., Held, A. C., and Pereira, J. M.: Global Emissions from Wildland Fires in 1960 to 2000, Global Bio-geochem. Cycles, in review, 2007.
Lightning produces NOx, mostly in the middle to
up-per troposphere (Ridley et al., 1996; Pickering et al., 1996; Lamarque et al., 1996; Pickering et al., 1998; DeCaria et al., 2000), where it has a longer lifetime and greater ozone production potential than in the lower troposphere (Liu et al., 1987; Pickering et al., 1990). For example, DeCaria et al. (2005) calculated a photochemical ozone enhancement of about 10 ppbv 24 h after a storm observed during the Stratosphere-Troposphere Experiment: Radiation, Aerosols and Ozone (STERAO-A) using a 3-D cloud-scale chem-istry transport model (CTM). Lightning activity is maxi-mum in the tropics. However, tropical thunderstorms are the least well characterized, therefore, the uncertainty of trop-ical lightning NOx is particularly large. Generally, the
to-tal contribution of lightning to the global NOx budget is
highly uncertain. Estimates range from 2–20 Tg (N) per year (Lawrence et al., 1995; Price et al., 1997; Huntrieser et al., 2002; Labrador et al., 2005). However, several stud-ies published after 2000 have suggested an estimate closer to the lower limit. Huntrieser et al. (2002) estimated about 3 Tg (N) yr−1 from lightning NOx based on detailed
anal-ysis of airborne NOx measurements of European
thunder-storms. Tie et al. (2001) and Martin et al. (2002) found that using a global lightning emission value of 7 Tg (N) yr−1and 6 Tg (N) yr−1respectively, their model simulations show rea-sonable agreement with airborne observations of reactive ni-trogen species.
Vegetation emits a wide range of VOCs (Kesselmeier and Staudt, 1999). Among these biogenic VOCs, isoprene is one of the most important (e.g., Fehsenfeld et al., 1992; Guenther et al., 1995), followed by terpenes and methanol (CH3OH).
Estimates of global isoprene emissions vary between 200 Tg and 600 Tg (Kesselmeier and Staudt, 1999; Guenther et al., 2006, and references therein), of which Africa contributes about a fifth. Biogenic VOCs can have a significant impact on tropospheric chemistry as soon as they are released into the air, because of their high reactivity. They lead to the pro-duction (or destruction) of ozone in high (or low) NOx
con-ditions. Wang and Shallcross (2000) found an increase in surface ozone concentration of about 4 ppbv over the ocean and about 8–12 ppbv over the mid-latitude land areas when isoprene emissions were included in their 3-D model simula-tions. Using biogenic CH3OH emissions of 117 Tg (C) yr−1,
Tie et al. (2003) calculated an increase of about 3–4% in the tropical ozone at 300 hPa.
In this study we performed multi-year sensitivity calcula-tions with a newly developed global chemistry climate model using the biomass burning, biogenic and anthropogenic emis-sions employed in the recent IPCC-ACCENT simulations in preparation for the fourth assessment report (e.g. see Stevenson et al., 2006; Shindell et al., 2006). The light-ning NOx emissions are calculated interactively within our
model. These sensitivity studies are used to investigate the regional and global influence of each of the African emis-sions on primary and secondary tropospheric trace species
concentrations. In particular, we focus on tropospheric ozone produced from the photochemical reactions involving precur-sors emitted in Africa. Tropospheric ozone is a greenhouse gas (Wang et al., 1980; Hansen et al., 2002), high ozone con-centrations in the air affect human health (e.g. Peden, 2001; Desqueyroux et al., 2002; Mortimer et al., 2002) and damage vegetation, including agricultural crops (e.g. Mauzerall and Wang, 2001; Oksanen and Holopainen, 2001).
A brief description of our model and the setup of the sim-ulation experiments are given in Sects. 2 and 3 respectively. An evaluation of ECHAM5-MOZ is presented in Sect. 4. The results of the sensitivity experiments are discussed in Sect. 5. Conclusions and a summary are given in Sect. 6.
2 The global chemistry climate model ECHAM5-MOZ
The full description of ECHAM5-MOZ and its sensitivity to the use of different emission inventories can be found in Rast et al. (2007)2. The 3-D global chemistry climate model ECHAM5-MOZ is part of the Max Planck Insti-tute, Hamburg Earth System Model (ESM) and consists of the 3-D global general circulation model (GCM) ECHAM5 (Roeckner et al., 2003) and the 3-D global CTM, MOZART2 (Horowitz et al., 2003), with modified parameterizations of dry and wet deposition, surface ultraviolet (UV) albedo, and lightning NOxproduction. The ECHAM5-MOZ model
em-ploys a consistent link of the chemistry calculation with the parameterisation of the dynamics and the physics of the ECHAM5 model.
2.1 Atmospheric dynamics
The dynamical core of ECHAM5 solves prognostic equa-tions for vorticity, divergence, logarithm of surface pres-sure and temperature expressed in spectral coefficients. The vertical axis uses a hybrid terrain-following sigma-pressure coordinate system (Simmons and Burridge, 1981). The model uses a semi-implicit leapfrog time integration scheme (Robert et al., 1972; Robert, 1981, 1982) with a special time filter (Asselin, 1972). Details of the physical parameteri-sations including radiation, surface processes, gravity wave drag, convection, stratiform cloud formation, orbit varia-tions, and subgrid scale orography can be found in
Roeck-ner et al. (2003). ECHAM5 (and thus ECHAM5-MOZ)
can be run in various horizontal resolutions such as T42 (∼2.8◦×2.8◦), T63 (∼1.9◦×1.9◦) and T106 (∼1◦×1◦)
us-ing 19 or 31 σ -hybrid vertical levels. It can also be run as a coupled ocean-atmosphere model or in an atmosphere-only mode. In this study, we have constrained sea surface
2Rast, S., Schultz, M. G., Aghedo, A. M., Diehl, T., Rhodin, A.,
Schmidt, H., Stier, P., Ganzeveld, L. and Walters, S.: Sensitivity of a chemistry climate model to changes in emissions and the driving meteorology, in preparation, 2007.
temperatures (SST) and sea ice (SIC) by output from cou-pled ocean-atmosphere model simulations performed in the framework of the fourth IPCC assessment report (Roeck-ner et al., 2006) in an Atmospheric Model Intercomparison Project 2 (AMIP2, Gates et al., 1999) set-up. The effect of varying model resolutions on the simulated climate is de-scribed in Roeckner et al. (2006).
2.2 Tracer transport and deposition
Tracers in ECHAM5-MOZ undergo advective and convec-tive transport, vertical diffusion, dry and wet deposition, and chemical reactions in the atmosphere. The advection of trac-ers is based on a mass conserving flux-form semi Lagrangian transport scheme (Lin and Rood, 1996) on a Gaussian grid (Arakawa C-grid, Mesinger and Arakawa (1976)). Convec-tive transport is parameterized according to the mass-flux al-gorithm of Tiedtke (1989) with modifications proposed by Nordeng (1994). ECHAM5-MOZ extends the vertical diffu-sion equations of ECHAM5 to include the net flux of trac-ers at the earth’s surface (e.g. emission and dry deposition). The dry deposition is formulated according to the scheme of Ganzeveld (2001). The wet deposition is based on the scheme of Stier et al. (2005), with modifications for below-cloud scavenging for HNO3 (Seinfeld and Pandis, 1998, ,
page 1003). This dynamical wet deposition scheme takes into consideration the solubility of the tracers and the pos-sibility of the release of trace gases into the atmosphere by re-evaporation of precipitation. The sensitivity of transport of tracers in ECHAM5 to model resolution, forcing meteo-rology and their chemical lifetime is discussed in Aghedo et al. (2007)3.
2.3 Chemistry scheme
The ECHAM5-MOZ model uses the MOZART2 tropo-spheric chemistry scheme, consisting of 63 transported species and 168 chemical reactions. The details of the chem-ical species, reactions, kinetic equations and the chemistry solver are described in Horowitz et al. (2003). As in the origi-nal MOZART model, the ECHAM5-MOZ chemical reaction scheme is flexible due to the MOZART2 preprocessor which produces machine dependent optimized (e.g. vectorized and parallelized) code for a specific set of user-defined reactions. An implicit Euler method is applied for the integration of the kinetic nonlinear differential equations for most of the species.
2.4 Lightning emissions
ECHAM5-MOZ includes interactive lightning NOx
emis-sions according to the parameterisation of Grewe et al.
3Aghedo, A. M., Schultz, M. G., and Rast, S.: Sensitivity of
tracer transport to model resolution and forcing data in the general circulation model ECHAM5, in preparation, 2007.
(2001). The lightning frequency is calculated as a function of the mean updraught velocity in a convective column. The mean updraught velocity is resolution dependent, because it depends on the size of the grid boxes. Therefore, the param-eterisation contains one freely adjustable global factor that accounts for this grid-box dependency. The NOxemissions
are proportional to the calculated flash frequency and are dis-tributed vertically in the atmosphere using C-shaped profiles for tropical and extratropical continental and marine clouds as described in Pickering et al. (1998). This parameterisa-tion yields global lightning emissions of about 2.7 Tg (N)/yr in ECHAM5-MOZ. Over Africa, total lightning emissions are about 0.7 Tg (N)/yr. A visual comparison of the spa-tial and seasonal distribution of our lightning flashes with that of Lightning Imaging Sensor (LIS) data (Christian et al., 1989, 1992 available at http://thunder.msfc.nasa.gov/data/ query/distributions.html) shows good agreement.
2.5 Biogenic emissions
In this study, we use the prescribed biogenic emissions from the recent IPCC-ACCENT Photocomp 2030 intercompari-son experiment (Stevenintercompari-son et al., 2006). The biogenic emis-sions are 756 Tg (C) yr−1, 68 Tg (C) yr−1, and 8 Tg (N) yr−1 for non-methane VOCs (NMVOC), CO and NOx
respec-tively. Isoprene, terpenes and methanol account for about 68%, 17% and 11% of the biogenic NMVOC respectively. As an alternative to prescribed globally-gridded biogenic NMVOC emissions, ECHAM5-MOZ offers the option of an online calculation of biogenic NMVOC emissions according to the Model of Emissions of Gases and Aerosols from Na-ture (MEGAN) (Guenther et al., 2006).
2.6 Other emissions
The ECHAM5-MOZ model needs gridded emission data for emissions that are not calculated interactively. Emissions such as biomass burning (all open fires including savanna, forest, and agricultural burning), aircraft, ocean and anthro-pogenic emissions (such as fossil-fuel combustion by the domestic, transport and industrial sectors) are prescribed to the ECHAM5-MOZ model as monthly-mean globally grid-ded files. They are injected into the model at various model heights.
With the exception of the lightning emissions, which are calculated from the interactive lightning parameterisation in ECHAM5-MOZ as discussed in Sect. 2.4, all emissions used for this study are identical to those used in the IPCC-ACCENT experiment (Stevenson et al., 2006). These data sets are a combination of emission inventories of the Insti-tute for Applied System Analysis (IIASA), the Global Emis-sions Inventory Activity (GEIA), the Global Fire EmisEmis-sions Database (GFED) version 1 (Randerson et al., 2005) and the Emission Database for Global Atmospheric Research (EDGAR) version 3.2 (Olivier et al., 1999).
Table 1. Global trace gas emissions by source used in this study
and contribution from the African continent to the respective global total in parenthesis.
CO NMVOC NOx
Source (Tg (C)/yr) (Tg (C)/yr) (Tg (N)/yr)
Industrial 201 (16%) 66 (14%) 28.0 (5%) Biomass burning 217 (43%) 19 (42%) 10.0 (46%) Biogenic 69 (20%) 756 (25%) 8.0 (30%) Lightning – – 2.7 (26%) Aircraft – – 0.7 (4%) Ocean 9 (–) 4 (–) – All sources 496 (28%) 845 (24%) 49.4 (18%) Marufu et al. (2000) 482 (23%) 534 (23%) 40.0 (18 %)
Anthropogenic CO, NOx and NMVOC emissions such
as domestic, industrial, road transport, off-road and power-plants fossil-fuel combustion and gas flaring are as calculated by the IIASA global version of the Regional Air Pollution Information and Simulation (RAINS) model (Amann et al., 1999) for the year 2000. The international shipping CO, NOx
and NMHC emissions are based on the EDGAR3.2 global emission inventory (Olivier et al., 1999), while aircraft NOx
emissions are specified according to the IPCC special report on Aviation and the Global Atmosphere (IPCC, 1999).
The biomass burning emissions, which include savanna, forest and deforestation fires, and agricultural waste burn-ing are from the GFED version 1 (Randerson et al., 2005) database available at http://daac.ornl.gov/. For the simula-tions described in this paper, we use the 1997–2002 average data. Ocean CO and soil CO, H2 and NOx emissions are
from the GEIA database (see Horowitz et al., 2003). The biogenic VOC emissions from vegetation are based on the global model of natural VOC contributed to the GEIA activ-ity by Guenther et al. (1995).
Table 1 lists the global CO, NOxand NMVOC emissions
by source used in this study, and the amount contributed by African emissions are included as the percentages of the global emissions. It also contain the comparison of our sions to those of Marufu et al. (2000). Our biogenic emis-sions are about twice as high as those of Marufu et al. (2000), while others are comparable.
3 Model simulations
The model experiments follow the general setup for the IPCC-ACCENT intercomparison study (Stevenson et al., 2006). The experiments were run for present-day climate and emissions. The climate conditions (sea surface temperatures and sea ice fields) were taken from six consecutive years of
coupled ocean-atmosphere simulations performed at the Max Planck Institute for Meteorology, Hamburg. Present-day constant concentrations of 1760 ppbv, 367 ppm and 316 ppbv were maintained for CH4, CO2and N2O respectively.
ECHAM5 model climate simulations give better results at higher spatial resolutions (Roeckner et al., 2006). Specifi-cally, T42L19 and T63L31 have a particularly good balance between computational costs and quality of the results. How-ever, Aghedo et al. (2007)3show that the simulated transport of tracers in T42L31 is significantly different from that in T42L19, but comparable to that in the computationally more expensive T63L31 resolution. Each experiment in this study was therefore performed in the T42L31 resolution for 5 years (1997–2001) after a spin-up of 6 months.
We performed one reference experiment and 4 sensitiv-ity experiments. The reference experiment includes all the emissions, while in each of the sensitivity experiments, we switch off one of the following emission categories over the African continent: biomass burning, biogenic, lightning, or anthropogenic emissions, respectively. The differences be-tween the reference and the sensitivity experiments therefore show the impact of each of the African emissions.
We are aware that setting an emission source to zero af-fects the lifetime of other trace species in the troposphere. Nevertheless, this approach provides a relatively uncom-plicated method in assessing the potential impact of these different emission types. Also, the method has the ad-vantage that the combined effect of different species (e.g. CO, NOx and NMVOC) from the same emission category
(e.g. biomass burning) on the overall tropospheric chem-istry can be assessed. The methane lifetime (average of 7.1 years based on 150 ppbv ozone-threshold tropopause) shows a small increase of about 13, 35 and 50 days in the experi-ment without anthropogenic, biomass burning and lightning emissions respectively, when compared to the reference ex-periment, while in the experiment where biogenic emissions are switched off, it decreases by only 32 days.
4 Model Evaluation
An extensive evaluation of the ECHAM5-MOZ model is de-scribed in Rast et al. (2007)2. In the ACCENT-IPCC sce-nario studies, ECHAM5-MOZ showed a high bias of about 20% in the global tropospheric ozone production and loss compared to the mean of all participating models (Steven-son et al., 2006). In terms of global dry deposition, it has a low bias of about 5%. Methane and CH3CCl3tropospheric
lifetimes are at the lower end of the currently accepted esti-mations (Prinn et al., 1995; Ehhalt et al., 2001). The surface ozone concentration is known to have a high bias in heav-ily polluted areas, such as industrial centres and large city agglomerations but also in the Mediterranean basin.
In this section we evaluate the ECHAM5-MOZ model over Africa and its surroundings, by comparing
model-Abidjan: DJF 0 20 40 60 80 100 120 O3 [ppbv] Pressure [hPa] 1000 900 800 700 600 500 400 300 200 100 Lagos: DJF 0 20 40 60 80 100 120 O3 [ppbv] Pressure [hPa] 1000 900 800 700 600 500 400 300 200 100 Cairo: DJF 0 20 40 60 80 100 120 O3 [ppbv] Pressure [hPa] 1000 900 800 700 600 500 400 300 200 100 Brazzaville: DJF 0 20 40 60 80 100 120 O3 [ppbv] Pressure [hPa] 1000 900 800 700 600 500 400 300 200 100 Windhoek: DJF 0 20 40 60 80 100 120 O3 [ppbv] Pressure [hPa] 1000 900 800 700 600 500 400 300 200 100 Johannesburg: DJF 0 20 40 60 80 100 120 O3 [ppbv] Pressure [hPa] 1000 900 800 700 600 500 400 300 200 100
Fig. 1. The comparison of 5-year averaged model simulated (open circles with line) and 1997–2002 mean MOZAIC (filled-squares) ozone
vertical profiles for Cairo (Egypt), Abidjan (Cote d’Ivoire), Lagos (Nigeria), Brazzaville (Congo), Windhoek (Namibia) and Johannesburg (South Africa) in December – February (DJF). The horizontal lines indicate ±1σ standard deviation. The figures also show the ozone enhancement due to each of the African biomass burning (red lines), biogenic (green lines), lightning (blue lines) and anthropogenic (dashed-black lines) emissions. The red, green, blue and dashed-(dashed-black lines represents the difference of ozone between the reference and the sensitivitivy experiments.
calculated trace species (O3 and CO) concentrations of our
reference experiment to measurements. Specifically this in-cludes: (1) a detailed comparison of ECHAM5-MOZ ver-tical ozone profiles with in-situ aircraft data of the Mea-surement of OZone and water vapour by Airbus In-service airCraft (MOZAIC) (Marenco et al., 1998; Thouret et al., 1998a,b, 2006; Zbinden et al., 2006); (2) a comparison of ECHAM5-MOZ ozone concentration time series over As-cension Island, Irene, Reunion and Nairobi with South-ern Hemisphere ADditional OZonesondes data (SHADOZ) (Thompson et al., 2003a,b), available at http://croc.gsfc.nasa. gov/shadoz/; and (3) a comparison of CO surface concen-tration calculated in ECHAM5-MOZ with the NOAA Earth Systems Research Laboratory Global Monitoring Division (NOAA/ESRL-GMD) CO data (Novelli et al., 1992, 1994,
1998b, 2003). Each of these comparisons is discussed be-low.
4.1 ECHAM5-MOZ comparison with MOZAIC ozone
data
The aircrafts of the MOZAIC programme sample vertical profiles of ozone concentration upon departure and arrival. These profiles have been used to evaluate ECHAM5-MOZ at six African airports: Cairo (Egypt), Abidjan (Cote d’Ivoire), Lagos (Nigeria), Brazzaville (Congo), Windhoek (Namibia) and Johannesburg (South Africa). MOZAIC data provides the first ozone climatology data covering major African cities, and these data were analysed by Sauvage et al. (2005). Figures 1 and 2 show the comparison of our reference simulation (open circles) to MOZAIC (filled squares) ozone
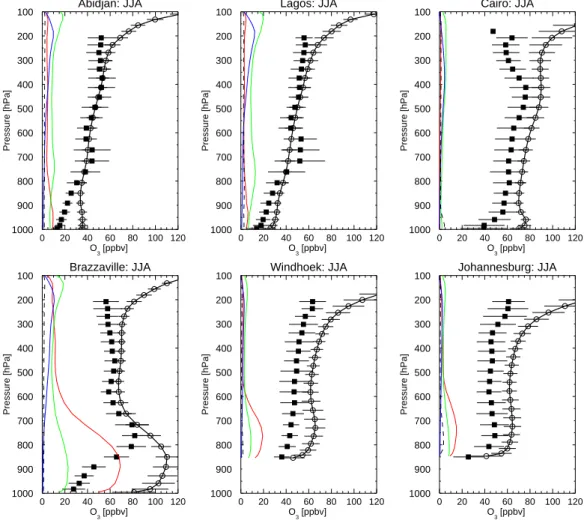
Abidjan: JJA 0 20 40 60 80 100 120 O3 [ppbv] Pressure [hPa] 1000 900 800 700 600 500 400 300 200 100 Lagos: JJA 0 20 40 60 80 100 120 O3 [ppbv] Pressure [hPa] 1000 900 800 700 600 500 400 300 200 100 Cairo: JJA 0 20 40 60 80 100 120 O3 [ppbv] Pressure [hPa] 1000 900 800 700 600 500 400 300 200 100 Brazzaville: JJA 0 20 40 60 80 100 120 O3 [ppbv] Pressure [hPa] 1000 900 800 700 600 500 400 300 200 100 Windhoek: JJA 0 20 40 60 80 100 120 O3 [ppbv] Pressure [hPa] 1000 900 800 700 600 500 400 300 200 100 Johannesburg: JJA 0 20 40 60 80 100 120 O3 [ppbv] Pressure [hPa] 1000 900 800 700 600 500 400 300 200 100
Fig. 2. Same as Fig. 1 but for June–August (JJA).
vertical profiles for these six stations in December–February (DJF), and June–August (JJA) respectively. MOZAIC data were averaged over the years 1997–2002. The ECHAM5-MOZ results do not reflect specific years but can be regarded as a 5-year climatology over the late 1990s. There are no measurements at Brazzaville airport in November and De-cember of years 1997–2002 (Sauvage et al., 2005). These figures also show the ozone enhancement due to biomass burning (red lines), biogenic (green), lightning (blue) and an-thropogenic (dashed-black lines) emissions.
The ECHAM5-MOZ model shows a reasonable level of agreement with the measurements in the free troposphere (750 hPa–350 hPa) at these six stations. The model bias is about 20 ppbv, except over Cairo, Windhoek and Johannes-burg in JJA, where the bias is up to 30 ppbv. During the dry season, i.e. DJF in Lagos and Abidjan, and JJA in Brazzav-ille, both model and measurements exhibit high ozone en-hancement below-650 hPa over Lagos, Abidjan and Brazzav-ille. This is connected with an increase in local emissions of ozone precursors due to an increase in biomass burning
ac-tivities in the vicinity of these stations (see Figs. 1 and 2). The reason why the ozone enhancement is limited to below-650 hPa is due to the high stability created by a combination of the Harmattan and the Saharan anticyclone, which pre-vents effective vertical mixing (Sauvage et al., 2005).
However, while the dry season maximum ozone
enhancement in the MOZAIC data occurs at 850–650 hPa, it is confined within the surface −800 hPa in the
ECHAM5-MOZ model. This causes ECHAM5-MOZ lower
tropo-spheric (surface–800 hPa) ozone concentrations to be highly biased during the dry season. For example, the surface ozone concentration is overestimated in ECHAM5-MOZ by about 35–50 ppbv and 50–100 ppbv over Lagos and Abidjan re-spectively in DJF, with the maximum bias occurring in De-cember at both stations. Over Brazzaville, the bias in sur-face ozone varies between 35–60 ppbv in JJA, with a max-imum overestimation in July. We identified three potential reasons for this dry season bias: (a) ECHAM5-MOZ under-estimates dry deposition during the dry seasons. As already stated above, the global dry deposition in ECHAM5-MOZ
Table 2. African emissions influence on the tropospheric ozone burden (Tg O3) of various geographical land regions. The results are the
difference of the 5-year averages from the base run and the sensitivity runs where each of the emission sources were switched off one at a time.
Biomass Biogenic Lightning Anthropogenic Tropospheric
Region burning O3burden
Africa 2.50 4.07 1.75 0.89 33.14 East Asiaa 0.12 0.31 0.15 0.09 11.33 Europe 0.09 0.24 0.09 0.09 14.25 Latin Americab 0.43 1.00 0.48 0.20 23.95 Middle Eastc 0.20 0.53 0.24 0.18 11.89 North-central Asiad 0.08 0.20 0.08 0.08 14.52 Oceaniae 0.26 0.57 0.30 0.14 09.99 South-central Asiaf 0.14 0.33 0.18 0.08 07.25 Southeast Asiag 0.18 0.43 0.25 0.08 09.78
United States and Canada 0.14 0.34 0.14 0.10 20.57
Global 9.52 19.59 8.06 4.67 384.32
aChina, Hong Kong, Japan, Democratic peoples Republic of Korea, Republic of Korea, Macau and Taiwan.
bSouth America, Mexico and the Caribbean Islands.
c Middle East countries include the western part of Afghanistan, Bahrain, Cyprus, Gaza strip, Iran, Iraq, Israel, Jordan, Kazakhstan,
Kuwait, Kyrgyzstan, Lebanon, Oman, Pakistan, Qatar, Saudi Arabia, Syrian Arab republic, Turkey, Turkmenistan, United Arab Emirates, Uzbekistan, West Bank and Yemen.
dRussia Federation and Mongolia.
eAustralia, New Zealand, Fijis, French Polynesia, Guam, New Caledonia, Niue, Samoa and Vanuatu.
fSouth-central Asia consist of India, Pakistan, Bangladesh, Sri-Lanka, Nepal, Maldives, Kashmir, Bhutan and the eastern Afghanistan.
gSoutheast Asia consist of Brunei, Cambodia, East timor, Laos, Vietnam, French Indo-China, Indonesia, Malaysia, Myanmar, Papua New
Guinea, Philippines, Singapore, Thailand.
is about 5% lower than the multi-model-average dry deposi-tion (Stevenson et al., 2006). (b) The lack of aerosols (espe-cially mineral dust) in ECHAM5-MOZ may also contribute to this bias. (c) The particular choice of the reaction con-stants and their temperature dependence in ECHAM5-MOZ is known to favour high ozone concentrations in the tropo-sphere (G. A. Folberth, personal communication, 2006). We have to point out that to fully unravel the extent of these rea-sons would be beyond the scope of this paper. The dry season bias in the lower troposphere will weakly influence the re-sults presented in this study since we are interested in differ-ences of concentrations between two simulations, however it will influence the absolute values of total tropospheric ozone burden calculated over the world regions in our reference ex-periment (see column 6 of Table 2).
The red lines in Fig. 1 show that the biomass-burning pre-cursors emitted over western Africa lead to an ozone en-hancement over central Africa in DJF, as shown by the ozone profile over Brazzaville. Figure 2 also shows the reverse in-fluence of central-African biomass burning on west-African ozone in JJA, but at a lesser amount (Abidjan and Lagos). This feature has previously been found by backward trajec-tories calculated in Sauvage et al. (2005).
Figures 1 and 2 show that African emissions have insignif-icant influence over Cairo. In November–April, lower
tro-pospheric ozone concentrations over Johannesburg are most sensitive to biogenic and anthropogenic emissions. At all stations except Cairo, we see a significant influence of bio-genic and lightning emissions on upper tropospheric ozone concentration, especially during the wet seasons.
4.2 ECHAM5-MOZ comparison with SHADOZ
ozonesonde data
We compare the monthly-mean time series of ozone oncen-tration calculated in ECHAM5-MOZ with SHADOZ data. Figure 3 shows this comparison over Ascension Island, Irene, Reunion and Nairobi at 300 hPa, 500 hPa and 800 hPa. Ozonesonde data have been collected at these four stations since 1998 till present (i.e. 2006). The SHADOZ data rep-resent a 1998–2004 monthly average, and for the model, the ozone concentrations are the 5-year monthly average of the reference simulations.
The agreement with the SHADOZ measurements is gen-erally good at all stations and vertical levels. The simulated values show a smaller variability (i.e. standard deviation) over the 5-year period than the measurements which repre-sent mean values over 7 years. The seasonal cycle is well captured at most stations and vertical levels, both in ampli-tude and phase. Nevertheless, there are some deviations of
Ascension: 300hPa 0 2 4 6 8 10 12 months O3 [ppbv] 0 20 40 60 80 100 120 140 Irene: 300hPa 0 2 4 6 8 10 12 months O3 [ppbv] 0 20 40 60 80 100 120 140 Reunion: 300hPa 0 2 4 6 8 10 12 months O3 [ppbv] 0 20 40 60 80 100 120 140 Nairobi: 300hPa 0 2 4 6 8 10 12 months O3 [ppbv] 0 20 40 60 80 100 120 140 Ascension: 500hPa 0 2 4 6 8 10 12 months O3 [ppbv] 0 20 40 60 80 100 120 140 Irene: 500hPa 0 2 4 6 8 10 12 months O3 [ppbv] 0 20 40 60 80 100 120 140 Reunion: 500hPa 0 2 4 6 8 10 12 months O3 [ppbv] 0 20 40 60 80 100 120 140 Nairobi: 500hPa 0 2 4 6 8 10 12 months O3 [ppbv] 0 20 40 60 80 100 120 140 Ascension: 800hPa 0 2 4 6 8 10 12 months O3 [ppbv] 0 20 40 60 80 100 120 140 Irene: 800hPa 0 2 4 6 8 10 12 months O3 [ppbv] 0 20 40 60 80 100 120 140 Reunion: 800hPa 0 2 4 6 8 10 12 months O3 [ppbv] 0 20 40 60 80 100 120 140 Nairobi: 800hPa 0 2 4 6 8 10 12 months O3 [ppbv] 0 20 40 60 80 100 120 140
Fig. 3. The comparison of 5-year mean ECHAM5-MOZ model (open-circles) and 1998–2004 mean SHADOZ data (filled-squares) of ozone
concentration (in ppbv) over Ascension, Irene, Reunion and Nairobi at 300 hPa (top), 500 hPa (middle), and 800 hPa (bottom).
the model from the measurements in the lower troposphere. At 800 hPa (Fig. 3, bottom panel), the model shows an over-estimation of the ozone concentration of about 15 ppbv at Reunion in June and July. At Irene and Nairobi, this overes-timation reaches 20 ppbv in some months. On the other hand, the model underestimates the ozone concentration over As-cension throughout the year.
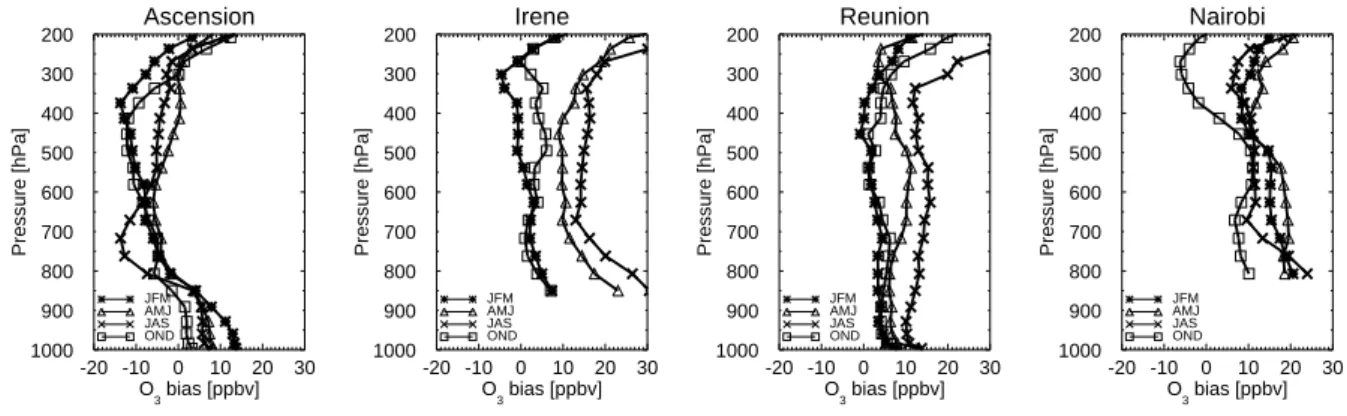
In Fig. 4, we show the seasonal (JFM, AMJ, JAS, OND) bias of the ECHAM5-MOZ model when compared with SHADOZ data at Ascension Island, Irene, Reunion and Nairobi. The bias is generally lower than 20 ppbv, except at Irene in AMJ and JAS and Nairobi in JAS. Interestingly, these months represent the dry seasons at Irene and Nairobi, thereby confirming that the ECHAM5-MOZ model has a bias higher than 20 ppbv during the dry season, which may be linked to the reasons stated earlier.
4.3 ECHAM5-MOZ comparison with NOAA/ESRL-GMD
surface CO concentrations data
NOAA/ESRL-GMD has collected CO data since the 1990s (Novelli et al., 1992, 1994, 1998b, 2003). These data have been used to provide a better understanding of the CO global distribution (Novelli et al., 1992, 1998b), the CO budget and trends (Novelli et al., 1994, 1998a, 2003; Granier et al., 1996,
1999; Holloway et al., 2000), and were also used to validate measurements of CO made from space (Novelli et al., 1998a; Reichle et al., 1999).
We compare CO surface concentrations calculated in ECHAM5-MOZ with 9 stations from the NOAA/ESRL-GMD CO data. These stations include 1 continental African station (Assekrem), 1 maritime African station (Mahe Island) and 7 stations downwind of Africa (see Fig. 5 for the station names and coordinates).
Figure 5 shows that the model captured the seasonal varia-tion of surface CO concentravaria-tion at most of the stavaria-tions, and in particular in the southern hemisphere (i.e. Ascension Is-land, Mahe IsIs-land, Crozet Island and Syowa). At the sta-tions north of the equator (i.e. Ragged Point, Terceira Is-land, Tenerife, Assekrem and Sede Boker), ECHAM5-MOZ underestimates the surface CO concentration, especially in January–May.
The inter-annual variability of the simulated surface CO concentration (error bars in Fig. 5) is generally lower than that of the measurements. This may be related to inter-annual variations in emissions, which are not included in the model since the same monthly-mean emissions are prescribed in each of the simulation years.
Ascension -20 -10 0 10 20 30 O 3 bias [ppbv] Pressure [hPa] 1000 900 800 700 600 500 400 300 200 JFM AMJ JAS OND Irene -20 -10 0 10 20 30 O 3 bias [ppbv] Pressure [hPa] 1000 900 800 700 600 500 400 300 200 JFM AMJ JAS OND Reunion -20 -10 0 10 20 30 O 3 bias [ppbv] Pressure [hPa] 1000 900 800 700 600 500 400 300 200 JFM AMJ JAS OND Nairobi -20 -10 0 10 20 30 O 3 bias [ppbv] Pressure [hPa] 1000 900 800 700 600 500 400 300 200 JFM AMJ JAS OND
Fig. 4. The vertical profile of the seasonal mean model bias (i.e. the difference of ECHAM5-MOZ and SHADOZ) over Ascension Island,
Irene, Reunion and Nairobi.
Fig. 5. Monthly mean surface CO concentrations in ECHAM5-MOZ (open circles) compared to NOAA/ESRL-GMD CO (filled squares) at
Terceira Island (Azores), Sede Boker (Negev desert, Israel), Tenerife (Canary Island), Assekrem (Algeria), Ragged Point (Barbados), Mahe Island (Seychelles), Ascension Island, Crozet Islands and Syowa (Antarctica). Error bars denote the inter-annual variations in both model and measurements.
Fig. 6. The influence of African biomass burning on 5-year DJF and JJA average of the surface ozone concentrations. The figures show the
difference between the reference experiment and the experiment where biomass burning emissions are excluded.
Fig. 7. The influence of African biogenic emissions on 5-year DJF and JJA average of the surface ozone concentrations. The figures show
the difference between the reference experiment and the experiment where biogenic emissions are excluded.
5 The influence of African emissions
In Sects. 5.1 and 5.2, we discuss the impact of African emis-sions on the photochemical ozone production over Africa and globally. The analysis focuses on the impact of emissions on surface ozone concentrations and tropospheric ozone bur-den (TOB). The seasonality and inter-annual variability of the ozone burden is described in Sects. 5.3 and 5.4 respec-tively. We present some estimates of the uncertainty in our results in Sect. 5.5.
5.1 The effect of African emissions on surface ozone The effect of African biomass burning, biogenic and anthro-pogenic emissions on surface ozone is shown in Figs. 6, 7 and 8 respectively. The figures show the difference in the sim-ulated surface ozone concentrations between the reference experiment and the experiment where each of the emission
types were excluded. Lightning has a small impact on sur-face ozone concentration, and only accounts for a maximum of 1 ppbv over a small area in Africa, and is therefore not presented.
The enhancement of the surface ozone concentrations dur-ing the biomass burndur-ing seasons (DJF and JJA) generally lies between 10–50 ppbv at the burning region (Fig. 6), but can reach 60 ppbv in JJA over large parts of Democratic Re-public of Congo and Angola. In DJF, there is a significant enhancement of the surface ozone concentrations over the equatorial Atlantic, reaching farther to the northeastern part of Brazil. About 1–2 ppbv surface ozone increase due to African biomass burning emissions in JJA as well as Septem-ber to NovemSeptem-ber (SON), can be found over the southern At-lantic, Indian and Pacific oceans.
The influence of biogenic emissions on surface ozone con-centration over Africa is lower than that of biomass burning
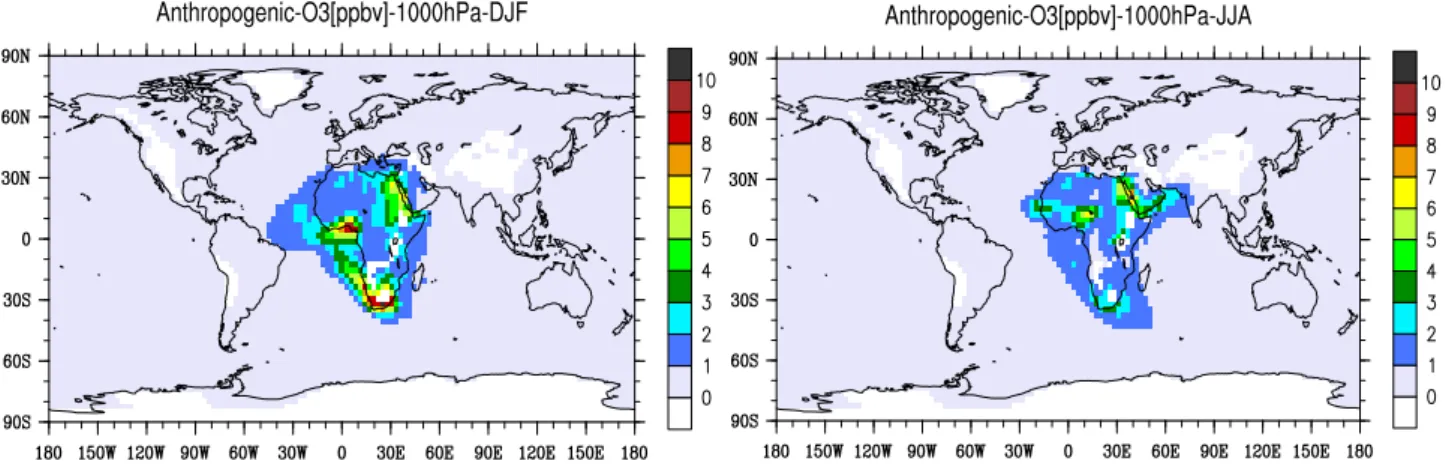
Fig. 8. The influence of African anthropogenic emissions on 5-year DJF and JJA average of surface ozone concentrations. The figures show
the difference between the reference experiment and the experiment where anthropogenic emissions are excluded. Note that the scale is reduced from those of Figs. 6 and 7.
emissions in DJF and JJA (Fig. 7) in the burning regions. The highest enhancement during these 2 seasons is about 30 ppbv. However, while biomass burning surface ozone en-hancement is confined to SH Africa in JJA, the influence of biogenic emissions covers both hemispheres. African bio-genic emissions enhance the SH ocean surface ozone con-centration by about 1–2 ppbv in all season.
The surface ozone produced by African anthropogenic emissions (Fig. 8) shows that Nigeria, South-Africa and Egypt are the countries mainly affected by anthropogenic emissions (up to 10 ppbv). These three countries together account for about 35%, 53% and 37% of the total African anthropogenic CO, NOxand NMHC emissions respectively.
This effect therefore corresponds to the relatively high con-tribution of these countries to the anthropogenic emissions.
The relative importance of each of the African emis-sion categories to surface ozone concentration over Africa thus depends on the season and the location. For example, biomass burning emissions have the largest influence in the burning regions during the dry season. Whereas, over most of the Saharan desert (i.e. north of Sahel), the surface ozone concentration is enhanced mainly by anthropogenic and bio-genic emissions.
5.2 The influence of African emissions on the tropospheric ozone burden
We calculate the burden ms of a species s in any
three-dimensional subdomain D of the atmosphere describing a
particular region, e.g. troposphere over Africa, as:
ms = X j 1P (j ) A(j ) g γs(j ) χD(j ) (1) where
1P (j ) : absolute values of the difference between the pressure at the upper and lower boundary of the grid box j
A(j ) : area of grid box j
g : earth acceleration
γs(j ): mass mixing ratio of species s in grid box j
χD(j ) : characteristics function of subdomainD. It is
1 if the grid box j lies inD, otherwise it is 0.
For the purpose of this study, the tropopause is defined as the pressure level at which the ozone concentrations are greater than or equal to 150 ppbv. The TOB discussed in this section and in subsequent sections are calculated using Eq. (1).
The TOB calculated from the reference experiment for various world regions are shown in the last column of Ta-ble 2. Our estimate of 33 Tg TOB over Africa is higher than the 26 Tg reported by Marufu et al. (2000) using the Tracer Model version 3 (TM3), mostly due to the dry season overestimation of lower tropospheric ozone concentration in ECHAM5-MOZ.
The net influence of each of the African emissions on the regional and global TOB is shown in columns 2 through 5 of Table 2. African biomass burning, biogenic, light-ning and anthropogenic emissions account for about 9.5 Tg, 19.6 Tg, 8.0 Tg and 4.7 Tg of the global TOB respectively. Over Africa itself, the net influence of each of these emis-sion types is only 2.5 Tg, 4.1 Tg, 1.75 Tg and 0.9 Tg re-spectively. This indicates that more than 70% of the tro-pospheric ozone produced by photochemical reactions in-volving African emissions is found outside the continent due to the transport of precursor species and ozone itself. The largest ozone enhancement is confined to the south Atlantic and Indian oceans. Our calculated value of 9.5 Tg of ozone due to African biomass burning emissions is in good agree-ment with the 10 Tg suggested in a marked tracer experiagree-ment described in Marufu et al. (2000).
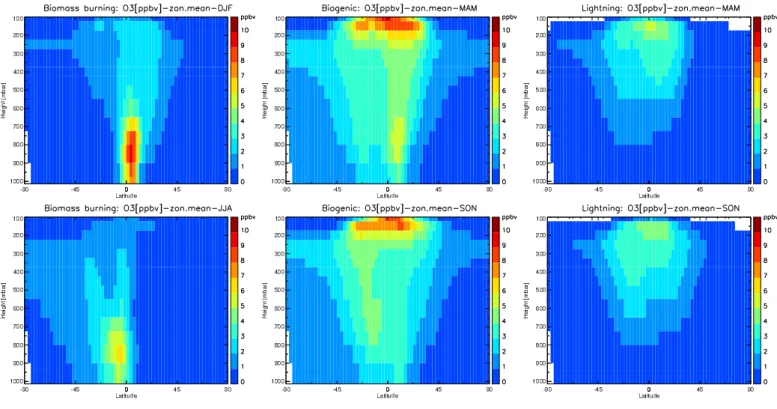
Fig. 9. 5-year zonal average of the ozone concentration (ppbv) produced by African biomass burning (left column), biogenic (middle
column) and lightning (right column) emissions. The seasons with highest ozone enhancement are shown. These are DJF and JJA for Biomass burning; and MAM and SON for biogenic and lightning emissions.
Figure 9 shows the vertical profiles of the zonal average ozone concentrations produced by African biomass burning, biogenic and lightning emissions as the difference between our reference run and the respective sensitivity simulation. The two seasons shown for each emission source are those with the maximum impact of each of the emission types. These are DJF and JJA for biomass burning, and MAM and SON for biogenic and lightning emissions. The plots show 5-year averages. The impact of African lightning emission on ozone production is highest at the middle to the upper tro-posphere (as shown in the right column of Fig. 9).
A striking feature in Fig. 9 (middle column) is that al-though biogenic emissions are released into the troposphere at the top of the vegetation canopy (as in the case of bio-genic NMVOC) and at the surface (as in the case of soil emissions), relatively large ozone increases are seen in the upper troposphere (between 300 hPa and 100 hPa). This may be due to the combined effect of strong convective activity in the main source region of the emissions (Collins et al., 1999; Lawrence et al., 2003; von Kuhlmann et al., 2004), the transport of biogenic NMVOC with relatively long chemical lifetime, such as methanol (Tie et al., 2003), and the effec-tive storage of NOxas peroxy acetyl nitrate (PAN) (Fig. 10).
Upon sinking of air masses containing these compounds, PAN is thermally decomposed and it releases NOxand
per-oxy radicals, which contribute to ozone formation. Figure 10
also shows a relatively higher CO concentration enhance-ment in the middle to upper troposphere from biogenic emis-sions than biomass burning emisemis-sions.
In order to estimate the direct effect of African biogenic CH3OH, isoprene and terpene emissions on these
concen-tration enhancements, we performed 3 additional sensitivity experiments for 1 year after a spin-up period of 6 months. In each of these experiments, we exclude only one of these emissions, respectively. Together, these emissions account for 96% of the biogenic NMVOC used for this study. The results show that a maximum of 65% and 15% of the upper troposphere (UT) ozone enhancement are due to African iso-prene and biogenic CH3OH emissions, whereas the influence
of terpenes is negligible. Therefore, the combined effect of the convective transport of biogenic methanol and isoprene, and their reaction products increases the UT ozone (Tie et al., 2003; Doherty et al., 2005).
Globally and over the continental regions outside Africa, the influence of African biogenic emissions on the tropo-spheric ozone burden is about two times that of biomass burning (as shown in Table 2), making them the most im-portant African emissions category. This is due to the bio-genic emissions enhancement of the ozone concentration in the middle to the upper troposphere (Fig. 9), where ozone and ozone precursors are easily transported over large dis-tances. The largest influence of each of the African emission
Fig. 10. 5-year zonal average of the CO, NOxand peroxy acetyl nitrate (PAN) concentration produced by African biomass burning (top row)
and biogenic (bottom row) emissions.
Fig. 11. The influence of African emissions on (a) African and (b) global tropospheric ozone burden (Tg O3). Figure shows 5-year average. Note the difference in the scales.
categories on TOB of other continental regions occurs in Latin America, followed by Oceania, the Middle East, South-east and South-central Asia, the United States and Canada, Europe and North-central Asia (Table 2).
5.3 Seasonality of the influence of African emissions on the regional and global tropospheric ozone burden In Fig. 11a, we show the seasonal variation of the impact of African emissions on the TOB over Africa. The sea-sonal variation of the tropospheric ozone burden produced by African biomass burning emissions (red line) shows two peaks. The first peak occurs between December and Febru-ary, while the second peak occurs in July, with a spread from
Fig. 12. The 5-year average tropospheric ozone column (DU) produced by Africa lightning NOxemissions in DJF, MAM, JJA and SON;
overlaid with streamlines at 250 hPa during the same seasons. The streamlines is generated by the u and v wind vectors of the reference simulations. The tropospheric ozone column is the difference of the ozone column between the reference simulation and the simulation without African lightning emissions.
June to September. This seasonality shows a high correla-tion with biomass burning emissions (r=0.85, 0.88 and 0.93 for biomass burning NMHC, CO and NOxrespectively),
re-flecting the DJF and JJA burning seasons in the NH and SH parts of Africa, respectively. During these peaks, the influ-ence of African biomass burning emissions on African TOB is about 3.4 Tg in January and 3.0 Tg in July. The seasonal variation in African TOB due to African biogenic emissions also shows a peak in May (green line in Fig. 11a) reach-ing 4.8 Tg. Lightnreach-ing emissions over Africa yield the max-imum influence on the tropospheric ozone production over the continent in two major seasons: March through May, and September through October; accounting for about 2.1 Tg re-spectively (blue line in Fig. 11a).
As shown in Fig. 11, African and global TOB is most sen-sitive to biogenic emissions in all seasons. The two months of maximum influence of biogenic emissions on global TOB are May and November, when they account for a net TOB of 21 Tg. The highest isoprene emissions over Africa oc-cur in April and October, while those of biogenic CH3OH
occur in May and October. The seasonal variation of the global TOB produced by African biomass burning (red line in Fig. 11b) shows two peaks in December through February and in September. The maximum values are about 11.5 Tg and 12 Tg, in February and September respectively. African lightning emissions yield their maximum influence on global TOB in April and October. During these months, their im-pact can be up to 10 Tg and 11 Tg, respectively. As shown by the black lines in Fig. 11, the TOB produced by African anthropogenic emissions show a small seasonal variation.
The seasonality of the influence of African emissions on each of the world regions shown in Table 2 reveal that the maximum influence of biomass burning emissions occurs in December–March except over Oceania, where the max-imum influence occurs in September–October. It turns out that burning in both hemispheres of Africa influences Latin America TOB. The maximum influence of biogenic, light-ning and anthropogenic emissions on TOB over Oceania, the Middle East, Southeast and South Central Asia, and East Asia occurs generally in March–June and September–
Table 3. Inter-annual variability of the tropospheric ozone burden produced by each of the African emission categories. The entries show
the mean absolute bias in percent for various geographical land regions.
Region Biomass burning Biogenic Lightning Anthropogenic
Africa 2.4 2.3 4.9 2.1 East Asia 6.9 3.4 6.4 3.7 Europe 5.6 3.0 5.5 6.4 Latin America 4.2 3.9 6.8 3.5 Middle East 6.6 4.8 4.9 0.4 North-central Asia 7.5 3.9 5.5 4.9 Oceania 3.9 2.9 6.4 1.9 South-Central Asia 6.1 2.8 4.5 1.3 Southeast Asia 16.2 12.5 18.8 11.2
United States and Canada 7.2 3.5 5.6 4.3
Global 3.0 2.0 5.9 2.0
December, except over Latin America, where it occured in June–September. These seasonalities reveal the combina-tion of seasonal variacombina-tion in emissions and a seasonal shift in transport pathways out of the emission source regions. This is demonstrated in the example of Fig. 12, where the spa-tial distribution of the total tropospheric ozone column in-crease due to African lightning emissions corresponds to the tranport pathways at 250 hPa in all seasons, as shown by the streamlines. The altitude of 250 hPa for the streamlines was chosen, because this is near the region of maximum NOx
out-flow in thunderstorms. 5.4 Inter-annual variability
Previous studies on the effect of African emissions on tro-pospheric ozone have always focused on one specific me-teorological year. The authors are not aware of any study conducted over several years. Here we investigate the im-pact of changes in meteorology by analysing the inter-annual variability in our 5-years simulations. All emissions were held constant over the 5-years, but lightning emissions vary according to changes in convective activity.
We give the inter-annual variability calculated as the av-erage deviation relative to the mean results in Table 3. Gen-erally, the highest inter-annual variability (more than 11%) is calculated over southeast Asia, while the smallest inter-annual variability (less than 5%) is recorded over Africa for all the emission categories, for all other region, the inter-annual variability of the transport from Africa is less than 10%. Globally, the variability is about 3.0%, 2.0%, 5.9% and 2.0% for global tropospheric ozone burden generated by African biomass burning, biogenic, lightning and anthro-pogenic emissions respectively.
African emissions influence tropospheric ozone over Southeast Asia throughout the year, with maximum impact in March–April and October–December. This influence is dominated by biogenic and lightning emissions, which
to-gether account for about 77% of the TOB related to African emissions over Southeast Asia. The high interannual vari-ability recorded over southeast Asia is driven by the partic-ularly low and high transport from Africa to Southeast Asia in the third year and the fifth year of our simulation period, which causes the TOB over Southeast Asia to be about 18– 34% lower and 25–40% higher than the 5-year mean TOB, respectively. This decrease and increase in transport is con-nected with the cold and warm anomaly in the sea surface temperature in these years, respectively (see Fig. 13). This warm (or cold) anomaly has been shown to induce a weak-ening (or strengthweak-ening) of the tropical easterly jet (Palmer et al., 1992; Janicot et al., 2001). The analysis of the streamline anomaly (figures not shown) at 100 to 500 hPa reveals that the transport from Africa to Southeast Asia is enhanced (or reduced) when a warm (or cold) SST anomaly occurs. 5.5 Uncertainties
Simulations of the global tropospheric ozone budget are still rather uncertain; nevertheless, most models show rather good consistency in simulating the response to emission changes (Stevenson et al., 2006). There are large uncertainties in emission estimates, and these uncertainties will influence our results both in terms of absolute values and with respect to the relative importance of emission source types. While we cannot give a thorough discussion of the uncertainties here, we will at least discuss the potential impact of emission un-certainties on our ozone budget calculations assuming a lin-ear response for simplicity.
African biomass burning emissions are uncertain by about a factor of 2 (Schultz et al., 2006)1. Some of this uncertainty may be related to inter-annual variability of these emissions (e.g. see, Barbosa et al., 1999), but since we do not take this variability into account in our model simulations, we can re-gard it as the uncertainty of the mean value here. Thus the in-fluence of African biomass burning emissions on the global
Fig. 13. The sea surface temperature (SST) anomaly in the third and the fifth year of the simulation period, with respect to the 5-year average
SST.
tropospheric ozone burden could range from 4.5 Tg (O3)to
19 Tg (O3).
The uncertainty of global isoprene emissions reported by Guenther et al. (2006) is about a factor of 3, and about the same uncertainty factor is noted for global methanol emis-sions in Tie et al. (2003). However, the uncertainty of the bio-genic emissions e.g. isoprene, for a specific location and time in Africa could be up to a factor of 5 (Guenther et al., 1999). Hence the influence of African biogenic emissions on global tropospheric ozone burden could range from 6.5 Tg (O3)to
59 Tg (O3).
The uncertainty of global lightning emissions has been briefly discussed in Sect. 1. While there is a growing consen-sus that the upper limit estimate of 20 Tg (N) yr−1is likely
too high (Lawrence et al., 1995; Labrador et al., 2005) , there still remains at least an uncertainty of a factor of 3. Our esti-mate of 2.7 Tg (N) yr−1is closer to the lower limit. We there-fore estimate the global tropospheric ozone burden related to African lightning NOx source as 6 Tg (O3)–30 Tg (O3) for
global lightning NOxemissions ranging from 2 Tg (N) yr−1–
10 Tg (N) yr−1.
Anthropogenic emissions are also uncertain by at least 30%, but regional uncertainties may be much larger, in par-ticular for domestic burning. We estimate that the impact of African anthropogenic emissions on the global TOB may be between 3 and 6 Tg (O3)yr−1. All together, the influence of
African emissions on the global TOB may range from 20 and 114 Tg (N)/yr (representing 5–30% of the global TOB).
6 Summary and conclusions
We have discussed the effect of African emissions, namely: biomass burning, biogenic, lightning and anthropogenic emissions on the tropospheric ozone over Africa and in other regions of the world, using the new 3-D global atmospheric
chemistry model, ECHAM5-MOZ. We gave an overall de-scription of the model and presented a model evaluation for the region around Africa by comparing the ozone and CO concentration calculated by ECHAM5-MOZ to mea-surements at various stations. Generally ECHAM5-MOZ captures the vertical and seasonal variation of the tropo-spheric ozone over Africa, except that it has some high bi-ases and overestimates the dry seasons lower tropospheric ozone concentration by more than 30 ppbv. In all other months and at all locations, the ECHAM5-MOZ ozone bias is less than 30 ppbv everywhere in the troposphere up to 300 hPa. Interestingly, the ECHAM5-MOZ model confirms that biomass burning emissions occuring in West Africa in DJF cause lower tropospheric ozone enhancement in central Africa, with a reverse effect on western Africa during the central African burning season in JJA (Sauvage et al., 2005). ECHAM5-MOZ is also able to simulate the seasonal varia-tion and magnitude of the surface CO concentravaria-tion at all the stations discussed.
We have shown that African biomass burning emissions are responsible for regional surface ozone enhancement of about 10–50 ppbv close to the burning regions. This sur-face ozone enhancement can even be more than 50 ppbv over parts of central Africa (Democratic republic of Congo, Congo and Angola) during the JJA biomass burning season. Biogenic emissions increase the surface ozone concentration over Africa by about 5–30 ppbv. Lightning is shown to have an insignificant impact on surface ozone, but leads to the sec-ond largest impact on the middle to the upper tropospheric ozone concentration, next to biogenic emissions. The rela-tive importance of biomass burning and biogenic emissions on the surface ozone concentration over Africa is highly de-pendent on the season and the location. Biomass burning provides the largest impact on surface ozone concentration only during the burning seasons in the vicinity of the burning
region. The Sahara desert surface ozone concentration is mainly influenced by anthropogenic and biogenic emissions. Biogenic, biomass burning, lightning and anthropogenic emissions over Africa account for an increase of the net global tropospheric ozone burden of about 19.6 Tg (6.5– 60 Tg), 9.5 Tg (4.5–19 Tg), 8.0 Tg (6–30 Tg), and 4.7 Tg (3– 6 Tg) respectively. The influence of these emissions on the African tropospheric ozone burden is about 4.1 Tg, 2.5 Tg, 1.8 Tg and 0.9 Tg, respectively. Therefore, this study shows that more than 70% of the tropospheric ozone produced by each of the African emission categories is found outside the continent.
We have also estimated the impact of biogenic, biomass burning, lightning and anthropogenic emissions on the tro-pospheric ozone burden of various world regions. We found that for all emission categories, Latin America experiences the highest impact of African emissions, followed by Ocea-nia, the Middle East, Southeast and South-central Asia. This is in effect due to the proximity of these regions to Africa. The tropospheric ozone over Canada, the United States, Northern Asia and Europe are only slightly affected by African emissions. This study shows a teleconnection of the sea surface temperature anomaly over the eastern trop-ical Pacific and the transport from Africa over the central Indian Ocean to Southeast Asia. Specifically, that warm (or cold) SST anomaly increases (or reduces) transport to Southeastern Asia due to the weakening (or strengthening) of the tropical easterly jet (Palmer et al., 1992; Janicot et al., 2001). In all continental regions outside of Africa, African biogenic emissions have the largest influence on the tropo-spheric ozone burden, followed by African lightning and biomass burning emissions.
This study presents a discussion of the main African emis-sion categories and their influence on regional and global tro-pospheric ozone. An earlier study by Marufu et al. (2000) focused on the determination of the source of tropospheric ozone over Africa, with a priority given to biomass burn-ing emissions. Interestburn-ingly, our estimate of 9.52 Tg due to African biomass burning emissions is comparable to the 10 Tg estimated by Marufu et al. (2000).
Acknowledgements. This work has been sponsored by the ZEIT
foundation. S. Rast and M. Schultz acknowledge partial
fund-ing from the RETRO project (EVK2-CT-00170). We
acknowl-edge the MOZAIC data, made possible by the support of the Eu-ropean Commission, Airbus, CNRS-France, FZJ-Germany and the airlines (Lufthansa, Air France, Austrian and former Sabena, who carry the MOZAIC instrumentation free of charge since the com-mencement of the campaign in 1994). We are grateful to M. Esch, U. Schulzweida and Hui Wan for their technical assistance. We also appreciate the comments of J. Feichter, M. A. Pfeffer and H. Wan. We are grateful for the valuable comments of M. Lawrence and the anonymous referee, which have substantially improve this manuscript. The model runs were performed on the NEC SX-6 computer at the German Climate Computing Centre (“Deutsches Klimarechenzentrum” (DKRZ)).
Edited by: P. Monks
References
Amann, M., Bertok, I., Cofala, J., Gyarfas, F., Heyes, C., Klimont, Z., Makowski, M., Sch¨opp, W., and Syri, S.: Cost-effective Control of Acidification and Ground-Level Ozone, Seventh In-terim Report, International Institute for Applied Systems Analy-sis (IIASA), Laxenburg, Austria, 1999.
Andreae, M. O.: Biomass burning: Its history, use, and distribution and its impact on environmental quality and global climate, in: Global Biomass Burning, edited by: Levine, J. S., MIT Press, Cambridge, Massachusetts, pp. 121, 1991.
Andreae, M. O.: The influence of tropical biomass burning on cli-mate and the atmospheric environment, in: Biogeochemistry of Global Change: Radiatively Active Trace Gases, edited by: R. S. Oremland, Chapman and Hall, New York, 113–150, 1993. Asselin, R.: Frequency filter for time integrations, Mon. Wea. Rev.,
100, 487–490, 1972.
Aviation and the Global Atmosphere: A Special Report of IPCC Working Groups I and III in collaboration with the Scientific As-sessment Panel to the Montreal Protocol on Substances that De-plete the Ozone Layer, edited by: Penner, J. E., Lister, D. H., Griggs, D. J., Dokken, D. J., and McFarland, M., Cambridge University Press, UK, pp. 373, 1999.
Barbosa, P. M., Stroppiana, D., Gr´egoire, J.-M., and Pereira, J. M. C.: An assessment of vegetation fire in Africa (1981–1991): Burned area, burned biomass, and atmospheric emissions, Global Biogeochem. Cycles, 13, 933–950, 1999.
Collins, W. J., Stevenson, D. S., Johnson, C. E., and Derwent, R. G.: Role of convection in determining the budget of odd hydrogen in the upper troposphere, J. Geophys. Res., 104(D21), 26 927– 26 942, doi:10.1029/1999JD900143, 1999.
Christian, H. J., Blakeslee, R. J., and Goodman, S. J.: The Detec-tion of Lightning from GeostaDetec-tionary Orbit, J. Geophys. Res., 94, 13 329–13 337, 1989.
Christian, H. J., Blakeslee, R. J., and Goodman, S. J.: Lightning Imaging Sensor (LIS) for the Earth Observing System, NASA Technical Memorandum 4350, MSFC, Huntsville, AL, February, 1992.
Crutzen, P. J., Heidt, L. E., Krasnec, W. H., and Seiler, W.: Biomass
burning as a source of atmospheric trace gases CO, H2, N2O,
NO, CH3Cl and COS, Nature, 282, 253–256, 1979.
Crutzen, P. J. and Andreae, M. O.: Biomass burning in the trop-ics: Impact on atmospheric chemistry and biogeochemical cy-cles, Science, 150, 1669–1678, 1990.
DeCaria, A. J., Pickering, K. E., Stenchikov, G. L., Scala, J. R., Stith, J. L., Dye, J. E., Ridley, B. A., and Laroche P.: A
cloud-scale model study of lightning-generated NOx in an
individ-ual thunderstorm during STERAO-A, J. Geophys. Res., 105, 11 601–11 616, 2000.
DeCaria, A. J., Pickering, K. E., Stenchikov, G. L. , and Ott,
L. E.: Lightning-generated NOx and its impact on
tropo-spheric ozone production: A three-dimensional modeling study of a Stratosphere-Troposphere Experiment: Radiation, Aerosols and Ozone (STERAO-A) thunderstorm, J. Geophys. Res., 110, D14303, doi:10.1029/2004JD005556, 2005.
Dentener, F., Stevenson, D., Cofala, J., et al.: The impact of air pollutant and methane emission controls on tropospheric ozone
and radiative forcing: CTM calculations for the period 1990– 2030 Atmos. Chem. Phys., 5, 1731–1755, 2005,
http://www.atmos-chem-phys.net/5/1731/2005/.
Desqueyroux, H., Pujet, J. C., Prosper, M., Squinazi, F., and Mo-mas, I.: Short-term effects of low-level air pollution on respira-tory health of adults suffering from moderate to severe asthma, Environ. Res., 89, 29–37, 2002
Doherty, R. M., Stevenson, D. S., Collins, W. J., and Sanderson, M. G.: Influence of convective transport on tropospheric ozone and its precursors in a chemistry-climate model, Atmos. Chem. Phys., 5, 3205–3318, 2005,
http://www.atmos-chem-phys.net/5/3205/2005/.
Ehhalt, D., Prather, M., Dentener F., et al.: Atmospheric chemistry and greenhouse gases, in Climate Change 2001: The Scientific Basis, Contribution of Working Group I to the Third Assessment Report of the Intergovernmental Panel on Climate Change, Cam-bridge University Press, New York, 239–288, 2001.
Fehsenfeld, F., Calvert, J., Fall, R., Goldan, P., Guenther, A. B., He-witt, C. N, Lamb, B., Liu, S., Trainer, M., Westberg, H., and Zim-merman, P.: Emissions of volatile organic compounds from veg-etation and the implications for atmospheric chemistry, Global Biogeochem. Cycles, 6(4), 389–430, 1992.
Ganzeveld, L.: Surface-Atmosphere Trace Gas and Aerosol Ex-changes on the Global Scale, PhD thesis, University of Utrecht, The Netherlands, 2001.
Gates, W. L., Boyle, J. S., Covey, C., Dease, C. G., Doutriaux, C. M., et al.: An Overview of the Results of the Atmospheric Model Intercomparison Project (AMIP I), Bull. Amer. Meteorol. Soc., 80(1), pp. 2955, 1999.
Granier, C., M¨uller, J.-F., Madronich, S., and Brasseur, G. P.: Possi-ble causes of the 1990 – 1993 decrease in the global tropospheric CO abundance: A three dimensional sensitivity study, Atmos. Environ., 30, 1673–1682, 1996.
Granier, C., M¨uller, J.-F., P´etron, G., and Brasseur, G.: A three-dimensional study of the global CO budget, Chemosphere Global Change Sci., 1, 255–261, 1999.
Grewe, V., Brunner, D., Dameris, M., Grenfell, J. L., Hein, R., Shin-dell, D., and Staehelin, J.: Origin and variability of upper tro-pospheric nitrogen oxides and ozone at northern mid-latitudes, Atmos. Environ. 35, 3421–3433, 2001.
Guenther, A., Hewitt, C. N., Erickson, D., Fall, R., Geron, C., Graedel, T., Harley, P., Klinger, L., Lerdau, M., Mckay, W. A., Pierce, T., Scholes, B., Steinbrecher, R., Tallamraju, R., Tay-lor, J., and Zimmerman, P.: A global model of natural volatile or-ganic compound emissions, J. Geophys. Res.-Atmos., 100(D5), 8873–8892, 1995.
Guenther, A., Baugh, B., Brasseur, G., Greenberg, J., Harley, P., Klinger, L., Serca, D., and Vierling, L.: Isoprene emission es-timates and uncertainties for the Central African EXPRESSO study domain, J. Geophys. Res., 104(30), 625–639, 1999. Guenther, A., Karl, T., Harley, P., Wiedinmyer, C., Palmer, P. I,
and Geron, C.: Estimates of global terrestrial isoprene emissions using MEGAN (Model of Emissions of Gases and Aerosols from Nature), Atmos. Chem. Phys., 6, 3181–3210, 2006,
http://www.atmos-chem-phys.net/6/3181/2006/.
Hansen, J., Sato, M., Nazarenko, L., Ruedy, R., et al.: Climate forc-ings in GISS SI2000 simulations, J. Geophys. Res. 107, 4347, doi:10.1029/2001JD001143, 2002.
Helas, G., Lacaux, J. P., Delmas, R., Scharffe, D., Lobert, J.,
Goldammer, J., and Andreae, M. O.: Ozone as biomass burning product over Africa, Fresenius Environ. Bull. 1, 155–160, 1992. Helas, G., Lobert, J., Scharffe, D., Sch¨afer, L., Goldammer, J., Baudet, J., Ahoua, B., Ajavon, A.-L., Lacaux, J.-P., Delmas, R., and Andreae, M. O.: Ozone production due to emissions from vegetation burning, J. Atmos. Chem. 22, 163–174, 1995 Hoke, J. E. and Anthes, R. A.: The initialization of numerical
models by a dynamic-initialization technique, Mon. Wea. Rev., 104(12), 1551–1556, 1976.
Holloway, T., Levy II, H., and Kasibhatla, P.: Global distribution of carbon monoxide, J. Geophys. Res., 105, 12 123–12 147, 2000. Horowitz, L. W., Walters, S., Mauzerall, D. L., Emmons, L. K.,
Rasch, P. J., Granier, C., Tie, X., Lamarque, J.-F., Schultz, M. G., Tyndall, G. S., Orlando, J. J., and Brasseur, G. P.: A global simu-lation of tropospheric ozone and related tracers: Description and evaluation of MOZART, version 2, J. Geophys. Res., 108(D24), 4784, doi:10.1029/2002JD002853, 2003.
Huntrieser, H., Feigl, C., Schlager, H., Schr¨oder, F., Gerbig, C., van Velthoven, P., Flatøy, F., Th´ery, C., Petzold, A., H¨oller,
H., and Schumann, U.: Airborne measurements of NOx, tracer
species, and small particles during the European Lightning Ni-trogen Oxides Experiment, J. Geophys. Res., 107(D11), 4113, doi:10.1029/2000JD000209, 2002.
Janicot, S., Trzaska, S., and Poccard, I.: Summer Sahel-ENSO tele-connection and decadal time scale SST variations, Clim. Dyn., 18, 303–320, 2001.
Jeuken, A. B. M., Siegmund, P. C., Heijboer, L. C., Feichter, J., and Bengtson, L.: On the potential of assimilating meteorological analysis in a climate model for the purpose of model validation, J. Geophys. Res., 101, 16 939–16 950, 1996.
Kesselmeier, J. and Staudt, M.: Biogenic volatile organic com-pounds (VOC): An overview on emission, physiology and ecol-ogy, J. Atmos. Chem., 33, 23–88, 1999.
Labrador, L. J., von Kuhlmann, R., and Lawrence, M. G.: The ef-fects of lightning-produced NOx and its vertical distribution on atmospheric chemistry: sensitivity simulations with MATCH-MPIC, Atmos. Chem. Phys., 5, 1815–1834, 2005
Lamarque, J.-F., Brasseur, G. P, Hess, P. G., and Mueller, J.-F.: Three dimensional study of the relative contributions of the dif-ferent nitrogen sources in the troposphere, J. Geophys. Res., 101, 22 955–22 968, 1996.
Lawrence, M. G., Chameides, W. L., Kasibhatla, P, S., Levy II, H., and Moxim, W.: Lightning and atmospheric chemistry: The rate of atmospheric NO production, in: Handbook of Atmospheric Electrodynamics, edited by: Volland, H., Vol. I, CRC Press, Inc., Boca Raton, 189–202, 1995.
Lawrence, M. G., von Kuhlmann, R., and Salzmann, M.: The bal-ance of effects of deep convective mixing on tropospheric ozone, Geophys. Res. Lett., 30, 18, 1940, doi:10.1029/2003GL017644, 2003.
Lin, S.-J. and Rood, R. B.: Multidimensional Flux-Form Semi-Lagrangian Scheme. Mon. Wea. Rev., 124, 2046–2070, 1996. Liu, S. C., Trainer, M., Fehsenfeld, F. C., Parrish, D. D., Williams,
E. J. , Fahey, D. W., Huebler, G., and Murphy, P. C.: Ozone pro-duction in the rural troposphere and the implications for regional and global ozone distributions, J. Geophys. Res., 92, 4191–4207, 1987.
Marenco, A., Medale, J. C., and Prieur, S.: Study of tropospheric ozone in the tropical belt (Africa, America) from STRATOZ and