HAL Id: hal-02441922
https://hal-cea.archives-ouvertes.fr/hal-02441922v2
Submitted on 16 Mar 2020HAL is a multi-disciplinary open access
archive for the deposit and dissemination of sci-entific research documents, whether they are pub-lished or not. The documents may come from teaching and research institutions in France or abroad, or from public or private research centers.
L’archive ouverte pluridisciplinaire HAL, est destinée au dépôt et à la diffusion de documents scientifiques de niveau recherche, publiés ou non, émanant des établissements d’enseignement et de recherche français ou étrangers, des laboratoires publics ou privés.
Using EUROPLEXUS code
S. Kudriakov, E. Studer, A. Beccantini, A. Velikorodny
To cite this version:
S. Kudriakov, E. Studer, A. Beccantini, A. Velikorodny. Industrial-Scale Hydrogen Deflagration Simulations Using EUROPLEXUS code. NUTHOS-11 - The 11th International Topical Meeting on Nuclear Reactor Thermal Hydraulics, Operation and Safety, Oct 2016, Gyeongju, South Korea. �hal-02441922v2�
N11P1234
1/12
Industrial-Scale Hydrogen Deflagration Simulations
Using EUROPLEXUS Code.
S. Kudriakov, E. Studer, A. Beccantini
DEN, STMF, CEA, Université Paris-SaclayF-91191 Gif-sur-Yvette, France
[email protected], [email protected], [email protected]
A. Velikorodny
AUSY
6 rue Troyon, 92310 Sèvres, France [email protected]
ABSTRACT
During certain severe accident scenarios in a Nuclear Power Plant, hydrogen gas is released into the containment. In the case of ignition, various combustion regimes are possible depending on the local concentrations of hydrogen and steam, as well as pressure and temperature distributions. These regimes may include jet fires, slow or fast deflagrations and detonations. Therefore, in order to improve hydrogen risk management strategies one has to find means to estimate the severity of combustion processes involved in various regimes of flame propagation.
In recent years, the use of CFD codes for combustion modelling at industrial scale becomes widely accepted. Due to difference in scales involved in flame propagation modelling in large geometries, validation of a CFD code becomes a necessary preliminary step in order to assure a high level of confidence. This paper describes a validation of the EUROPLEXUS code against several large and medium scale experimental data as well as a methodology for the code application for hydrogen deflagration simulation under typical containment conditions for nuclear safety.
KEYWORDS
HYDROGEN COMBUSTION, EUROPLEXUS CODE, CFD
1. INTRODUCTION
During certain postulated accidents in nuclear reactor containment, hydrogen gas can be released into the containment. Depending on the local concentration and/or presence and activation of mitigation devices, hydrogen may burn following different combustion regimes. These regimes may include jet fires, slow deflagrations, fast deflagrations and detonations depending on the combustion process development. Thus, one has to estimate the severity of a combustion process under given geometrical configuration, scale, and composition of combustible mixture. These data then can be used in structural mechanics analysis codes to verify the integrity of the structure.
In spite of considerable progress made in modeling a combustion process inside a large scale facility, there are still issues which require further research effort. The results of International Standard Problem 49 have shown that “existing combustion models demonstrate that the quality of the prediction of the flame acceleration, which has the highest importance in the safety analysis, in the tube-like geometries with the regular obstruction have reached moderately high level of accuracy,
2/12
however in other geometrical configurations there were no clear proof of their conformity to the numerical code validation requirements. The major attention in the future model development has to be paid on the adoption of the existing approaches or creation of the new ones capable reliably predict the possibility of the flame acceleration in the geometrical configuration typical of the Nuclear Power Plant (NPP) environment...” [1].
The difficulty with combustion modeling at reactor scale under an accidental release scenario is twofold. The first is related to the geometry, which is characterized by its large scale, compared to the physical properties of a flame, and highly complex multicompartment structures. The second lies in the fact that during hydrogen and steam release, composition gradients can generally develop in certain space and time intervals. Indeed, burnable mixture clouds can vary in size and location during the release scenario. The moment and the location of ignition (only weak ignitions are considered here) is a key parameter for the damage evaluation and the specific problem related to their choice is still an open question.
A combustion model based on works of [2] and [3] was recently implemented in the EUROPLEXUS code [4]. EUROPLEXUS is a simulation software dedicated to the analysis of fast transient phenomena involving structures and fluid in interaction. This represents an invaluable opportunity to analyze structural response during flame propagation using the same numerical platform.
The combustion model has been validated using the experimental data obtained in several large and medium scale experimental facilities and covering all major flame regimes (slow flames, fast flames and detonations). A brief description of the model and its validation database are presented in Section 2 and Section 3, respectively. The methodology based on release scenario analysis for choosing the ignition time and location, which would potentially lead to conservative pressure estimations, is presented in Section 4. Conclusions follow.
2. PHYSICAL MODELLING
In this section we present the governing equations we solve, together with the underlying hypothesis. The model used for validation is based on the RDEM (Reactive Discrete Equation Method) approach [5] which requires the solution of the reactive Riemann problem between the burnt and unburnt regions. The combustion model was described in great details in [6] and here we present it briefly for completeness. The system of equations is the reactive Euler equations:
0
0
)
(
)
(
0
)
(
)
(
0
)
(
D
t
h
w
e
t
P
w
w
w
t
w
t
t t (1)The first three equations are the classical conservation equations for mass, momentum and energy. The fourth equation is the transport equation for the progress variable
. This equation is in non-conservative form. The apparent velocity D needs to be defined only on the interface (with the same value ahead and behind it) and represents its velocity. The apparent velocity is computed as a function of the fundamental flame speedK
0 viaN11P1234
3/12
D
w
K
0n
(2)where n is the normal to the flame surface going from the burnt to the unburnt region, w is the velocity of the unburnt gas. We also suppose that we know the fundamental flame speed K0 as function of space and time.
Finally, the convective fluxes are discretized using the second order Two-Shock method [19], and an explicit second order scheme in time is applied to the discretized in space equations.
2.1. Fundamental Flame Velocity Modelling
The only parameter of the RDEM model is K0 which represents fundamental flame velocity, i.e. flame velocity relative to the fresh mixture just ahead of it. In this subsection we describe a model for this parameter. The function can be expressed as a product of several factors
K0 SL0THTURBWRIN
(3)
where
0L
S
is the fundamental flame velocity of the gas mixture under consideration determined at reference temperature and pressure(
P
0,
T
0)
,
THis the thermodynamic factor which takes into account pressure and temperature influence on the fundamental flame velocity [7], 0 0 T T P P TH
(4)
Concerning the turbulence factor
TURB, here we use the correlation of [8],0.3 15 . 0 55 . 0 0 ( ) ' 8 . 0 1 L Le S u L t L USER TURB
(5)
Laminar flame thickness
L and the Lewis number Le are the properties of initial gas mixture. In order to estimate r.m.s. turbulent velocity u' and the integral scale of turbulenceL
t, we apply the LES modelling approach, i.e. the integral scale of turbulence is estimated using mesh size ,
0
.
2
t
L
, while the r.m.s. turbulent velocity is found from , 2 ' Lt SijSij u with . 2 1 i j j i ij x u x uS
A user parameter
USER is introduced in order to take into account all uncertainties.Wrinkling factor accounts for the fractal increase of flame surface area with an increase of the integral flame scale. In the case of flame development in an obstacle free space [9] have shown that the ratio between the surface of a spherically propagating flame and the surface of the equivalent sphere increases according to (R/R0)1/3, where R is the distance from the ignition point. This mechanism only starts to affect the flame growth for radius greater than
R
0which is of the order of 1m for a stoichiometric hydrogen-air mixture. Finally,3 / 1 0 R R WRIN
(6)
3. EXPERIMENTAL DATA USED FOR VALIDATION
The combustion model has been validated on a number of test cases covering different combustion regimes, such as slow deflagration (SD), fast deflagration (FD) and Deflagration-to-Detonation
4/12
transition (DDT). These tests have been performed a) in large-scale facilities, such as RUT, Battelle, THAI, FM Global, HDR, as well b) in medium-scale facilities, such as DRIVER and ENACCEF. A comprehensive validation matrix covering initial conditions and combustion regimes for each test, together with the corresponding references, is given in Table 1 (RUT tests) and Table 2 (other tests). We have to mention that all large-scale tests were performed at ambient pressure, and it would be beneficial to have large-scale tests with initially elevated pressure, typical of an accidental scenario. Here we present three examples from the validation matrix. For the other examples please refer to [6].
Table 1. Initial conditions and combustion regimes for RUT tests [10], (BR=”Blockage Ratio”). Test (combustion regime)
X
H2 (vol%) O HX
2 (vol%) 2 OX
(vol%) T (K) P (atm) BR T13 (SD) 11.0 0.0 18.7 283.0 1.0 0.3 T23 (SD) 11.2 0.0 18.6 283.0 1.0 0.6 T19 (SD) 12.5 0.0 18.4 283.0 1.0 0.0 T11 (DDT) 12.5 0.0 18.4 283.0 1.0 0.3 T22 (DDT) 14.0 0.0 18.1 283.0 1.0 0.6 STM2 (FD) 12.5 14.8 15.4 363.0 1.0 0.3 STM3 (DDT) 14.3 15.1 14.8 356.3 1.0 0.3 STM4 (DDT) 18.9 24.8 11.8 364.8 1.0 0.3 STM6 (DDT) 14.5 26.7 12.3 361.6 1.0 0.3 STM7 (FD) 13.0 25.7 12.9 362.1 1.0 0.3 STH1 (FD) 21.5 34.8 9.2 369.6 1.0 0.3 STH3 (DDT) 17.5 40.0 8.9 364.0 1.0 0.3 STH6 (FD) 16.0 45.9 8.0 363.5 1.0 0.3 STH7 (FD) 17.1 40.6 8.9 365.4 1.0 0.3 STH8 (DDT) 15.7 15.3 14.5 363.7 1.0 0.3 STH9 (SD) 9.4 6.7 17.6 354.1 1.0 0.3Table 2. Initial conditions and combustion regimes for other validation tests. Test (combustion regime)
X
H2(vol%) O H
X
2 (vol%) 2 OX
(vol%) T (K) P (atm) BR THAI HD22 (SD) [1] 9.9 25.3 13.6 364.9 1.468 0.0 Battelle Ex22 (SD) [11] 10.0 0.0 18.9 298.0 1.0 0.66(1) HDR E12.3.2 (SD) [11] 10.0 25.0 13.7 337.0 1.0 0.87(1) DRIVER mc012 (FD) [12] 13.0 0.0 18.3 285.0 1.0 0.6 ENACCEF H13 (FD) [1] 13.0 0.0 18.3 300.0 0.987 0.63 FM Global H18 (SD) [13] 18.3 0.0 17.2 298.0 1.0 0.61(1)3.1. Selected example: STM7 RUT test.
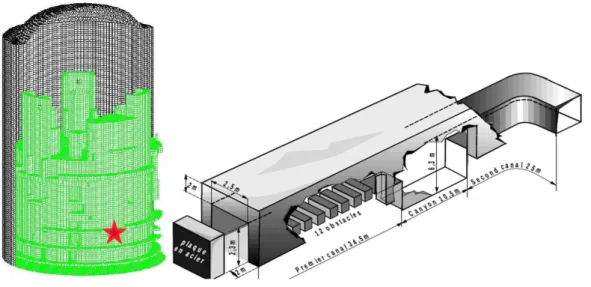
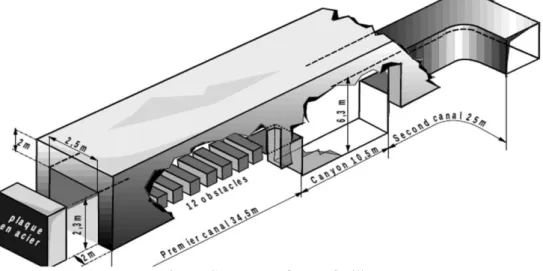
The Russian RUT facility [10] represents a reinforced concrete building having a few channels and compartments inside (see Fig. 1). The geometry consists of the first channel (34.5 m long and 5.6 m2 in cross section), the canyon (10.6 m long and 15.7
m
2cross section) and a second channel with a linear part being 18.0 m long. The hydraulic diameter (Dh) of the first channel is about 2.4 m. Concrete obstacles were located in the first channel in order to promote the flame acceleration processes. The blockage ratio (BR) was usually equal to 0.3, while a few tests were performed usingN11P1234
5/12
BR=0.6. The ignition was initiated with a weak electrical spark at the closed end of the first channel. The mixture of hydrogen/air or hydrogen/air/steam was homogeneous in all experiments considered herein. The facility was equipped with pressure transducers to record the pressure waves development during the combustion process. The flame front position was deduced from photodiodes and ion probes.
Various experimental programs were performed between 1993 and 2003. 16 tests have been selected for the validation purposes (see Table 1), and here we present the computational results corresponding to the test STM7.
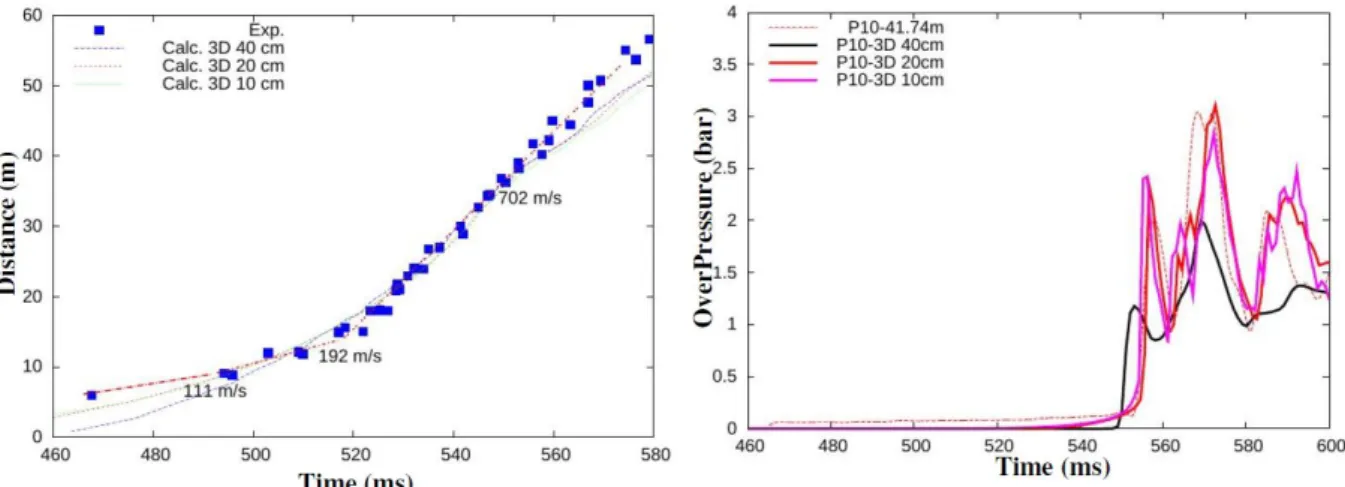
During the STM7 test, the flame was continuously accelerated and the “choked-flame” conditions were reached in the middle of the first channel corresponding to a typical fast flame regime. This regime was maintained during the flame propagation in the canyon and in the second channel (Fig. 2). The calculations of the test have been performed with uniform grids of x=40, 20, and 10 cm. These grid sizes are comparable to the ones typically used for hydrogen dispersion analysis inside NPP. The user parameter
USER (see Eq. (5)) has been varied in order to minimize the difference withexperimental results, and it is dependent on mesh size.
The time scales in the computation have been adjusted in order to correct for initial flame development phase, i.e. transition from laminar to turbulent flame. In other words, we consider a flame to become instantaneously turbulent just after the ignition. The flame acceleration process in the first channel is well captured by the model for all grid sizes (Fig. 2, left), while there is a big difference between the computational results for pressure obtained using the grid size of 40 cm and the corresponding experimental data (Fig. 2, right). The pressure curves corresponding to the grid sizes 20 cm and 10 cm are very similar and almost resemble the experimental pressure signal. The same behavior was observed while computing the other RUT tests, which resulted in the optimum choice for the mesh size, x=20 cm.
6/12
Fig. 2. Flame time-of-arrival diagram (left) and pressure signal at 41.7 m (right). Comparison between experimental data and computed results using different grids.
3.2. Selected example: FM Global H18 test.
The test chosen for model validation corresponds to the experiment performed in a 64.0
m
3 explosion test chamber. The overall dimensions of the chamber are 4.6x3.0x4.6 m with a square vent of 5.4m2, located on one of the vertical walls. Four chamber pressure transducers were mounted to the chamber, one at the center of the wall opposite the vent, one on the wall containing the vent, and two on a wall perpendicular to the vent (one on-axis with the center of the chamber, one off-axis), (see Fig. 3). Twenty flame time-of-arrival thermocouples, at a height of 1.4 m above the floor of the chamber, were placed at 0.5 m intervals inside the chamber along two axes and at 1 m intervals outside of the chamber [13]. The 18.3% hydrogen/air mixture is ignited at 0.25 m from the center of the wall opposite to the vent (back ignition).Fig. 4 (left) presents the experimental pressure signal (red curve) which was obtained from readings of transduce P1 using 80 Hz low pass filter. The strong overpressure peak of 0.13 bar is generated inside the chamber soon after the flame leaves the facility through the vent; it is attributed to the external explosion and is followed by Helmholtz oscillations. The computations were performed in 3D with two grids, x=20 and 40 cm, and the results corresponding to finer grid are presented here. The model managed to capture the first pressure peak but failed to compute the following peaks. This deficiency is commonly observed by other CFD users (see the results of [13]) and is related to the fact that the second pressure peak is attributed to flame-acoustics interactions and the large scale combustion models are unable to take this effect into account.
Flame velocities were calculated using flame time-of-arrival data from the line of thermocouples, with the direction towards the vent (Fig. 4, right). The modelled flame velocity follows closely the experimental data up to 4.6 m (Fig. 4, right). The computed flame velocity is overestimated compare to its experimental counterpart after the flame leaves the test chamber. After this point in time, the flame develops into three-dimensional mushroom-like shape, and the correct prediction of the flame velocity along the main axe requires the knowledge on flame development in other directions. At this time, we unfortunately do not have the related experimental data.
N11P1234
7/12
Fig. 3. FM Global facility geometry and instrumentation. Scanned from [13].
3.3. Selected Example: ENACCEF Test H13.
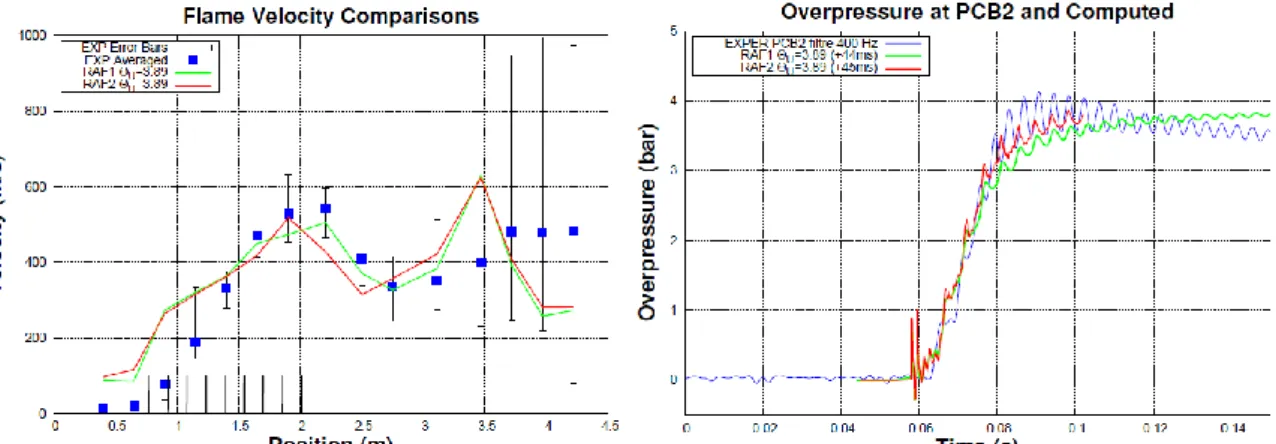
The ENACCEF experimental set-up consists of an acceleration tube of 3.2 m long and 154 mm in diameter with a dome on top it (Fig. 5). The tube is equipped with a series of obstacles (BR=0.63) with a first one positioned 0.64 mm from an ignition point. These 9 obstacles are separated with a distance equal to the one tube diameter. The top cylindrical part of the geometry, being 1.7 m long and 738 mm in diameter, represents a reactor dome, (for reference see e.g. page 182 [1]).
Fig. 4. Pressure evolutions inside the facility (left) and flame speed along the central axes (right). Experimental data (red color) are compared to the computed ones (blue color).
8/12
Fig. 6. Flame speed along the central axes (left) and pressure evolution inside the dome (right). Experimental data (blue color) are compared to the computed ones (red and green color). The initial gas mixture is 13 vol% of hydrogen and 87 vol% of air at the pressure of 1 bar and the temperature of 300 K. This test was repeated 24 times and the following conclusions were drawn:
a flame was significantly accelerated in the obstructed section to achieve the velocity of the order of 550 m/s;
later on, in the smooth section of the tube, the flame decelerates to mean velocity of 335 m/s;
velocity profile in the dome was hardly measurable, having very large deviations from the mean velocity value.
The calculations are realized in 3D with the grid sizes of 1.2 and 0.6 cm, which were selected in order to have the same number of cells on the hydraulic diameter as in previous computations. The
USERparameter of 3.89 used by the model permitted to find a flame speed close to the one observed in the experiment (Fig. 6, left). As before, the computed flame acceleration is higher at the initial phase of the flame development, as this phase cannot be predicted by present model. The experimental pressure transient in the dome shown in Fig. 6 (right) was filtered by a 400 Hz low pass filter in order to demonstrate periodic pressure wave oscillations at a frequency of about 250 Hz. The calculated pressure curves predicted by the computations are able to reproduce quite well the filtered signal.
4. ANALYSIS OF THE EXPLOSION RISK INSIDE A REACTOR CONTAINMENT.
As was mentioned in the Introduction, while performing combustion modeling at reactor scale under an accidental release scenario, one might face several problems. The first is related to the geometry, which is characterized by its large scale, compared to the physical properties of a flame, and highly complex multicompartment structures. The second lies in the fact that during hydrogen and steam release, composition gradients can generally develop in certain space and time intervals, making it difficult to choose the moment and the location of ignition which would lead to conservative pressure estimations. Our approach is based on three steps.
First, the validation data base has to include experiments performed in large scale facilities with the
geometries as close as possible to the NPP internal structures and having initial explosive mixtures of hydrogen, air and steam. It means that one cannot rely entirely on combustion model validation using only medium or small scale experiments and mixtures containing just hydrogen and air, prior to performing computations in a large scale containment. This comes from the fact that, at present, the “large-scale” combustion models are not predictive and the computational results strongly depend on mesh size and geometry scale.
Consider the RUT facility as an example. Its total length of about 60m and presence of obstacles makes it an interesting candidate for model validation, as the a) total height of the containment has
N11P1234
9/12
similar value, and b) some parts of the containment resemble a channel-like geometry with obstacles, like vertical extension inside steam generator compartments or a space between the outer wall (black color in Fig. 7, left) and internal structures (green color in Fig. 7, left). Moreover, a considerable number of experiments has been performed with steam being part of the initial mixture (see Table 1).
Fig. 7. Details of some internal structures inside a Nuclear Power Plant (left) and view of RUT geometry (right).
We have performed some preliminary computations using reactor geometry (Fig. 7, left) and the combustible mixture corresponding to the STH9 RUT test (9.4vol% of hydrogen and 6.7% of steam in air). The idea behind was to assess the model sensitivity to the changes in geometry, i.e. by using the same optimal model parameter determined in RUT STH9 test for the mesh size of 20 cm, find the flame velocities thus obtained inside the reactor containment and compare them with their RUT STH9 counterparts.
The mixture was ignited at the lower part of the channel corresponding to the steam generator 2 (GV2 in the Fig. 8, left). From Fig. 8 we can see that the vertical flame velocity inside the channel GV2 (pink color in Fig.8, left), 121 m/s, is similar to the flame velocity in the first channel observed in the RUT case, 135 m/s (Fig. 8, right). Flame enters the channel corresponding to steam generator 3 (GV3) at a later time, being accelerated, thus having higher velocity, 317 m/s, which is comparable to the highest flame velocity observed inside the RUT facility, 275 m/s. At a later time, the flame travels through the third channel (GV1) and its velocity is increased even further, up to 427 m/s.
Fig. 8 Flame velocities computed inside the reactor containment (left, x=20cm) and experimental flame velocities inside the RUT facility, test STH9 (right).
10/12
Second, the values of the user parameters,
USER, obtained during validation exercise for a particular mesh size can be represented as functions of the corresponding physical mixture properties, like, for example, function of mixture expansion ratio
, and the highest value for each mixture will be used for the reactor applications, for the same mesh size. The user-parameter function thus chosen would result in conservative overpressures for all test cases from the validation matrix (Table 1 and 2). This would guarantee the conservative pressure loads during the flame development due to the fact that the flame velocity (and related pressure increase) is directly proportional to the user parameter.Third, the accidental injection scenario is analyzed in terms of ignition time and place. Suppose we
are provided with concentrations of air, steam, hydrogen, plus temperature and pressure at all time steps and at every point (or numerical cell) inside the volume of NPP. The analysis of mixture is based on the following procedure performed at every point and at each time step:
characterize the mixture in terms of flammability using the available flammability criteria (see for example [14] and [15]).
within the flammable mixture determine the locations where the mixture is sensitive to flame acceleration using the empirical criterion, which can be expressed as
*(
* depends on mixture properties, see [16] for details). It was observed that some mixtures inside the channel-like geometries with regular obstructions, after being ignited, can result in supersonic flames (in laboratory frame of reference), while the others produce subsonic slow flames or quenched flames. Thus, the former mixtures are called sensitive mixtures. The locations, where the criterion is satisfied, will form some clouds which we shall further call "sensitive clouds". characterize each sensitive cloud in terms of its volume and maximum length in each direction, as well as its maximum and averaged “sensitivity” (
/
*).After performing the above steps, one can choose the ignition time to be the time step when the sensitive cloud is the biggest in terms of volume, maximum length, and its averaged sensitivity is the highest. Quite often these conditions cannot be satisfied at a single time step. In that case, one either has to base the analysis on a smaller number of parameters, or to deal with several ignition times. The ignition location could be the point where the mixture is most sensitive and/or the running distance for a flame inside the sensitive cloud is the biggest.
5. CONCLUSIONS
The combustion model has been implemented in the EUROPLEXUS code has been presented in this paper. It has been extensively validated using the experimental data obtained in several large and medium scale experimental facilities and covering all major flame regimes (slow flames, fast flames and detonations). Three described validation examples show that in order to find the experimental results for overpressure and flame velocity, one has to tune a model parameter, and the parameter value generally can be mesh-dependent.
The methodology based on release scenario analysis for choosing the ignition time and location, which would potentially lead to conservative pressure estimations, is presented in this paper. The model will be used for combustion studies based on NPP severe accident scenarios.
The on-going and future work related to the model development can be split into two directions. The first aspect is associated to its validation and possible improvement for initially spatially non-homogeneous mixtures. The experimental data obtained during the LACOMECO project [17] is a good candidate for validation tests. The second avenue for work is the interpretation of the tests on fluid-structure interaction which will be performed inside the SSEXHY facility (located at CEA) in the framework of MITHYGENE project [18].
N11P1234
11/12
ACKNOWLEDGMENTS
This work has been performed with a financial support of the Electricité de France (EDF) in the framework of the Generation II & III reactor program. The authors would like to thank V. Faucher and P. Galon from the EUROPLEXUS development team.
REFERENCES
1. “ISP-49 on hydrogen combustion. Nuclear Safety”, Report NEA/CSNI/R(2011), http://www.oecd-nea.org/nsd/docs/2011/csni-r2011-9.pdf
2. C.R. Bauwens, J. Chaffee, S. Dorofeev, “Vented explosion overpressures from combustion of hydrogen and hydrocarbon mixtures”. Int. J. Hydrogen Energy, 36, 2329-2336 (2010).
3. J. Yanez, A. Kotchourko, and A. Lelyakin, “Hydrogen deflagration simulations under typical containment conditions for nuclear safety”, Nuclear Engineering and Design, 250, pp. 678-686, (2012)
4. EUROPLEXUS(2012). europlexus.jrc.ec.europa.eu.
5. A. Beccantini and E. Studer , “The reactive Riemann problem for thermally perfect gases at all combustion regimes”. International Journal for Numerical Methods in Fluids, 2009.
6. A. Velikorodny et al., “Combustion modeling in large scale volumes using EUROPLEXUS code”, Journal of Loss Prevention in Process Industries, 35, pp. 104-116 (2015)
7. F. Malet, « Etude expérimentale et numérique de la propagation de flammes pré mélangées turbulents dans une atmosphère pauvre en hydrogène et humide »; PhD Thesis de l’Université d’Orléans; 2005
8.
D. Bradley, A.C. Law, and M. Lawes, “Flame stretch rate as a determinant of turbulent
burning velocity”. Phil. Trans. Roy. Soc. London, A338:359-387, 1992.
9.
Y.A. Gostincev, A.G. Istratov, and Y.V. Shulenin, “Self-similar propagation of a free
turbulent flame in mixed gas mixtures. Combustion Explosions and Shock Waves, 24:
563-569, 1987.
10.
S. Dorofeev et al., “Deflagration to detonation transition in large confined volume of lean
hydrogen-air mixtures. Combustion and Flame, 104, pp.94-110, 1996.
11.
T. Kanzleiter, “BMC and DN400 Hydrogen Deflagration Tests. Proposal for a test matrix
with a link to MUSCET and HDR Tests, Third Meeting of the Group of Experts on the
Development of a Phenomena-based Validation Matrix for Ex-vessel Models and Codes,
January 15-16, GRS, Garching, Germany, 2004.
12.
S. Dorofeev et al., “Integral large scale experiments on hydrogen combustion in a
containment of nuclear power plants. Final Report”, RRC KI, March 2002.
13.
C.R. Bauwens, J. Chaffee, S. Dorofeev, “Vented explosion overpressures from combustion
of hydrogen and hydrocarbon mixtures”, International Journal of Hydrogen Energy, 13,
pp.2329-2336, 2011.
14.
Z.M Shapiro and T.R. Mofette, “Hydrogen flammability data and application to PWR
loss-of-coolant accident”, Technical report WAPD-SC-545, 1957
15.
G. Baptiste, G. Carvallo, and P. Pepin, , « Introduction de la combustion de l’hydrogène et
de
l’oxyde
de
carbone
dans
le
code
JERICHO »,
Technical
report
DEMT/SYST/LECS/83/042, 1983.
16.
S. Dorofeev et al., « Evaluation of limits for effective flame acceleration in hydrogen
mixtures”, Journal of Loss Prevention in the Process Industries, 14, pp. 583-589, 2001.
17.S. Kudriakov, E. Studer, M. Kuznetsov, J. Grune, “Experimental and numerical
12/12
Proceedings of the 21
stInt. Conference on Nuclear Engineering (ICONE), 2013, Chengdu,
China.
18.
http://www.irsn.fr/EN/Research/Research-organisation/Research-programmes/Mithygene-project/Pages/MITHYGENE-project.aspx
19.

![Fig. 3. FM Global facility geometry and instrumentation. Scanned from [13].](https://thumb-eu.123doks.com/thumbv2/123doknet/12711894.356117/8.892.244.643.111.352/fig-fm-global-facility-geometry-instrumentation-scanned.webp)