Reaction time performance in ADHD : improvement
under fast-incentive condition and familial effects
P E N N Y A N D R E O U1, B E N M. N E A L E1, W A I C H E N1, H A N N A C H R I S T I A N S E N2, I S A B E L G A B R I E L S3, A L E X A N D E R H E I S E4, S H E E R A M E I D A D5, U E L I C. M U L L E R6, H E N R I K U E B E L4, T O B I A S B A N A S C H E W S K I4,7, I R I S M A N O R5, R O B E R T O A D E S2, H E R B E R T R O E Y E R S3, A R I B E R T R O T H E N B E R G E R4, P A K S H A M1 , H A N S - C H R I S T O P H S T E I N H A U S E N6 , P H I L I P A S H E R S O N1 A N D J O N N A K U N T S I1 *
1MRC Social, Genetic and Developmental Psychiatry Centre, Institute of Psychiatry, King’s College London, UK;2Rheinische Kliniken Essen Klinik fu¨r Psychiatrie und Psychotherapie des Kindes- und Jugendalters,
Essen, Germany ;3UZ – Gent De Pintelaan, Gent, Oos-Vlaanderen, Belgium ;4Child and Adolescent Psychiatry, Georg-August-University, Goettingen, Germany ;5ADHD Unit, Geha Mental Health Centre, Petach-Tikva, Israel ;6Department of Child and Adolescent Psychiatry, University of Zurich, Switzerland ;
7
Central Institute of Mental Health, Department of Child and Adolescent Psychiatry and Psychotherapy, Mannheim, Germany
ABSTRACT
Background. Reaction time (RT) variability is one of the strongest findings to emerge in cognitive-experimental research of attention deficit hyperactivity disorder (ADHD). We set out to confirm the association between ADHD and slow and variable RTs and investigate the degree to which RT performance improves under fast event rate and incentives. Using a group familial correlation approach, we tested the hypothesis that there are shared familial effects on RT performance and ADHD.
Method. A total of 144 ADHD combined-type probands, 125 siblings of the ADHD probands and 60 control participants, ages 6–18, performed a four-choice RT task with baseline and fast-incentive conditions.
Results. ADHD was associated with slow and variable RTs, and with greater improvement in speed and RT variability from baseline to fast-incentive condition. RT performance showed shared familial influences with ADHD. Under the assumption that the familial effects represent genetic influences, the proportion of the phenotypic correlation due to shared familial influences was estimated as 60–70 %.
Conclusions. The data are inconsistent with models that consider RT variability as reflecting a stable cognitive deficit in ADHD, but instead emphasize the extent to which energetic or motiva-tional factors can have a greater effect on RT performance in ADHD. The findings support the role of RT variability as an endophenotype mediating the link between genes and ADHD.
INTRODUCTION
Attention deficit hyperactivity disorder (ADHD) is one of the most common disorders of child-hood, affecting 3–10 % of school-age children
(Goldman et al. 1998 ; Burd et al. 2003 ; Faraone et al. 2003 ; Ford et al. 2003). It is characterized by age-inappropriate levels of inattention, impulsivity and overactivity. Family studies demonstrate that ADHD runs in families
* Address for correspondence : J. Kuntsi, Ph.D., MRC Social, Genetic and Developmental Psychiatry Centre, Institute of Psychiatry, King’s College London, De Crespigny Park (Box P080), London SE5 8AF, UK.
(Email : [email protected])
doi:10.1017/S0033291707000815 First published online 31 May 2007 Printed in the United Kingdom
(Cantwell, 1975 ; Faraone et al. 1998) and twin studies indicate an average heritability around 76 % (Faraone et al. 2005). Molecular genetic studies implicate several genes in ADHD, with the strongest evidence to date emerging for the dopamine D4 (DRD4) and D5 (DRD5) recep-tor genes (Li et al. 2006). Cognitive studies, as well as functional studies using electrophysio-logy and brain imaging, converge in suggesting that a deficit specific to a hypothesized ‘ core ’ cognitive function in ADHD has been difficult to demonstrate (Kuntsi et al. 2006 a). In cogni-tive studies that have used careful control con-ditions, children with ADHD often perform poorly across both experimental and control conditions on tasks measuring abilities such as sustained attention, selective attention and inhibition (e.g. Mason et al. 2003, 2005 ; Berwid et al. 2005 ; Drechsler et al. 2005).
However, one aspect of task performance emerges that is consistently and strongly associ-ated with ADHD. Across a variety of tasks, individuals with ADHD show high intra-individual variability (IV), particularly reaction time (RT) variability (see Castellanos & Tannock, 2002 ; Nigg, 2005). Leth-Steensen et al. (2000) demonstrated how a greater proportion of abnormally slow responses, mixed with fast responses on some trials, led to the inconsistent pattern of responding in ADHD. A recent psychometric analysis further indicated how, across several cognitive tasks, measures of IV best distinguished individuals with ADHD from a control group, with limited incremental validity of measures of central tendency and errors (Klein et al. 2006). Principal components analyses suggested that IV might reflect a uni-tary construct (Klein et al. 2006). The theoreti-cal underpinnings of IV in ADHD continue to be debated : proposed underlying causes include a temporal processing deficit (Castellanos & Tannock, 2002), a deficit in the ability to ap-propriately modulate very low-frequency fluc-tuations in neuronal activity (Castellanos et al. 2005), inefficiency in the deployment of atten-tion by executive control processes (Bellgrove et al. 2005 b) or a deficit of sustained attention (Heinrich et al. 2001), and difficulties with the regulation of energetic state (Borger & van der Meere, 2000 ; Kuntsi et al. 2001 ; Scheres et al. 2001 ; Banaschewski et al. 2003). The state regulation hypothesis is suggested by the finding
that manipulations with factors such as event rate (the presentation rate of stimuli ; for reviews see Sergeant, 2000 ; van der Meere, 2002 ; Sergeant, 2003) or rewards (Konrad et al. 2000 ; Slusarek et al. 2001) can substantially improve the performance of children with ADHD, in some cases to the level of controls ; cognitive ‘ deficits ’ or excessive variability appear in tasks or conditions that fail to optimize the child’s energetic (arousal/activation/effort) state. Focusing on ADHD symptom scores in a gen-eral population sample, an association similarly emerged between RT variability and teacher-rated ADHD symptom scores in the baseline condition, but not in the fast-incentive con-dition of the ‘ Fast Task ’ (although there was no association with parent ratings ; Kuntsi et al. 2005).
A recent population twin study demonstrated a moderate degree of heritability for mean RT (MRT) and RT variability on tasks used in ADHD research, including the ‘ Fast Task ’ (Kuntsi et al. 2006 b). Preliminary evidence also suggests that RT variability may indicate an
intermediate phenotype (‘ endophenotype ’)
(Gottesman & Shields, 1973 ; Gottesman & Gould, 2003) between genes and the behavioural symptoms of ADHD. An initial twin study suggested shared genetic influences on RT variability and ADHD symptoms (Kuntsi & Stevenson, 2001) and a subsequent family study similarly indicated shared familial effects (Nigg et al. 2004). Here we extend these preliminary investigations by examining speed and varia-bility of RT performance under two exper-imental conditions in a large, international sample of ADHD and control sibling pairs. We tested the hypotheses that (1) ADHD is associated with slow and variable RTs, (2) a faster event rate and incentives lead to greater improvement in RT performance in children with ADHD compared to controls, and (3) there are shared familial effects on RT perform-ance and ADHD.
METHOD Samples ADHD sample
As part of the International Multi-centre ADHD Gene (IMAGE) project (see Brookes
et al. 2006), European Caucasian subjects were recruited from six specialist clinics in
five countries : Belgium, Germany, Israel,
Switzerland and the UK. Children entering the IMAGE project were invited to take part in
further studies of cognitive performance.
Ethical approval was obtained from National Institute of Health registered ethical review boards for each centre. Entry criteria for this study were a research diagnosis of DSM-IV combined-type ADHD (see below) and having one or more full siblings available for ascer-tainment of clinical information and DNA col-lection. Probands and siblings were aged 6–18 years at the time of entry into the study. Exclusion criteria applying to both probands and siblings included autism, epilepsy, IQ<70, brain disorders and any genetic or medical dis-order that might mimic ADHD.
The Fast Task was administered to 147 ADHD probands and 125 of their nearest-age siblings who fulfilled the study criteria and agreed to take part. Three ADHD probands were excluded because of technical problems with the portable laptops during task administration, resulting in a final dataset of 144 DSM-IV ADHD combined-type probands and 125 of their nearest-age siblings. Fourteen siblings also received a research diagnosis of combined-type ADHD. Five sibling pairs included a third sib-ling and one included a fourth sibsib-ling so that the sample included 119 family clusters and 25 singletons.
Control sample
The control group was recruited from primary (ages 6–11 years) and secondary (ages 12–18 years) schools in London (UK) and Goettingen (Germany). Approval was obtained from local ethical review boards. The same exclusion cri-teria were applied as for the clinical sample. The Fast Task was administered to 68 children. One child did not provide IQ data and seven children were subsequently excluded because of technical problems with the portable laptops during task administration. The final control sample con-sisted of 60 children (22 family clusters and 15 singletons).
ADHD probands differed significantly
from the control group on sex [x2(1)=19.63, p<0.001] and IQ [t(201)=x2.00, p=0.05] but not on age [t(201)=1.66, p=0.10) (Table 1).
Additional phenotypic analyses were carried out controlling for IQ and on a male-only sub-sample.
Procedure
Clinical families were invited to the research centre for the cognitive assessments and for the parent interview. A minimum of a 48-h medi-cation-free period was required for cognitive testing. The assessments of the control families were carried out in separate rooms either at the research centre or in schools. The Fast Task was administered as part of an extended test battery and occurred in the middle of the session. Children were given short breaks as required and the total length of the test sessions, includ-ing breaks, was approximately 2.5–3 h.
Measures
Parental Account of Childhood Symptoms (PACS)
PACS is a semi-structured, standardized, inves-tigator-based interview developed as an instru-ment to provide an objective measure of child behaviour (Taylor et al. 1986 a, b, 1987). A trained interviewer administers PACS with parents, who are asked for detailed descriptions of the child’s typical behaviour in a range of specified situations. Interviewers make ratings on the basis of formal training and written definitions of the behaviours to be rated, using a four-point scale of severity and frequency in the previous week and previous year. Inter-rater reliability is high with product–moment corre-lations for pairs of interviewers ranging from 0.79 to 0.96 (Taylor et al. 1986 b). PACS was administered to all probands from the clinical sample as well as siblings with known or sus-pected ADHD from parent descriptions of their behaviour.
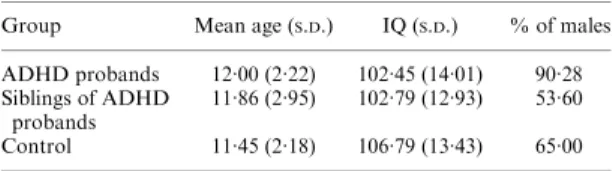
Table 1. Mean age(in years), IQ and percentage of males in each group
Group Mean age (S.D.) IQ (S.D.) % of males ADHD probands 12.00 (2.22) 102.45 (14.01) 90.28 Siblings of ADHD
probands
11.86 (2.95) 102.79 (12.93) 53.60 Control 11.45 (2.18) 106.79 (13.43) 65.00
IQ, Intelligence quotient ; ADHD, attention deficit hyperactivity disorder ;S.D., standard deviation.
Rating scales
Rating scales used to quantify ADHD symp-toms included the Long Version of Conners’ Parent Rating Scale (CPRS-R:L ; Conners et al. 1998 a) and the Long Version of Conners’ Teacher Rating Scale (CTRS-R:L ; Conners et al. 1998 b).
To exclude autism spectrum disorder both probands and siblings were screened using the Social Communication Questionnaire (o15) in conjunction with the pro-social scale from the Strengths and Difficulties Questionnaire (f4) (SDQ) (Goodman, 1997 ; Rothenberger & Woerner, 2004). Individuals falling above these thresholds were further evaluated using the autism spectrum disorder section of the PACS interview.
Research criteria for DSM-IV combined-type
ADHD(APA, 1994)
A standardized algorithm was applied to PACS items to derive each of the 18 DSM-IV ADHD items, providing operational definitions for each behavioural symptom. These were combined with items that scored 2 or 3 from the teacher-rated Conners’ ADHD subscale to generate the total number of items from the DSM-IV symptom checklist. Situational pervasiveness was defined as some symptoms occurring within two or more different situations from the PACS interview, or the presence of one or more symp-toms scoring 2 or more from the ADHD sub-scale of the teacher-rated Conners’. Referrals were for combined-type ADHD. If the PACS diagnosis did not agree with this, the individual was removed from the analysis. This happened in approximately 10 % of cases.
Wechsler Intelligence Scales for Children (WISC-III) (Wechsler, 1991 ; Tewes et al. 1999 ; Bleichrodt et al. 2002) and Adults (WAIS-III) (Wechsler, 1997)
The vocabulary, similarities, picture completion and block design subtests from the WISC/ WAIS were used to obtain an estimate of the child’s IQ (pro-rated following procedures de-scribed by Sattler, 1992).
The Fast Task(Kuntsi et al. 2005)
The baseline condition followed a standard warned four-choice RT task, as outlined in
Leth-Steensen et al. (2000). A warning signal (four empty circles, arranged side by side) first appeared on the screen. At the end of the fore-period (presentation interval for the warning signal), the circle designated as the target signal for that trial was filled (coloured) in. The child was asked to make a compatible choice by pressing the response key that directly corre-sponded in position to the location of the target stimulus. Following a response, the stimuli dis-appeared from the screen and a fixed inter-trial interval of 2.5 s followed. Speed and accuracy were emphasized equally. If the child did not respond within 10 s, the trial terminated.
First, a practice session was administered, during which the child had to respond correctly to five consecutive trials. The baseline condition, with a fore-period of 8 s and consisting of 72 trials, then followed.
To investigate the extent to which a response style characterized by slow and variable speed of responding can be maximally reduced, the task includes a comparison condition that uses a fast event rate (fore-period of 1 s) and incen-tives. This condition started immediately after the baseline condition and consisted of 80 trials (following the faster event rate conditions in Leth-Steensen et al. 2000) and a fixed inter-trial interval of 2.5 s. Speed and accuracy were emphasized equally. The children were told to respond really quickly one after another, to win smiley faces and earn real prizes in the end. The children won a smiley face for responding faster than their own MRT during the baseline (first) condition consecutively for three trials. The baseline MRT was calculated here based on the middle 94 % of responses (the exclusion of the top and bottom 3 % of responses is only used when calculating a baseline mean RT for the set-up of the fast-incentive condition, and is not used for analyses), therefore excluding extremely fast and extremely slow responses. The smiley faces appeared below the circles in the middle of the screen and were updated con-tinuously.
The response variables are MRT and stan-dard deviation of the RTs (S.D. of RTs ; RT
variability), calculated for each condition based on correct responses only. We also calculated an additional index of IV, the coefficient of variation (CV :S.D. of RTs/MRT). Whereas the
for MRT differences when analysing IV in ADHD is questionable (see Discussion), it has nonetheless been suggested that the CV is con-sidered as an additional measure (Klein et al. 2006). For analyses that compare performance across the baseline and fast-incentive con-ditions, data from 30 trials of the baseline condition are used, to provide a match on length of time on task with the fast-incentive condition. The second set of 30 trials are used for this, as data from a twin project suggest greater re-liability and heritability for the second than first set of 30 trials (Kuntsi & Asherson, un-published data), which is likely to reflect an in-itial learning phase during the first part of the baseline condition. The fast-incentive con-dition is always administered after the baseline condition and, as such, does not involve a simi-lar learning phase. The children earned small prizes (vouchers and stationery) after the task battery.
Analyses
Phenotypic analyses were conducted using Stata Statistical Software release 9.2 (Stata Corporation, College Station, TX, USA). All variables were significantly skewed and were transformed to normalize the distributions. The cluster command was used in phenotypic analyses of ADHD–control differences to re-move any effects of familial clustering. All sib-ling correlations and their respective confidence intervals were calculated using Mx (Neale, 1997). Bivariate sibling correlations were estimated using maximum likelihood procedures.
Phenotypic and bivariate sibling correlations This approach was based on the DeFries– Fulker (DF) extremes analysis of twin data (DeFries & Fulker, 1985, 1988). Bivariate sibling correlations are estimated from group means and are sometimes referred to as ‘ group corre-lations ’. See Appendix 2 for more detailed dis-cussion and Appendix 3 for a list of terms and definitions.
Equation (A1 ) (Appendix 1). To generate a
phenotypic correlation (bivariate group
within-subject correlation) between our selection
variable (ADHD) and a secondary variable (variable 2), we consider only the mean values of the two variables in ADHD probands and
population controls. If we observe a deviation from the population mean on the secondary variable in the probands, this is evidence for a correlation. Equation (A1) estimates the magnitude of the correlation.
Equation (A2) (Appendix 1). To estimate the bivariate sibling correlation (sibling cross-trait correlation), which provides an index of the shared familiality between ADHD and a secondary variable, we consider the adjusted mean values of the two variables in probands and siblings. If we observe a deviation from the population mean on the secondary variable in siblings, this is evidence for a familial corre-lation. Equation (A2) estimates the magnitude of the correlation.
RESULTS
Phenotypic analyses on ADHD–control differences
For the ADHD–control comparisons we ex-cluded individuals from the control group who obtained a T score of 63 or greater on the DSM-IV symptom scale on the parent and teacher Conners’. One such case was excluded. Is ADHD associated with RT variability and slow responding?
A regression model was used, with the RT vari-ables (MRT, S.D. of RTs, CV) entered as
re-sponse variables and group status (ADHD/ control) as the predictor variable. Effect sizes were calculated using Cohen’s d with pooled
standard deviations : d=M1xM2/spooled;
spooled=d[(s21+s22)/2] (Cohen, 1998). In the baseline condition the ADHD group, compared to the control group, had slower MRT [all trials : t(176)=x4.65, p<0.001, d=0.71; 30 trials : t(179)=x4.51, p<0.001, d=0.76], greater S.D. of RTs [all trials : t(176)=x5.92,
p<0.001, d=0.93; 30 trials: t(179)=x5.48, p<0.001, d=0.92] and CV [all trials: t(176)= x5.96, p<0.001, d=0.94; 30 trials: t(179)= x5.33, p<0.001, d=0.84]. ADHD probands
also had slower MRT [t(173)=x3.55,
p<0.001, d=0.54], greaterS.D. of RTs [t(173)=
x5.24, p<0.001, d=0.83] and CV [t(173)= x5.52, p<0.001, d=0.86] than the control group in the fast-incentive condition.
To examine whether the MRT effect (d=0.71, Table 2) could be secondary to the effect of
S.D. of RTs (d=0.93, Table 2), we conducted
additional ADHD–control comparisons on MRT, controlling for S.D. of RTs : the group
difference on MRT did not remain significant [t(176)=1.41, p=0.16, d=0.22]. By contrast, the ADHD–control group difference onS.D. of
RTs, when controlling for MRT, remained sig-nificant [t(176)=x3.93, p<0.001, d=0.67]. Is there significant improvement in speed and RT variability from baseline to fast-incentive condition, with greater improvement within the ADHD group compared to the control group? A regression model was used, with the difference score (baselinexfast-incentive) entered as the response variable and group (ADHD/control) as the predictor variable. Both groups improved significantly in MRT [ADHD : t(225)=20.27, p<0.001; controls: t(225)=13.30, p<0.001] and S.D. of RTs [ADHD : t(225)=11.96, p<
0.001 ; controls : S.D. t(225)=5.16, p<0.001]
from baseline to the fast-incentive condition. Significant improvement was found for CV in the ADHD group [t(225)=5.44, p<0.001] from baseline to the fast-incentive condition, but not for the control group [t(225)=1.48, p=0.14]. The ADHD group improved significantly more than the control group in MRT [t(225)=x3.57, p<0.001] and S.D. of RTs [t(225)=x2.50,
p<0.02] from baseline to the fast-incentive condition. The group difference in the degree of improvement across conditions for CV did
not reach significance [t(225)=x1.64, p=0.10]. Figs 1–3 show group means with 95 % confi-dence intervals for the ADHD and control groups, as well as those of the siblings of the ADHD probands, on each of the RT variables in both conditions.
We additionally carried out analyses on ADHD–control differences, (i) controlling for IQ and (ii) excluding girls, with the pattern of results staying the same (data not shown) with one exception. With girls excluded, the interac-tion effect for CV became significant, with the ADHD group improving significantly more than the control group from baseline to the fast-incentive condition [t(183)=x1.98, p<0.05]. Table 2. Shared familial effects on ADHD and performance on the Fast Task
Phenotypic correlation (95 % CI) Bivariate sibling correlation (95 % CI) Percentage of phenotypic correlation due to shared familial influencesa Baseline MRT Total sample 0.33 (0.26–0.40) 0.12 (0.02–0.22) 72 Male-only subsample 0.32 (0.19–0.47) 0.22 (0.07–0.37) >100 BaselineS.D. of RTs Total sample 0.40 (0.32–0.47) 0.13 (0.04–0.21) 63 Male-only subsample 0.41 (0.29–0.53) 0.21 (0.09–0.34) >100 Baseline CV Total sample 0.39 (0.32–0.47) 0.11 (0.04–0.19) 58 Male-only subsample 0.41 (0.30–0.52) 0.19 (0.08–0.30) 92
ADHD, Attention deficit hyperactivity disorder ; CI, confidence interval ; MRT, mean reaction time ;S.D., standard deviation ; RT, reaction time ; CV, coefficient of variation.
a Under the assumption that familial effects are entirely due to genetic effects (see Discussion) : percentage of phenotypic correlation due to shared familial influences=(2rbivariate sibling correlation)/phenotypic correlation.
Baseline Fast-incentive MRT 400 500 600 700 800 900 1000 1100 1200 Task condition
FIG. 1. Mean reaction time (MRT) in baseline and fast-incentive conditions (with 95 % confidence intervals) : ADHD probands (–$–), siblings of probands (–#–) and control group (–!–).
RT variables correlated with IQ in the range
of 0.00 tox0.30 for ADHD probands, x0.17
to x0.26 for siblings of ADHD probands,
andx0.07 to x0.32 for the control group. Phenotypic and bivariate sibling correlations The RT variables used in these analyses are those from the baseline condition, which were strongly associated with ADHD.
To calculate bivariate sibling correlations, both RT variables and ADHD scores were standardized. For ADHD scores, we obtained a mean from both parent and teacher Conners’
T scores for the DSM-IV total ADHD
symp-toms scale for the whole sample. As the Conners’ scale has a mean of 50, we subtracted 50 from the combined parent and teacher scores and then divided this score by the standard de-viation of 10. The Conners’ scale has a ceiling score of 90, so we replaced the scores at the ceiling (2.66667) by the expected value of a normal variate above the ceiling (2.97515). We followed the same formula to standardize the RT variables : we subtracted the mean and div-ided this score by the standard deviation of the control sample.
Phenotypic correlations ranging from 0.33 to 0.40 (Table 2) confirmed the association be-tween ADHD and RT performance. Bivariate sibling correlations on these variables ranged from 0.11 to 0.13 (Table 2), indicating shared familial effects on ADHD and RT performance. The position of the siblings’ scores in between
the scores for the ADHD and control groups is illustrated in Figs 1–3.
We also calculated the phenotypic corre-lations and sibling correcorre-lations for a male-only subsample (Table 2). Phenotypic correlations were similar in magnitude to the total sample. Bivariate sibling correlations were somewhat higher for the male-only subsample compared to the total sample.
Under the assumption of the familial effects representing genetic influences (see Discussion and Appendix 2), the proportion of the pheno-typic correlation between ADHD and the RT variable due to shared familial influences was estimated as 58–72 % for the entire sample and 92–100 % for the male-only subsample (Table 2, column 3).
DISCUSSION
With a large, international sibling-pair sample we investigated the stability of impairment in RT performance in ADHD across task conditions and its potential as a candidate endophenotype. First, the data confirmed the previous finding of an association between ADHD and slow and highly variable RTs (Oosterlaan & Sergeant, 1998 ; Kuntsi et al. 2001, 2005 ; Scheres et al. 2001 ; Banaschewski et al. 2003 ; Bellgrove et al. 2005 b ; Berwid et al. 2005 ; Drechsler et al. 2005 ; Klein et al. 2006).
The meaning of this association has been under much debate recently (Bellgrove et al. Baseline Fast-incentive RT variability 0 100 200 300 400 500 600 Task condition
FIG. 2. Reaction time (RT) variability in baseline and fast-incentive conditions (with 95 % confidence intervals) : ADHD probands (–$–), siblings of probands (–#–) and control group (–!–).
Baseline Fast-incentive CV 0.20 0.25 0.30 0.35 0.40 0.45 0.50 Task condition
FIG. 3. Coefficient of variation (CV) in baseline and fast-incentive conditions (with 95 % confidence intervals) : ADHD probands (–$–), siblings of probands (–#–) and control group (–!–).
2005 b ; Castellanos et al. 2005), but the lack of explicit, testable predictions continues to impede efforts to prove or falsify the proposed models. An overall distinction can be made between models that predict stable cognitive impair-ments in ADHD and those that predict fluctu-ating cognitive performance that is dependent on state factors, such as motivation or arousal, and that is greater than the fluctuations in cog-nitive performance observed in non-ADHD populations. Following the latter approach, we examined the extent to which RT variability (S.D. of RTs) and speed improve in ADHD
un-der a condition with fast presentation rate of stimuli and incentives. Confirming our second hypothesis, the ADHD group improved signifi-cantly more than the control group on both MRT and RT variability. This supports pre-vious studies that have tested the effects of event rate (Scheres et al. 2001) and incentives (Slusarek et al. 2001) separately. Whereas our study aimed to maximally optimize arousal/ activation state by combining the event rate and incentive manipulation within a single con-dition, in future research these could be studied separately to examine the differential effects of presentation rate of stimuli and incentives.
Although the performance of the ADHD group in the fast-incentive condition exceeded the control group’s baseline performance, dif-ferences between the groups remained in the fast-incentive condition because of further significant improvement across conditions for the control group. Previous studies have also reported that, although task manipulations improve performance of children with ADHD more than that of comparison groups, some differences can remain (Scheres et al. 2001 ; Wiersema et al. 2006). The state regulation account considers that any remaining group differences are due to the ADHD group not having reached a completely optimal arousal, activation or effort state (i.e. optimal manipu-lations can be difficult to achieve, especially as part of a lengthy testing session where fatigue effects may be involved). Alternatively, ad-ditional processes, such as aspects of executive function, may be involved (Nigg, 2005 ; reviewed in Kuntsi et al. 2006 a). It is not clear, however, how some theoretical accounts, such as that of temporal processing deficit (Castellanos
& Tannock, 2002) could explain greater
improvement in children with ADHD in con-ditions with a fast event presentation rate or incentives.
We used the CV as an additional index of IV, demonstrating its association with ADHD. This index reflects RT variability while simul-taneously ‘ controlling ’ for MRT differences. Yet the usefulness of this index in ADHD re-search is debatable, as ‘ controlling ’ for response slowing would not be appropriate if the same processes that cause variability also contribute to response slowing, as suggested, for example, by recent psychometric analyses (Klein et al. 2006). In other words, if there is a single cause for both the slow and variable RTs in ADHD, controlling for one removes part of the real variance being studied.
Our third hypothesis focused on the RT in-dices as a potential endophenotype in ADHD. For endophenotypes to be useful in psychiatric genetic research, they need to be familial and show shared familial effects with those on the disorder (Gottesman & Shields, 1973 ; Gottesman & Gould, 2003). Having calculated phenotypic correlations that, at 0.3–0.4, con-firmed the association between the ADHD and RT indices, we calculated bivariate sibling correlations using formulae that are presented here for the first time [based on the group heri-tability approach described by DeFries & Fulker (1985, 1988)].
The bivariate correlations (Table 2 ; column 2) can be interpreted in relation to the pheno-typic correlations under the assumption that the familial effects are due to genetic effects with no influence of shared environment. This is a reasonable assumption because previous twin studies indicate that familial influences on both ADHD (Faraone & Doyle, 2000) and RT per-formance (Kuntsi et al. 2006 b) are due largely to genetic effects with minimal effects of shared environment. Recent work on a population sample of 400 twin pairs (ages 7–9) shows heritabilities of 55 % for MRT and 37 % for RT variability for the baseline condition of the Fast Task, with no shared environmental contribution (Kuntsi et al. 2006 b), and absence of shared environmental effects on ADHD has been reported in most twin studies to date (reviewed in Thapar et al. 1999).
Under this assumption we can estimate that the percentage of the phenotypic correlation
that is due to shared familial effects on ADHD and RT performance is around 60–70 % for the whole sample and 90–100 % for the male-only subsample (Table 2, column 3). The finding of shared familial influences on ADHD and RT performance confirms and extends the findings from the two initial studies (Kuntsi & Stevenson, 2001 ; Nigg et al. 2004).
Although these findings suggest that the finding in this study of familiality between ADHD and RT performance is likely to be due to genetic influences, the study design using fraternal siblings does not enable us to be entirely confident in this conclusion. Further studies using twin designs are therefore needed to clarify the proportion of shared genetic and environmental influences involved in the fam-ilial effects observed in this study.
Another consideration is the use of the DF approach and our study design of using ADHD probands and siblings, which focuses on the tail of the distribution rather than necessarily being representative of the entire population. Barring any major variance–covariance differences, the evidence presented in this paper indicates that shared familial effects appear to be the major constituent component of the phenotypic cor-relations between ADHD and each of the vari-ables investigated, and this is likely to generalize to quantitative genetic analyses within popu-lation twin samples.
An additional influence on estimates from quantitative genetic analyses is measurement error, which is inherent to cognitive testing (see Kuntsi et al. 2006 b for further discussion). However, as measurement error will lead to underestimates of familial influences, the current estimates can be considered to be encouraging.
A limitation of the study is that we did not achieve a perfect match between the groups on gender. However, additional analyses on the male-only subsample indicated similar pheno-typic results (with the exception of group interaction on CV improvement becoming sig-nificant). For the familial data the sibling corre-lations for most variables were somewhat higher for the male-only subsample compared to the total sample, but further investigation is required to determine the potential significance of this.
Whereas the findings were overall relatively similar for both MRT and RT variability, the association with ADHD in the baseline
condition was slightly stronger for RT varia-bility than MRT (phenotypic correlations of 0.4 and 0.3 respectively). When controlling for RT variability, the group difference in MRT dis-appeared. This supports the suggestion by Klein et al. (2006) that the processes that give rise to RT variability are also likely to contribute to response slowing (rather than vice versa).
The role of RT variability as an intermediate phenotype between genes and behaviour is sup-ported by preliminary data, suggesting a poten-tial association with genetic variation of the dopamine transporter gene DAT1 (Loo et al. 2003 ; Bellgrove et al. 2005 a). In our planned future analyses we intend to investigate more fully the relationship between cognitive endo-phenotypes, for which we have evidence of shared familial influences with ADHD, and gen-etic variants associated with the clinical disorder. APPENDIX 1
Formulae used to calculate phenotypic [equation (A1)] and bivariate [equation (A2)] sibling correlations
mvar2proxmvar2pop
mADHDproxmADHDpop
, (A1)
where mvar2pro is the mean of variable 2 in the
probands, mvar2popis the mean of variable 2 in
the population,mADHDprois the mean of ADHD
in the probands, andmADHDpopis the mean of
ADHD in the population. Both variables are measured in standard deviation units.
mvar2sibxmvar2pop
mADHDproxmADHDpop
, (A2)
where mvar2sib is the mean of variable 2 in the
siblings of probands (variances of the selection variable and the secondary variable have been equated).
APPENDIX 2
Conceptual underpinnings of bivariate DeFries–Fulker (DF) analysis : application to sibling data
As only siblings are present in our sample, we are restricted to estimating the sibling correlation, rather than the contribution of genes (A) and shared environment (C) to the variance. The
sibling correlation, which we term familiality (F), is theorized to be half A plus C, as siblings on average share half their genome and share common environment completely. The exten-sion of the DF extremes analysis to a secondary phenotype has a number of potential limitations explained in more detail below.
The aim of univariate DF extremes analysis (analysis of the selected phenotype) is to use selection and correlational structure to decom-pose the variance for siblings into familial and non-shared environment or measurement error. The heavy selection on the proband aims to ensure that for each effect on the phenotype (e.g. a genetic effect such as a specific risk allele), the proband carries the high-risk version. This extreme selection on the proband partially se-lects on the family members for anything that is shared between family members. However, as the correlation between siblings is less than 1, the mean of the sibling regresses back to the population mean. Furthermore, the weaker the familiality, the larger the regression of the sibling mean back to the population mean. For the example of a genetic effect on familiality, the sibling of a proband has a 50 % chance of sharing the risk allele present in the proband ‘ identical-by-descent ’ (i.e. inheriting the same maternal or paternal chromosome). If no familial effects were present, then selection on
one sibling would yield no change in the mean of the other siblings and the sibling mean would therefore equal the population mean.
In the same way that the extremes analysis works for siblings when considering the selec-tion variable (ADHD in this study), there is selection on a secondary phenotype collected in the proband if the secondary phenotype corre-lates with the selection phenotype. The sources of this correlation are shared effects : this can be due to genetic effect implying pleiotropy (multi-ple phenotypic effects from a single variant) or some shared environmental effect between the two. However, rather than having a theoretical framework for the source of this correlation (such as F and E or A, C and E), we can only estimate its magnitude using the same metric of regression back to the mean. This correlation is the phenotypic correlation between the two traits.
Finally, this correlation can be decomposed into familial and environmental effects by exam-ining the regression back to the population mean of the mean of the sibling of the proband. However, the magnitude of the phenotypic correlation has an effect on the power of the
decompositions, with smaller correlations
yielding less power for the analysis.
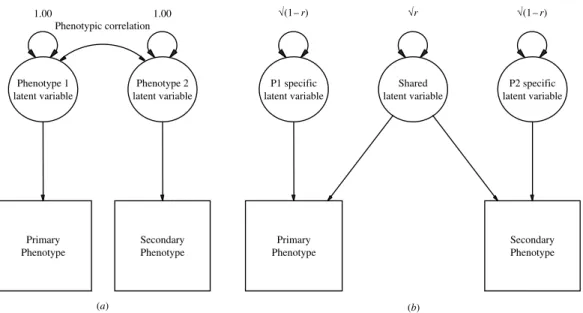
Fig. A1 shows two path diagrams that are
equivalent and represent the relationship
Primary Phenotype Secondary Phenotype 1.00 Phenotype 1 latent variable 1.00 Phenotype 2 latent variable Phenotypic correlation Primary Phenotype Secondary Phenotype P1 specific latent variable Shared latent variable √(1– r) √r P2 specific latent variable √(1– r) (a) (b)
FIG. A1. Path diagrams for the relationship between two phenotypes that correlate. r is the phenotypic correlation between the two latent variables.
between the primary and secondary phenotypes. Fig. A1(a) represents the traditional drawing of a phenotypic correlation, with a correlation path on the latent variables. Fig. A1(b) decom-poses the Phenotype 1 latent variable and Phenotype 2 latent variable into that which is shared and that which is specific to each pheno-type. The shared variance in Fig. A1(b) is what is being decomposed in using DF extremes analysis for the secondary phenotype.
What is important in this study, however, is what can be determined about the part of the phenotypic structure that does correlate, as we want to estimate the extent to which familial influences explain the phenotypic correlation between ADHD and the secondary variables ; and this is the portion of variance in which we can be more confident of our estimates. In the proband–sibling design, common environmen-tal effects are shared between the siblings com-pletely, whereas genetic effects are on average shared 50 % of the time because sibling pairs
share on average half of their parental chromo-somes. As we know from twin studies of ADHD (Thapar et al. 1999 ; Biederman & Faraone, 2002) that 60–90 % of the variance in trait scores is due to genetic effects and there is little or no contribution from the shared environment (Faraone & Doyle, 2000), we can say that any familial correlation between ADHD and a sec-ondary phenotype (cross-sibling cross-trait correlation) is likely to be genetic in nature. In addition, the recent twin study using the same Fast Task protocol indicated a moderate degree of heritability for baseline RT performance, with no shared environmental contribution (Kuntsi et al. 2006 b). As a result, we can esti-mate that the proportion of the phenotypic correlation is explained by shared familial in-fluences. In this study we found that around 72 % and 63 % of the phenotypic correlation
between baseline MRT and S.D. of RTs
respectively were the result of shared familial influences.
APPENDIX 3
Definitions, methods of estimation and terminology
Name Definition Method of estimation Terminology
Phenotypic correlation Correlation between two phenotypes in the same subject. In classical twin studies this is termed a within-twin cross-trait correlation
The ratio of the deviation from the population mean of the group mean in the secondary variable of the probands to the deviation from the population mean of the group mean in the primary variable of the probandsa
Bivariate group within-subject correlation
Shared familiality or cross-sibling cross-trait correlation
Correlation between siblings for two phenotypes. It is analogous to a dizygotic cross-twin cross-trait correlation in a twin study
The ratio of the deviation from the population mean of the group mean in the secondary variable of the siblings to the deviation from the population mean of the group mean in the primary variable in the probandsa
Bivariate sibling correlation
Percentage of phenotypic correlation due to shared familial effects
(2rbivariate familial correlation)/phenotypic correlation. This assumes that familial correlation is accounted for entirely by additive genesb a
The variances of the selection variable and the secondary variable have been equated. b
The percentage of phenotypic correlation due to additive genetic effects only holds in instances where the variance–covariance structure of the primary phenotype is known unequivocally.
ACKNOWLEDGEMENTS
We thank the IMAGE teams from London, Essen, Ghent, Goettingen, Petach-Tikva and Zurich, and the families and schools for their participation. Sample recruitment of the ADHD
sample was supported by NIMH Grant
R01MH062873 to S. Faraone. The IMAGE-London cognitive endophenotype research is funded by UK Medical Research Council grant G0300189 to J. Kuntsi.
DECLARATION OF INTEREST None.
REFERENCES
APA (1994). Diagnostic and Statistical Manual of Mental Disorders (4th edn) (DSM-IV). American Psychiatric Association : Washington, DC.
Banaschewski, T., Brandeis, D., Heinrich, H., Albrecht, B., Brunner, E. & Rothenberger, A. (2003). Association of ADHD and conduct disorder – brain electrical evidence for the existence of a distinct subtype. Journal of Child Psychology and Psychiatry and Allied Disciplines 44, 356–376.
Bellgrove, M. A., Hawi, Z., Kirley, A., Fitzgerald, M., Gill, M. & Robertson, I. H. (2005 a). Association between dopamine trans-porter (DAT1) genotype, left-sided inattention, and an enhanced response to methylphenidate in attention-deficit hyperactivity dis-order. Neuropsychopharmacology 30, 2290–2297.
Bellgrove, M. A., Hawi, Z., Kirley, A., Gill, M. & Robertson, I. H. (2005 b). Dissecting the attention deficit hyperactivity disorder (ADHD) phenotype : sustained attention, response variability and spatial attentional asymmetries in relation to dopamine trans-porter (DAT1) genotype. Neuropsychologia 43, 1847–1857. Berwid, O. G., Curko Kera, E. A., Marks, D. J., Santra, A.,
Bender, H. A. & Halperin, J. M. (2005). Sustained attention and response inhibition in young children at risk for Attention Deficit/ Hyperactivity Disorder. Journal of Child Psychology and Psychiatry and Allied Disciplines 46, 1219–1229.
Biederman, J. & Faraone, S. V. (2002). Current concepts on the neurobiology of Attention-Deficit/Hyperactivity Disorder. Jour-nal of Attention Disorders 6 (Suppl. 1), S7–S16.
Bleichrodt, N., Bosmans, M., Compaan, E. L., Kort, W., Resing, W. C. M., Schittekatte, M., Verhaeghe, P. & Vermeir, G. (2002). WISC-III NL Manual. NIP Dienstencentrum : Amsterdam. Borger, N. & van der Meere, J. (2000). Motor control and state
regulation in children with ADHD : a cardiac response study. Biological Psychology 51, 247–267.
Brookes, K., Xu, X., Chen, W., Zhou, K., Neale, B., Lowe, N., Anney, R., Franke, B., Gill, M., Ebstein, R., Buitelaar, J., Sham, P., Campbell, D., Knight, J., Andreou, P., Altink, M., Arnold, R., Boer, F., Buschgens, C., Butler, L., Christiansen, H., Feldman, L., Fleischman, K., Fliers, E., Howe-Forbes, R., Goldfarb, A., Heise, A., Gabriels, I., Korn-Lubetzki, I., Johansson, L., Marco, R., Medad, S., Minderaa, R., Mulas, F., Muller, U., Mulligan, A., Rabin, K., Rommelse, N., Sethna, V., Sorohan, J., Uebel, H., Psychogiou, L., Weeks, A., Barrett, R., Craig, I., Banaschewski, T., Sonuga-Barke, E., Eisenberg, J., Kuntsi, J., Manor, I., McGuffin, P., Miranda, A., Oades, R. D., Plomin, R., Roeyers, H., Rothenberger, A., Sergeant, J., Steinhausen, H. C., Taylor, E., Thompson, M., Faraone, S. V. & Asherson, P. (2006). The analysis of 51 genes in DSM-IV combined type attention deficit
hyperactivity disorder : association signals in DRD4, DAT1 and 16 other genes. Molecular Psychiatry 11, 934–953.
Burd, L., Klug, M. G., Coumbe, M. J. & Kerbeshian, J. (2003). Children and adolescents with attention deficit-hyperactivity dis-order : 1. Prevalence and cost of care. Journal of Child Neurology 18, 555–561.
Cantwell, D. P. (1975). Genetic studies of hyperactive children : psy-chiatric illness in biologic and adopting parents. Proceedings of the Annual Meeting of the American Psychopathological Association 63, 273–280.
Castellanos, F. X., Sonuga-Barke, E. J., Scheres, A., Di Martino, A., Hyde, C. & Walters, J. R. (2005). Varieties of attention-deficit/ hyperactivity disorder-related intra-individual variability. Biologi-cal Psychiatry 57, 1416–1423.
Castellanos, F. X. & Tannock, R. (2002). Neuroscience of attention-deficit/hyperactivity disorder : the search for endophenotypes. Nature Reviews. Neuroscience 3, 617–628.
Cohen, J. (1998). Statistical Power Analysis for the Behavioral Sciences. Lawrence Earlbaum Associates : Hillsdale, NJ. Conners, C. K., Sitarenios, G., Parker, J. D. & Epstein, J. N. (1998 a).
The revised Conners’ Parent Rating Scale (CPRS-R) : factor structure, reliability, and criterion validity. Journal of Abnormal Child Psychology 26, 257–268.
Conners, C. K., Sitarenios, G., Parker, J. D. & Epstein, J. N. (1998 b). Revision and restandardization of the Conners’ Teacher Rating Scale (CTRS-R) : factor structure, reliability, and criterion validity. Journal of Abnormal Child Psychology 26, 279–291. DeFries, J. C. & Fulker, D. W. (1985). Multiple regression analysis
of twin data. Behavior Genetics 15, 467–473.
DeFries, J. C. & Fulker, D. W. (1988). Multiple regression analysis of twin data : etiology of deviant scores versus individual differ-ences. Acta Geneticae Medicae et Gemellologiae 37, 205–216. Drechsler, R., Brandeis, D., Foldenyi, M., Imhof, K. & Steinhausen,
H. C. (2005). The course of neuropsychological functions in chil-dren with attention deficit hyperactivity disorder from late child-hood to early adolescence. Journal of Child Psychology and Psychiatry and Allied Disciplines 46, 824–836.
Faraone, S. V., Biederman, J., Mennin, D., Russell, R. & Tsuang, M. T. (1998). Familial subtypes of attention deficit hyperactivity disorder : a 4-year follow-up study of children from antisocial-ADHD families. Journal of Child Psychology and Psychiatry and Allied Disciplines 39, 1045–1053.
Faraone, S. V. & Doyle, A. E. (2000). Genetic influences on attention deficit hyperactivity disorder. Current Psychiatry Reports 2, 143–146.
Faraone, S. V., Monuteaux, M. C., Biederman, J., Cohan, S. L. & Mick, E. (2003). Does parental ADHD bias maternal reports of ADHD symptoms in children ? Journal of Consulting and Clinical Psychology 71, 168–175.
Faraone, S. V., Perlis, R. H., Doyle, A. E., Smoller, J. W., Goralnick, J. J., Holmgren, M. A. & Sklar, P. (2005). Molecular genetics of attention-deficit/hyperactivity disorder. Biological Psychiatry 57, 1313–1323.
Ford, T., Goodman, R. & Meltzer, H. (2003). The British Child and Adolescent Mental Health Survey 1999 : the prevalence of DSM-IV disorders. Journal of the American Academy of Child and Adolescent Psychiatry 42, 1203–1211.
Goldman, L. S., Genel, M., Bezman, R. J. & Slanetz, P. J. (1998). Diagnosis and treatment of attention-deficit/hyperactivity dis-order in children and adolescents. Journal of the American Medical Association 279, 1100–1107.
Goodman, R. (1997). The Strengths and Difficulties Questionnaire : a research note. Journal of Child Psychology and Psychiatry and Allied Disciplines 38, 581–586.
Gottesman, I. I. & Gould, T. D. (2003). The endophenotype concept in psychiatry : etymology and strategic intentions. American Journal of Psychiatry 160, 636–645.
Gottesman, I. I. & Shields, J. (1973). Genetic theorizing and schizo-phrenia. British Journal of Psychiatry 122, 15–30.
Heinrich, H., Moll, G. H., Dickhaus, H., Kolev, V., Yordanova, J. & Rothenberger, A. (2001). Time-on-task analysis using wavelet
networks in an event-related potential study on attention-deficit hyperactivity disorder. Clinical Neurophysiology 112, 1280–1287. Klein, C., Wendling, K., Huetter, P. & Peper, M. (2006). Intra-subject
variability in attention-deficit hyperactivity disorder (ADHD). Biological Psychiatry 60, 1088–1097.
Konrad, K., Gauggel, S., Manz, A. & Scholl, M. (2000). Lack of in-hibition : a motivational deficit in children with attention deficit/ hyperactivity disorder and children with traumatic brain injury. Child Neuropsychology 6, 286–296.
Kuntsi, J., Andreou, P., Ma, J., Borger, N. A. & van der Meere, J. J. (2005). Testing assumptions for endophenotype studies in ADHD : reliability and validity of tasks in a general population sample. BMC Psychiatry 5, 40.
Kuntsi, J., McLoughlin, G. & Asherson, P. (2006 a). Attention deficit hyperactivity disorder. Neuromolecular Medicine 8, 461–484. Kuntsi, J., Oosterlaan, J. & Stevenson, J. (2001). Psychological
me-chanisms in hyperactivity : I. Response inhibition deficit, working memory impairment, delay aversion, or something else ? Journal of Child Psychology and Psychiatry and Allied Disciplines 42, 199–210.
Kuntsi, J., Rogers, H., Swinard, G., Bo¨rger, N., van der Meere, J., Rijsdijk, F. & Asherson, P. (2006 b). Reaction time, inhibition, working memory and ‘ delay aversion ’ performance : genetic in-fluences and their interpretation. Psychological Medicine 36, 1613–1624.
Kuntsi, J. & Stevenson, J. (2001). Psychological mechanisms in hy-peractivity : II. The role of genetic factors. Journal of Child Psychology and Psychiatry and Allied Disciplines 42, 211–219. Leth-Steensen, C., King Elbaz, Z. & Douglas, V. I. (2000). Mean
response times, variability, and skew in the responding of ADHD children : a response time distributional approach. Acta Psycho-logica 104, 167–190.
Li, D., Sham, P. C., Owen, M. J. & He, L. (2006). Meta-analysis shows significant association between dopamine system genes and attention deficit hyperactivity disorder (ADHD). Human Mol-ecular Genetics 15, 2276–2284.
Loo, S. K., Specter, E., Smolen, A., Hopfer, C., Teale, P. D. & Reite, M. L. (2003). Functional effects of the DAT1 polymorphism on EEG measures in ADHD. Journal of the American Academy of Child and Adolescent Psychiatry 42, 986–993.
Mason, D. J., Humphreys, G. W. & Kent, L. (2005). Insights into the control of attentional set in ADHD using the attentional blink paradigm. Journal of Child Psychology and Psychiatry and Allied Disciplines 46, 1345–1353.
Mason, D. J., Humphreys, G. W. & Kent, L. S. (2003). Exploring selective attention in ADHD : visual search through space and time. Journal of Child Psychology and Psychiatry and Allied Disciplines 44, 1158–1176.
Neale, M. (1997). Mx : Statistical Modeling. Department of Psychiatry : Richmond, VA.
Nigg, J. T. (2005). Neuropsychologic theory and findings in atten-tion-deficit/hyperactivity disorder : the state of the field and salient challenges for the coming decade. Biological Psychiatry 57, 1424–1435.
Nigg, J. T., Blaskey, L. G., Stawicki, J. A. & Sachek, J. (2004). Evaluating the endophenotype model of ADHD neuropsycholo-gical deficit : results for parents and siblings of children with
ADHD combined and inattentive subtypes. Journal of Abnormal Psychology 113, 614–625.
Oosterlaan, J. & Sergeant, J. A. (1998). Response inhibition and re-sponse re-engagement in attention-deficit/hyperactivity disorder, disruptive, anxious and normal children. Behavioural Brain Research 94, 33–43.
Rothenberger, A. & Woerner, W. (2004). Strengths and Difficulties Questionnaire (SDQ) – evaluations and applications. European Child and Adolescent Psychiatry 13 (Suppl. 2), II1–2.
Sattler, J. M. (1992). Assessment of Children : WISC-III and WPPSI-R Supplement. Jerome M. Sattler : San Diego, CA.
Scheres, A., Oosterlaan, J. & Sergeant, J. A. (2001). Response execution and inhibition in children with AD/HD and other dis-ruptive disorders : the role of behavioural activation. Journal of Child Psychology and Psychiatry and Allied Disciplines 42, 347–357.
Sergeant, J. (2000). The cognitive-energetic model : an empirical approach to attention-deficit hyperactivity disorder. Neuroscience and Biobehavioral Reviews 24, 7–12.
Sergeant, J. A., Geurts, H., Huijbregts, S., Scheres, A. & Oosterlaan, J. (2003). The top and the bottom of ADHD : a neuropsycholo-gical perspective. Neuroscience and Biobehavioral Reviews 27, 583–592.
Slusarek, M., Velling, S., Bunk, D. & Eggers, C. (2001). Motivational effects on inhibitory control in children with ADHD. Journal of the American Academy of Child and Adolescent Psychiatry 40, 355–363.
Taylor, E., Everitt, B., Thorley, G., Schachar, R., Rutter, M. & Wieselberg, M. (1986 a). Conduct disorder and hyperactivity : II. A cluster analytic approach to the identification of a behavioural syndrome. British Journal of Psychiatry 149, 768–777.
Taylor, E., Schachar, R., Thorley, G., Wieselberg, H. M., Everitt, B. & Rutter, M. (1987). Which boys respond to sti-mulant medication ? A controlled trial of methylphenidate in boys with disruptive behaviour. Psychological Medicine 17, 121– 143.
Taylor, E., Schachar, R., Thorley, G. & Wieselberg, M. (1986 b). Conduct disorder and hyperactivity : I. Separation of hyperactivity and antisocial conduct in British child psychiatric patients. British Journal of Psychiatry 149, 760–767.
Tewes, U., Rossmann, P. & Schallenberger, U. (1999). Hamburg-Wechsler Intelligence Test for Children III (HAWIK-III) [in German]. Huber : Bern.
Thapar, A., Holmes, J., Poulton, K. & Harrington, R. (1999). Genetic basis of attention deficit and hyperactivity. British Journal of Psychiatry 174, 105–111.
van der Meere, J. (2002). The role of attention. In Hyperactivity and Attention Disorders of Childhood(ed. S. Sandberg), pp. 162–213. Cambridge University Press : Cambridge.
Wechsler, D. (1991). Wechsler Intelligence Scale for Children. The Psychological Corporation : London.
Wechsler, D. (1997). Wechsler Intelligence Scale for Adults. The Psychological Corporation : London.
Wiersema, R., van der Meere, J., Roeyers, H., Van Coster, R. & Bayens, D. (2006). Event rate and event-related potentials in ADHD. Journal of Child Psychology and Psychiatry and Allied Disciplines 47, 560–567.