UNIVERSITÉ DE MONTRÉAL
DEVELOPMENT OF A DYNAMIC MODEL TO DESCRIBE
CHO CELLS METABOLIC NETWORK AND REGULATION
ATEFEH GHORBANIAGHDAM DÉPARTEMENT DE GÉNIE CHIMIQUE ÉCOLE POLYTECHNIQUE DE MONTRÉAL
THÈSE PRÉSENTÉE EN VUE DE L’OBTENTION DU DIPLÔME DEPHILOSOPHIAE DOCTOR
(GÉNIE CHIMIQUE) AOÛT 2013
UNIVERSITÉ DE MONTRÉAL
ÉCOLE POLYTECHNIQUE DE MONTRÉAL
Cette thèse intitulée:
DEVELOPMENT OF A DYNAMIC MODEL TO DESCRIBE CHO CELLS METABOLIC NETWORK AND REGULATION
présentée par : GHORBANIAGHDAM Atefeh
en vue de l’obtention du diplôme de : Philosophiæ doctor a été dûment acceptée par le jury d’examen constitué de :
M. PERRIER Michel, Ph. D., président
M. JOLICOEUR Mario, Ph. D., membre et directeur de recherche M. HENRY Olivier, Ph. D., membre et codirecteur de recherche M. SRINIVASAN, Bala, Ph. D., membre
iii
iv
ACKNOWLEDGMENTS
This study was supported financially by the Natural Sciences and Engineering Research Council of Canada (NSERC) and Monoclonal Antibody Network (MabNet). There are many to thank, and I wish to sincerely acknowledge everybody who has contributed to this work in one way or another. Specially:
I would like to express my most warmly appreciation to my advisor, Professor Mario Jolicoeur, for his valuable guidance, thoughtful advice, continuous support, constant encouragement and for always being there for me throughout the fulfillment of this work. I also would like to express my appreciation to my co-advisor, Professor Olivier Henry for his valuable guidance, his continuous support, and for sharing knowledge with me. I warmly thank my colleagues in the lab for their kindness, great help and support throughout the hard times of the work. Special thanks to Zahra Sheikholeslami for sharing her knowledge with me, for helpful discussions and for her generous nature. Many special thanks to JingkuiChenfor his valuable chemical analyses.
Also, I would like to thank Professor Hector Budman, Professor Bala Srinivasan, and Professor Michel Perrier for accepting to evaluate my PhD thesis.
Last but not least, I would like to thank my friends and my family for their never ending support. Special thanks to my brother who always cheered me up during though times although miles away from me.
Finally, I really don’t know how to thank my parents for all I am or I hope to be is because of them. Enough to say that I so believe they are the main authors of this thesis.
v
RÉSUMÉ
L'objectif principal de ce travail est de démontrer qu'une approche de modélisation dynamique peut être utile pour comprendre le comportement du métabolisme central du carbone des cellules CHO. La première partie de ce travail se concentre sur le développement d'un modèle dynamique de cellules CHO du métabolisme primaire. Ce travail a été inspiré par un modèle cinétique métabolique auparavant développé dans notre groupe pour décrire le métabolisme cellulaire primaire decellules de plante. Le modèle métabolique a été développé et calibré à l'aide de données obtenues au préalable par notre groupe dans des cultures de cellules CHO produisant un activateur du tissu plasminogène recombinant en bioréacteur. En plus des données de base, telles les concentrations en biomasse, en glucose, en lactate, en glutamine et en ammoniac, les concentrations intracellulaires de plusieurs nucléotides et la consommation d'oxygène par cellule étaient également disponibles.
Le principal résultat de cette partie consiste en un modèle métabolique cinétique qui permet de décrire le comportement des voies métaboliques majeures dans les cellules CHO, c'est-à-dire la glycolyse, la voie des pentoses phosphate, le cycle des acides tricarboxyliques, la glutaminolyse ainsi que la respiration cellulaire. Le modèle possède 30 réactions et plus de 72 paramètres. Les simulations obtenues à l'aide du modèle permettent de décrire les données expérimentales, ce qui suggère que la structure proposée du modèle est en accord avec le fonctionnement biologique des cellules CHO. Le modèle a également été utilisé pour étudier l'effet qu'a l'induction par le butyrate de sodium sur une culture de cellules CHO, celui-ci étant un produit chimique couramment utilisé pour augmenter la production spécifique de protéines recombinantes. En considérant le nombre élevé de paramètres, l'adaptation du modèle a été minime, nécessitant le changement de seulement quelques paramètres, en accord avec les modifications de l'expression des gènes rapportées pour décrire l'effet du butyrate de sodium sur des cellules CHO.
Bien que principalement spéculatifs tout en reposant sur des simulations du modèle, les résultats concordent avec les données ainsi qu'avec les hypothèses issues de la littérature concernant l'effet du butyrate de sodium sur le métabolisme des cellules CHO.
vi
Dans une seconde partie, la capacité descriptive du modèle a également été évaluée à l'aide de données provenant d'une autre lignée cellulaire CHO recombinante cultivée à des conditions de culture différentes. Le modèle a été testé pour simuler des cultures discontinues de différents clones d'une lignée de cellules CHO ayant été génétiquement modifiée pour posséder un système d'expression inductible utilisant le cumate comme agent inducteur et permettant la production d'anticorps monoclonaux anti-CD 20. Une lignée présentant unefaible production spécifique et une lignée possédant une plus haute production ont été comparées à la lignée parentale. De plus, il a été possible d'augmenter le nombre de métabolites extracellulaires et intracellulaires à l'étude. Il a été démontré que la structure du modèle permet à celui-ci de facilement s'adapter à une autre lignée cellulaire CHO et ses clones, en ne nécessitant encore une fois qu'un nombre limité de modifications au modèle, qui ont été interprétés et analysés comme caractéristiques de lignées cellulaires spécifiques. La portée du modèle a été étendue ici de manière à décrire aussi le métabolisme des acides aminés et de la production d’anticorps. Il comprend donc maintenant 35 réactions et 92 paramètres. Toutefois, une modification limitée, c'est-à-dire trois et cinq paramètres pour la lignée à faible production et celle à production élevée respectivement, a permis des simulations qui décrivent avec précision les différences sur le plan métaboliques liées à la variation clonale. En se fiant à nos résultats, il est clair que ce modèle dynamique peut être facilement adapté à l'ensemble des cultures existantes. Enfin, dans la troisième partie de la thèse, le comportement du modèle a été étudié tout en intégrant la régulation métabolique de la glycolyse. Le but de cette étude était d'évaluer dans quelle mesure notre modèle cinétique peut décrire l'effet d'une perturbation soudaine sur le comportement du métabolisme cellulaire, tout en ayant été calibré à l'aide des données de culture montrant une dynamique lente. Les mécanismes de régulation connus de la glycolyse des cellules de mammifères, tels que les mécanismes d'inhibition par rétroaction, par anticipation et les mécanismes d'activation par des métabolites glycolytiques et les variables énergétiques ont été intégrés dans le modèle. Une expérience in silico a été réalisée en ajoutant un stress hypoxique soudain, diminuant à 10% de saturation de l'air. Le modèle a ensuite été modifié pour inclure l'effet de sept fonctions de régulation, à savoir l'inhibition par anticipation ou par rétroaction et l'activation de métabolites de la glycolyse et l'activation par rétroaction de l'état
vii
énergétique de la cellule, dans la voie de la glycolyse avec un paramètre pour chaque cas. Fait intéressant, la structure du modèle avec la glycolyse régulée résulte à la simulation du passage d'un métabolisme de phosphorylation oxydative à un métabolisme de la glycolyse anaérobique, un résultat qui est en accord avec la littérature. Le modèle développé a ainsi montré une capacité prédictive. En conclusion, ce travail a abouti à un modèle dynamique décrivant le comportement du métabolisme des cellules CHO, et qui pourrait être utile comme outil in silico pour l'optimisation des bioprocédés.
viii
ABSTRACT
The main objective of the work was to demonstrate that a dynamic modelling approach can be useful to elucidate the behaviour of CHO cells’ central carbon metabolism. The first part of this work focuses on the development of a dynamic model of CHO cells primary metabolism.This work was inspired by a previously developed kinetic metabolic model in our group to describe plant cell primary metabolism. The metabolic model was developed and calibrated using data previously obtained in our group from bioreactor cultures of CHO cells expressing recombinant t-PA. In addition to routine datasets, including the concentration of cells, glucose, lactate, glutamine and ammonia with time, intracellular concentrations of energetic nucleotides and cell specific oxygen consumption were also available. The main outcome of this part consists in a kinetic metabolic model that allows describing the behaviour of the major metabolic pathways, i.e. glycolysis, pentose phosphate pathway, TCA cycle, glutaminolysis as well as cell respiration,in CHO cells. The model has 30 metabolic reactions and 72 parameters. Model simulations were shown to agree with experimental data, which is suggesting that the proposed model structure copes with CHO cells’ biology. The model was also used for studying the effect of inducing CHO cell culture by adding sodium butyrate, a widely used chemical to enhance recombinant protein production. Albeit the high number of parameters, limited model adaptation was required (i.e. the changing of only few parameters values), in agreement with gene expression modifications reported in literature, to describe the effect of sodium butyrate on CHO cells. Results from model simulations further supports our previous findings that butyrate treatment at mid exponential phase may induce a shift in cellular metabolism by increasing the efficiency of glucose utilization, with a greater fraction of this nutrient channeled through TCA cycle. Although mostly speculative while based on model simulations, the results agreed with data as well as common hypothesis found in literature of the effect of sodium butyrate on CHO cell metabolism.
In a second part, the descriptive capacity of the model was further assessed using data from another recombinant CHO cell line under different culture conditions. The model was then challenged to simulate batch cultures for different clones of a CHO cell line genetically modified with an inducible expression system, called the cumate gene-switch,
ix
for the production of anti CD-20 monoclonal antibody. Low- and high-producer cell lines were compared to parental. The extra- and intra-cellular metabolites quantification was also included in the study. The model structure showed to be easily adaptableto another CHO cell line and its clones, by only requiring limited model modifications, which were interpreted and analysed as specific cell line characteristics. The model was extended hereto also describe amino acids metabolism and recombinant monoclonal antibody production kinetics. It thus now includes 35 reactions and 92 parameters. However, limited modification, i.e. changing few parameters in both low-and high-producing clones, allowed simulations that accurately described metabolic variations related to clonal variation. Different patterns of metabolic flux distribution specially in high-producer clone was simulated by the model and the increased efficiency of cell metabolism, i.e. greater portion of glucose incorporated into the TCA as opposed to being converted to lactate, and up regulation of TCA cycle, has shown to be more induced by clonal variation than by recombinant protein induction. From our results, it is clear that such dynamic model can be readily adapted to existing culture datasets. Finally, in a third part of the thesis, model behaviour was studied while integrating metabolic regulation of glycolysis. The aim of that study was to evaluate to what extent our kinetic model can describe the effect of a sudden perturbation on cell metabolic behaviour, while having been calibrated using culture data showing slow dynamics. Regulatory mechanisms known to apply along the glycolysis pathway in mammalian cells, i.e. feedback and feedforward inhibition and activation regulatory mechanisms from glycolytic metabolites and energetic variables, were integrated in the model. An in silico experiment was performed adding a sudden hypoxic stress, decreasing oxygen level at 10% of air saturation. The model was then modified to include the effect of seven regulatory functions in glycolysis pathway with one parameter for each case. Interestingly, the model structure with a fully regulated glycolysis results in the simulation of a shift from an oxidative phosphorylation metabolism to an anaerobic glycolysis metabolism, a result that is in agreement with literature. The implemented model thus showed a predictive capacity. In conclusion, this work has led to a dynamic model describing CHO cell metabolic behaviour that could be useful as an in silico tool for bioprocess optimization.
x
TABLE OF CONTENTS
DEDICATION ... iii ACKNOWLEDGMENTS ... iv RÉSUMÉ ...v ABSTRACT ... viii TABLE OF CONTENTS ...xLIST OF TABLES ... xiii
LIST OF FIGURES ... xiv
LIST OF ABBREVIATIONS ... xvii
LIST OF APPENDICES ... xx
CHAPTER 1 INTRODUCTION ...1
1.1 The mammalian cell industrial production platform ...1
1.1.1 Mammalian cells versus other cell culture platforms ...2
1.2 Challenges in the optimization of therapeutic proteins production...4
1.3 Mathematical modeling of biochemical networks: rationale and objectives ...6
1.3.1 Modeling as a tool for the control of a bioprocess ...6
1.3.2 Models to better characterize a living cell ...8
1.3.1 Modeling cell behaviour: a long term objective of the research group ... 10
1.4 Project objectives and methodology ... 10
1.5 Organization of the thesis ... 11
CHAPTER 2 LITERATURE REVIEW ... 12
2.1 CHO cells for the production of mAbs ... 12
2.2 Physiology and metabolism of mammalian cells ... 13
2.2.1 Nutrition management ... 14
2.2.2 Cellular metabolism - The way from genotype to phenotype... 15
2.2.3 Mechanisms of metabolic regulation ... 30
2.3 Characterization of mammalian cells metabolism ... 37
2.3.1 Rationale behind the modelling of a cell metabolic network ... 37
2.3.2 Current approaches for structured non-segregated mathematical representations of metabolic network ... 39
2.3.3 Current metabolic models for the mammalian cell platform ... 44
2.3.4 Analytical methods for metabolomic analysis ... 45
CHAPTER 3 METHODOLOGY ... 48
3.1 Metabolomic analysis ... 48
xi
3.1.2 Quantification of metabolic concentration ... 49
3.2 A general algorithm as a guide in the development of a metabolic kinetic model ……….51
CHAPTER 4 Article 1 A KINETIC METABOLIC MODEL BASED ON CELL ENERGETIC STATE: STUDY OF CHO CELLS BEHAVIOUR UNDER Na-BUTYRATE STIMULATION ... 55
4.1 Presentation of the article ... 55
4.2 Abstract ... 56
4.3 Keywords ... 56
4.4 Introduction... 57
4.5 Material and Methods ... 59
4.5.1 Biological material and bioreactor cultures ... 59
4.5.2 Model description ... 59
4.6 Results ... 70
4.6.1 Calibration of model structure and parameters on CHO cells control culture ………..70
4.6.2 The model simulates CHO cells behaviour in sodium butyrate stimulated cultures ………..75
4.6.3 Statistical analysis on estimated parameters ... 76
4.7 Discussion ... 79
4.7.1 Effect of sodium butyrate on CHO cells nutritional behaviour ... 79
4.7.2 Effect of sodium butyrate on CHO cells metabolism and energetic behaviour ... 80
4.8 Conclusion ... 87
4.9 Acknowledgements ... 87
4.10 References ... 88
CHAPTER 5 Article 2 METABOLOMICS AND IN-SILICO ANALYSIS OF MONOCLONAL ANTIBODY- PRODUCING CHO CELL CLONES ... 95
5.1 Presentation of the article ... 95
5.2 Abstract ... 96
5.3 Author Summary ... 96
5.4 Introduction... 97
5.5 Materials and methods ... 100
5.5.1 CHO clones and culture ... 100
5.5.2 Analytical methods ... 101
xii
5.6 Results ... 114
5.6.1 Model structure fine-tuning and characterization ... 114
5.6.2 Assessment of the in silico platform performance ... 118
5.7 Discussion ... 125
5.7.1 The kinetic-metabolic model is a reliable in silico tool to assess CHO cells clonal variations ... 125
5.7.2 Clone to clone variations yield more significant metabolic changes than recombinant protein expression ... 126
5.7.3 High producer clone selection favors metabolically efficient cell population subsets ………127
5.8 Acknowledgements ... 139
5.9 References ... 139
CHAPTER 6 Article 3 AN IN-SILICO STUDY OF THE REGULATION OF CHO CELLS GLYCOLYSIS ... 151
6.1 Presentation of the article ... 151
6.2 Abstract ... 152
6.3 Introduction... 153
6.4 Methods... 154
6.4.1 The kinetic metabolic model ... 154
6.4.2 Regulatory mechanisms of glycolysis ... 155
6.4.3 Characterization of the oscillatory behaviour ... 157
6.4.4 Calibration of the activation or inhibition parameters... 158
6.5 Results and discussion ... 158
6.5.1 Integration of the regulation mechanisms of glycolysis into the model ... 158
6.5.2 Cell energetic robustness relies on the regulation of glycolysis ... 160
6.5.3 The model simulates biomarkers of anaerobic glycolysis ... 164
6.5.4 The model simulates cell alternatives to an efficient energy production .. 170
6.6 Conclusion ... 173
6.7 Acknowledgements ... 173
6.8 references ... 173
CHAPTER 7 GENERAL DISCUSSION ... 180
CHAPTER 8 CONCLUSION ... 185
CHAPTER 9 RECOMMENDATIONS ... 187
BIBLIOGRAPHY ... 189
xiii LIST OF TABLES
Table 2.2 Essential and nonessential amino acids for mammalian cells ... 23
Table 2.3 Functional and regulatory roles of nucleotides ... 26
Table 2.4 General expressions for kinetic description of enzymatic reactions ... 34
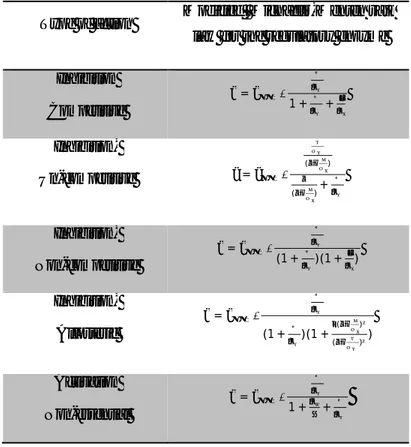
Table 2.5 Kinetic expressions for most common types of enzymatic regulations ... 35
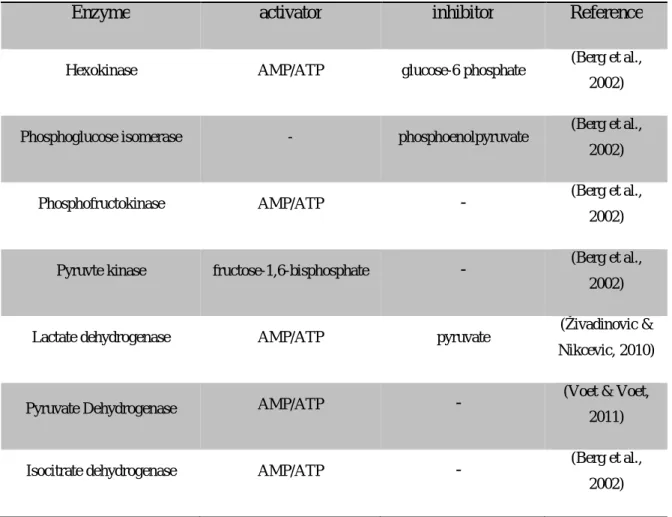
Table 2.6 List of major enzymes involved in the regulation of metabolic reactions ... 37
Table 2.7 Different orders of detection for chemical analysis techniques ... 46
Table 3.1 Summary of analytical methods applied to this work ... 50
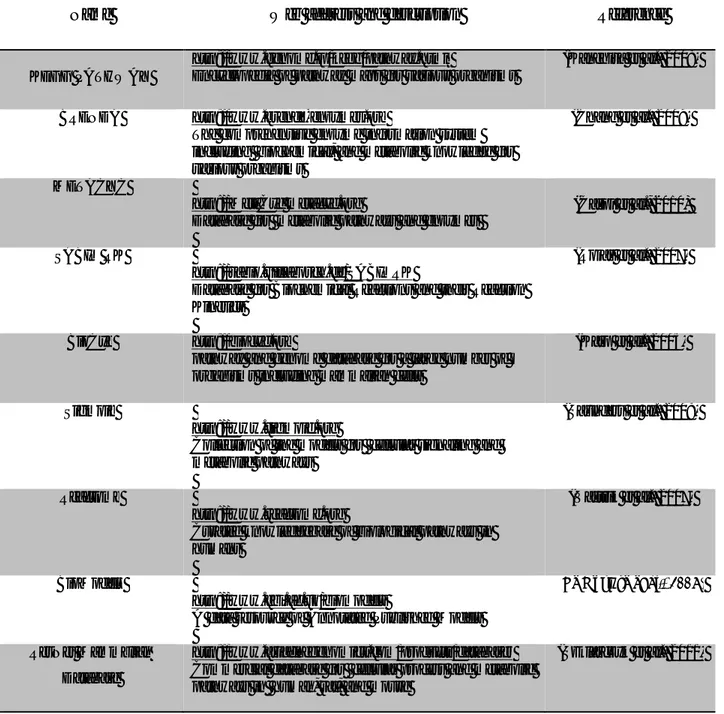
Table 3.2 Web resources and databases for components and pathways for various organisms ... 54
Table 4.1 Mathematical formulations of metabolic fluxes kinetic ... 62
Table 4.2 Reactions of a metabolic network ... 63
Table 4.3 Biokinetic equations of the metabolites fluxes (1-30) of the model ... 64
Table 4.4 State variables description and initial conditions ... 67
Table 4.5 Affinity (Km) constants ... 71
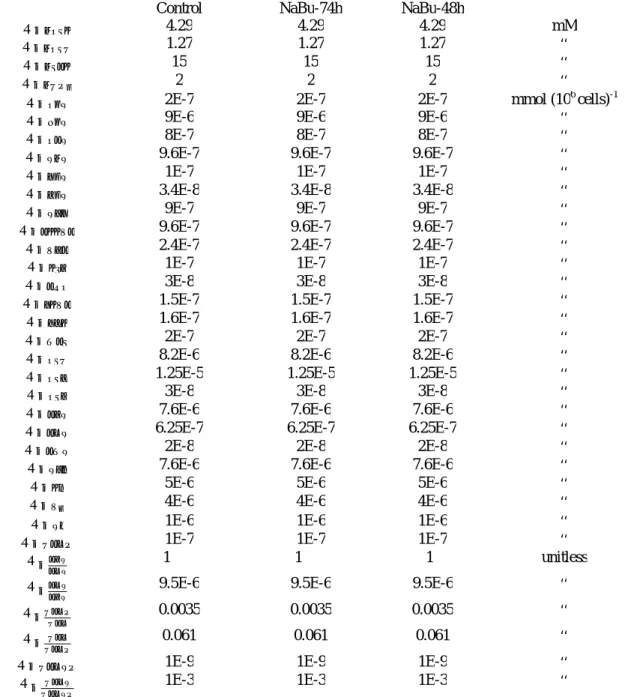
Table 4.6 Maximum reaction rates and comparison of highly sensitive parameters with their intervals in control, NaBu-48h and NaBu-74h cultures ... 72
Table 4.7 (Supplementary) Metabolic fluxes and ratios with their intervals in Control, NaBu-48h and NaBu-74h cultures at 120 h. Same conditions as Table 4.6 applied. ... 92
Table 5.1 Reactions of a metabolic network ... 106
Table 5.2 Biokinetic equations of the metabolites fluxes (1-35) of the model ... 108
Table 5.3 State variables description and initial conditions ... 110
Table 5.4 Affinity (Km), activation (Ka), and inhibition (Kd) constants ... 120
Table 5.5 Maximum reaction rates (νmax) and Comparison of highly sensitive parameters in parental, low-producing and high-producing clones. ... 121
Table 5.6 Comparison of metabolic fluxes and ratios in parental, induced low-producing and induced high-low-producing cell lines at 48 h. Same conditions as table 5.5 applied. ... 129
Table 6.1 Kinetic expression for each of the regulatory mechanisms. ... 157
Table 6.2 Characterize of ATP-to-ADP oscillatory behaviour and of regulatory parameters for various regulatory scenarios. ... 159
Table A.1 Akaike information criterion (AICc) of the model formulations with different combinations of regulatory mechanisms of glycolysis………232
xiv
LIST OF FIGURES
Figure 2.1 Schematic diagram of mammalian cells ... 14
Figure 2.3 An overview of glycolysis ... 18
Figure 2.4 Summary of glucose utilization through glycolysis ... 19
Figure 2.5The formation of acetyl CoA from pyruvate ... 20
Figure 2.6 Overview of the citric acid cycle ... 21
Figure 2.7 An overview of pentose phosphate pathway and the formation of five-carbon sugars ... 22
Figure 2.8 Aspartate transaminase reaction ... 24
Figure 2.9 Alanine transaminase reaction ... 24
Figure 2.10 Glutamate dehydrogenase reaction ... 24
Figure 2.11 The key steps of glutamine and glutamate metabolism. ... 25
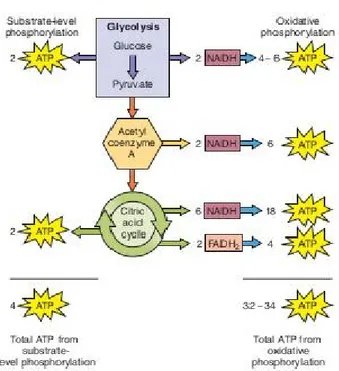
Figure 2.12 Schematic view of the mechanism of oxidative phosphorylation ... 27
Figure 2.13 Summary of ATP generation from one glucose molecule in glycolysis and oxidative phosphorylation ... 29
Figure 2.14 Creatine kinase reaction as an energy buffering reaction ... 30
Figure 2.15 Adenylate kinase reaction as an energy buffering reaction ... 30
Figure 2.16 Regulation of the activity of existing Enzymes ... 32
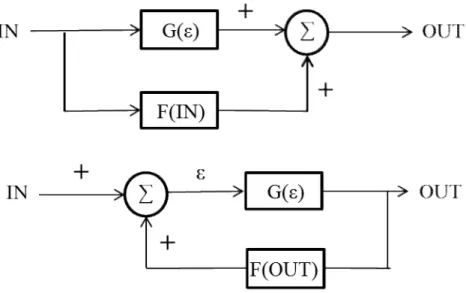
Figure 2.17 Feed-forward and feedback configurations.Adopted from Johnson el al. (1998) ... 36
Figure 2.18 Different approaches to the modeling of cell metabolism ... 39
Figure 2.19 Different stages for the formulation of MFA and MFBA problems. ... 43
Figure 2.20 Using GC or LC for metabolic measurements ... 47
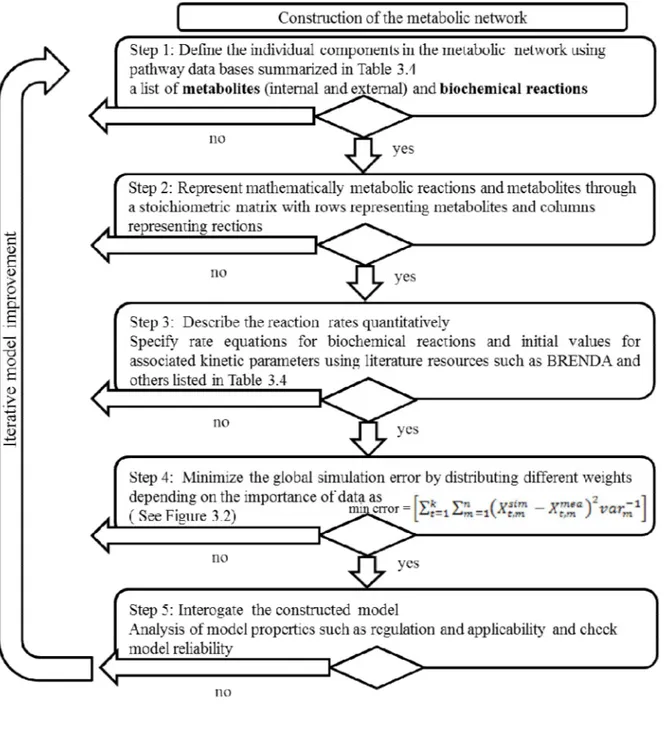
Figure 3.1 A general algorithm for the development of a kinetic metabolic model ... 52
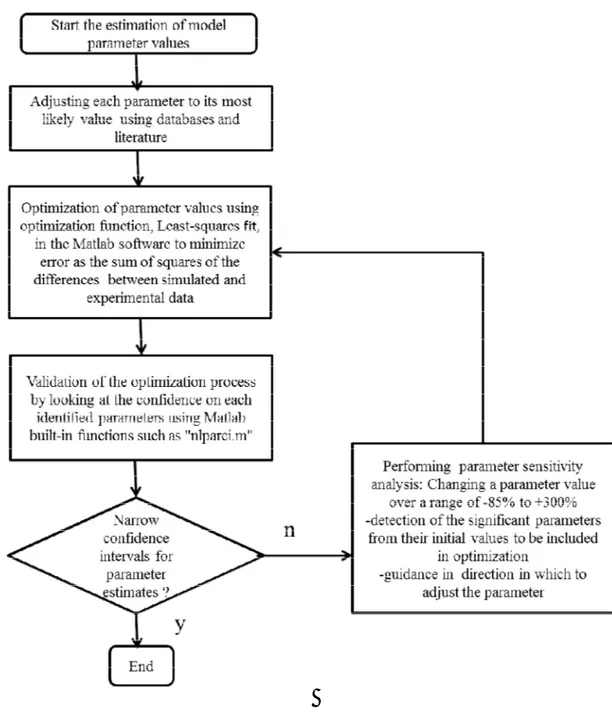
Figure 3.2 An algorithm for the estimation of model parameter values ... 53
Figure 4.1 The metabolic network described by the model ... 61
Figure 4.2 Sensitivity analysis on model parameters for sodium butyrate control culture. ... 75
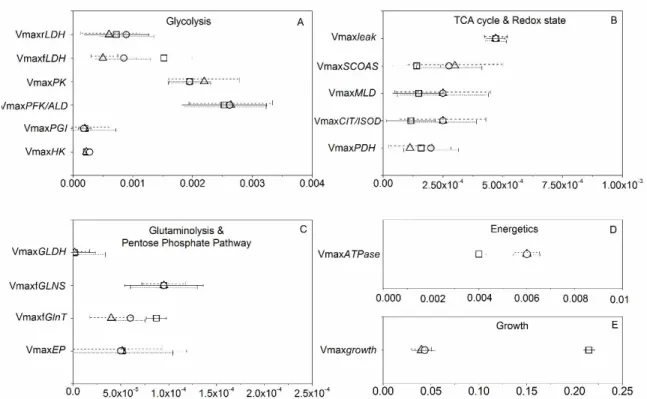
Figure 4.3 Parameter estimates with their error bars for highly sensitive parameters of glycolysis (A), TCA cycle and redox state (B), glutaminolysis and pentose phosphate pathway (C), and energetic and growth (D). ... 77
Figure 4.4 Normal probability plot of the weighted residuals for Control (A), (NaBu-48h) (B) and (NaBu-74h) (C) cultures. ... 77
Figure 4.5 Simulated and experimental data for Control and cultures with sodium butyrate addition. ... 78
Figure 4.6 Simulated time profiles of specific glucose uptake rate (A), specific glutamine uptake rate (B), lactate production-to-glucose consumption ratio (C), and ammonia production-to-glutamine consumption ratio (D), over time. ... 80
Figure 4.7 Simulated time profiles of glycolytic flux (A), the percentage of glucose derived to biomass (B), pentose phosphate activity (C), and pentose phosphate non-oxidative branch activity (D). ... 82
Figure 4.8 Simulated values of metabolic flux distribution around pyruvate branch point, defined as the ratio of the pyruvate influx through TCA cycle to the glycolytic flux (A), TCA cycle flux (B), and cellular redox state (NADH/NAD) (C). ... 83 Figure 4.9 Simulation of CHO cell energetic state. ATP turnover rate (A), contribution of oxidative metabolism to overall ATP production (B), contribution of aerobic
xv
glycolysis to overall ATP production (C), contribution of glucose to total ATP production (D), and the net specific productivity in recombinant t-PA observed experimentally (E), over time. ... 85 Figure 4.10 Comparison of metabolic flux maps for CHO cells NaBu-48h culture (A) and NaBu-74h culture (B) from model simulations at 120 h. ... 86 Figure 4.11 (Supplementary) Simulated data of intracellular metabolites for Control, and cultures with sodium butyrate addition at 48 h (NaBu-48h) and at 74 h (NaBu-74h). ... 94 Figure 5.1 The metabolic network considered in the model ... 105 Figure 5.2 Regulation scheme of the model through the activation or inhibition of the enzymes. ... 112 Figure 5.3 Sensitivity analysis on model parameters for parental cell line culture... 117 Figure 5.4 Partial Sensitivity analysis on model parameters for parental cell line culture. ... 118 Figure 5.5 Parameter estimates with their error bars for sensitive parameters... 124 Figure 5.6 Simulated and experimental data for parental and induced/non-induced cell lines. ... 125 Figure 5.7 Comparison of metabolic fluxes and ratios. ... 128 Figure 5.8 Selected metabolic fluxes of parental (solid line), induced low-producer (dashed line), and induced high-producer cell lines. ... 134 Figure 5.9 Comparison of metabolic ratios. ... 135 Figure 5.10 (Supplementary) Comparison of model simulations with regard to enzymatic regulation for parental culture for extracellular and energetic metabolites. ... 144 Figure 5.11 (Supplementary) Comparison of model simulations with regard to
enzymatic regulation for parental culture for intracellular metabolites. ... 145 Figure 5.12 (Supplementary) Comparison of model simulations with regard to
enzymatic regulation for induced low-producing culture for extracellular and energetic metabolites. ... 146 Figure 5.13 (Supplementary) Comparison of model simulations with regard to
enzymatic regulation for induced low-producing culture for intracellular variables. ... 147 Figure 5.14 (Supplementary) Comparison of model simulations with regard to
enzymatic regulation for induced high-producing culture for extracellular and energetic metabolites. ... 148 Figure 5.15 (Supplementary) Comparison of model simulations with regard to
enzymatic regulation for induced high-producing culture for intracellular metabolites. 149 Figure 5.16 (Supplementary) Simulated and experimental data for parental, induced low-producer, non-induced low producer, induced producer, and non-induced high-producer... 150 Figure 6.1 The metabolic network considered in the model. ... 156 Figure 6.2 Model simulations of energetic ratios following a hypoxic perturbation. .. 160 Figure 6.3 Specific contribution of the regulatory mechanisms... 163 Figure 6.4 Model simulations of ATP-to-ADP with 95% confidence intervals for regulatory scenarios avoiding oscillatory responses. ... 164 Figure 6.5 Model simulations of metabolic fluxes following a hypoxic perturbation. 166 Figure 6.6 Model simulations of metabolic flux distribution and metabolic ratios
xvi
Figure 6.7 Model simulations of metabolic concentrations following a hypoxic
perturbation. ... 170 Figure 6.8 Model simulations of cell bioenergetics state following a hypoxic
perturbation. ... 172 Figure 6.9 (Supplementary) Sensitivity analysis on the parameters of regulatory
mechanisms for individual mechanisms a, b, c, d, and e1. ... 177
Figure 6.10 (Supplementary) Sensitivity analysis on the parameters of regulatory
mechanisms for scenario a-b... 178 Figure 6.11 (Supplementary) Sensitivity analysis on the parameters of regulatory
mechanisms for scenario a-c. ... 179 Figure A.1 Schematic diagram of cell expansion in T-flasks ... 216 Figure A.2 Schematic diagram of cell expansion in shake-flasks ... 217 Figure A.3Second partial derivatives of the log-likelihoodand information………...235
xvii
LIST OF ABBREVIATIONS
AA: Amino acids
ACCOA: Acetyl-CoenzymeA AKG: α-ketoglutarate
ALA: Alanine ARG: Arginine ASP: Aspartate
ASX: Extracellular Aspartate and Asparagine ATP: Adenosine triphosphate
ADP: Adenosine diphosphate AMP: Adenosine monophosphate CHO: Chinese Hamster Ovary CIT: Citrate
Ci : Control coefficients
CoA : CoenzymeA CO2: Dioxyde de carbone
Cr:Creatine
DO: Dissolved oxygen DNA: Deoxyribonucleic acid EALA: Extracellular alanine EASP: Extracellular aspartate EGLC: Extracellular glucose EGLN: Extracellular glutamine EGLU: Extracellular glutamate ELAC: Extracellular lactate
ELISA: Enzyme-Linked ImmunoSorbent Assay ENH4: Extracellular ammonia
FADH2: Flavine adenine dinucleotide
FUM: fumarate
F6P: Fructose-6- Phosphate
xviii GDP: Guanidine diphosphate GDP: Guanidine dephosphate GTP: Guanidine triphosphate G6P: Glucose-6-phosphate GC: Gas chromatography GLC: Glucose concentration GLN: Glutamine concentration GLY: Extracellular Glycine H: Hour
H2O: Hydrogen dioxide
HEK:Human Embryonic Kidney HIS: Extracellular histidine
HPLC-MS: High performance liquid chromatography – mass spectroscopy IgG: Immunoglobulin G
ILE: Extracellular isoLeucine LUE : Extracellular leucine LYS : Extracellular lysine
: Affinity constant Mab: Monoclonal antibody MAL: Malate
MCA: Metabolic control analysis MBFA: Metabolic balance flux analysis MFA: Metabolic flux analysis
NaBu: Sodium butyrate
NAD: Nicotinamide adenine dinucleotide (Oxidized) NADH: Nicotinamide adenine dinucleotide (reduced) NADP: nictoniamide adenine dinucleottide phosphate
NADPH: nictoniamide adenine dinucleottide phosphate (reduced) NMR: nuclear magnetic resonance
OXA: Oxaloacetate
xix
PCr:Phosphocreatine Pi: inorganic phosphate PYR: Pyruvate
R5P: Ribulose-5-phosphate RNA:Ribonucleic acid SER: Extracellular serine SUC: succinate
SUCCOA: Succinyl coenzyme A TCA: Tricarboxylic acid
TYR: Extracellular tyrosine UDP: Uridine dephosphate UTP: Uracil triphosphate
: Metabolic flux
: Maximum enzymatic reaction rate
Var: Variance
WSSRES: Weighted sum of squared residuals X5P: Xylulose 5-phosphate
Xmea: experimental data Xsim: Simulated value
xx
LIST OF APPENDICES
APPENDIX 1 Protocol to thaw and pass CHO-cum2 cells... 206
APPENDIX 2 Protocol to expand CHO-cum2 cells suspension culture ... 209
APPENDIX 3 Protocol for the quantification of CD-20 expressed in CHO-cum2 cells ... 214
APPENDIX 4 Protocol of cold methanol extraction of CHO cells ... 216
APPENDIX 5 MATLAB files ... .219
1
CHAPTER 1
INTRODUCTION
1.1 The mammalian cell industrial production platform
Mammalian cells have attracted industrial attention over the last decades because of their unique ability to synthesize human-like high value products that can hardly be made by microorganisms (Aggarwal et al., 2011). These products, often highly glycosylated proteins such as antibodies, are now widely used for diagnostic and therapeutic applications (Leader, Baca, & Golan, 2008). Since the first approval of a therapeutic protein by the USA Food and Drug Administration (FDA) with recombinant insulin in 1982 (Leader et al., 2008) and up to 2011, a total of 96 recombinant protein therapeutics produced from mammalian cells have been approved. The annual revenue for the USA only is now reaching $112.93 billion dollars (www.pipelinereview.com). These numbers continue to increase following biopharmaceutical industry improvements with an average of 15 new drug approvalsper year by the FDA from 2006 to 2011 (Lai, Yang, & Ng, 2013). Nowadays, the majority of biopharmaceutical products are produced at industrial scale in multi-m3 bioreactors using mammalian cell lines such as Chinese Hamster Ovary (CHO) cells. The CHO platform is used to produce over 40% of monoclonal antibody products currently approved by the FDA (Grillari et al., 2001) while murine myeloma (NS0) account for 25% of monoclonal antibody products (Barnes, Bentley, & Dickson, 2000) and hybridoma cell lines for the production of murine monoclonal antibodies mostly for research and analysis purposes (Davies, Gallo, & Corvalan, 1999). However, there are few other cell lines that are assessed for the production of human-like monoclonal antibody products and human cells are seen as potential alternatives to CHO cells (Jones et al., 2003). Moreover, some other cell lines have a specific niche such as the baby hamster kidney (BHK) cells that are mainly used for virus and vaccine production (Pitti et al., 1994). However, although the industry has now reached high expression titers using mammalian-cell platforms (mg to g L-1), the limited level of understanding on the links between cell behaviour and the physico-chemical environment still affects production reproducibility in quantity and quality (e.g. glycosylation profile), as well as reducing time to market (i.e. cell line and media selection and cell culture management). This thesis thus aims at developing an in silico tool that could contribute to
2 1.1.1 Mammalian cells versus other cell culture platforms
Glycosylation, which consists in the attachment of a sugar molecule to an amino acid residue of a protein, is a crucial process known to confer multiple specific functional properties to proteins, and thus of protein-based therapeutics (Beck et al., 2008). As a biotherapeutic, a protein glycolytic profile qualifies its in vivo efficacy (Durocher & Butler, 2009; Higgins, 2009), and it is highly dependent on the expression cell platform as well as on culture conditions (Ghaderi et al., 2012). It has been shown possible to specifically engineer a biotherapeutic protein glycosylation, in various cell production platforms, to impose human-like characteristics (Higgins, 2009). Fundamentally, bacterial expression systems are not genetically equipped to glycosylate proteins; these prokaryotic cells are lacking the enzymatic machinery required for mammalian-type glycosylation such as N- and O-glycosylations, which are affecting the 3D conformational structure of proteins. Recently, some promising strain/genetic engineering approaches were applied to bacterial platforms with the transfer of mammalian glycosylation machinery (Nothaft & Szymanski, 2011; Schwarz et al., 2010). Although these modifications allowed synthesis of mammalian-like N-glycans and thus markedly enhanced bacterial capacities for recombinant protein production, some issues still need to be addressed. First, strong transcriptional promoters are required to enable high-level gene expression. Promoters thus have to be induced while most inducers can be toxic and are expensive (Samuelson, 2011). Second, recombinant proteins should be released into the medium to ease their harvesting.In bacterial expression systems, however, they are directed to three different locations i.e. the cytoplasm, the periplasm, and to a lesser extent the growth medium (Jana & Deb, 2005). It is generally more preferable that expression of recombinant proteins occurs in cytoplasm since it leads to higher production yields. Low temperature, i.e. the use of cold inducible promoters, has proven to enhance protein folding in cytoplasm. However, that often leads to wrong interactions of amino acids and and not a well-defined three-dimensional structure known as protein misfolding (Khow & Suntrarachun, 2012).
As such, additional improvements are needed in establishing cost-efficient, reliable bacteria-based expression systems. Protein glycosylation can also be performed a
3 posteriori, chemically, on purified proteins, but the costs can be prohibitive and the yields
in adequate glycolytic profile are still low (Macmillan et al., 2001).
Yeast, an eukaryotic cell, also provides an attractive expression platform offering considerable advantages, such as ease of culture, ability to maintain high growth rate and to reach high densities using chemically defined media, and finally sharing the same N-glycan core structure with humans (Böer et al., 2007). However, the yeast expression system is also subject to certain drawbacks such as hyper-glycosylation, in which case additional mannose residues are bond to the N-linked carbohydrate chain of the proteins, which is of allergenic potential (Gellissen et al., 2005). Although this issue has been addressed over the past decade with various genetic modifications strategies, any commercialized human-like recombinant N-linked glycoprotein expressed in yeasts has not yet been reported, to the best of our knowledge. Plant-based expression systems also offer some advantages over other recombinant protein production platforms such as lower production costs and ease of scaling up to commercial production (Gomord et al., 2010). Probably the best advantage of plants resides in an unbeatable time-to-market of only few weeks, from product identification to mass production, using the recent agro-infiltration technique based on transient transfection approach (Golemboski, Lomonossoff, & Zaitlin, 1990; Vezina et al., 2013). This transient approach looks promising and many efforts are now placed into the niche of the rapid production of vaccines or virus like particles to face pandemia (Paul & Ma, 2010). However, the first recombinant protein obtained from plant biotech was from transgenic carrot cells cultured in suspension, and homologated by the FDA for the treatment of Gaucher’s disease in 2012 (www.protalix.com). Therefore, it has been shown possible to produce proteins in plants that are biosimilar to those in human. Although plant cells can synthesize mammalian type complex N-glycans, glycoproteins expressed in plants have a different glycan structure caused by differences in the plant and human N-glycan processing machinery (Gomord et al., 2010). Therefore, intensive research is directed towards the modification of plant glycosylation pathways for the production of completely humanized proteins (Cox et al., 2006).
Similarly to the plant-based platform, the glycans produced by insect cells also differ significantly from those present in human. Recombinant proteins expressed in insect cells
4
completely lack some essential parts, such as galactose and sialic acids, both present in human proteins (Ailor et al., 2000). Consequently, more research has to be done on this platform to compete with mammalian cells.
Taking all of the above into consideration, one can understand that the mammalian cell expression platform is still predominant in industry to produce recombinant proteins. However, other platforms may benefit, in a near future, from the coming developments in glycosylation engineering, as well as from the identification of more simple ways to produce drugs’ active sub-parts.
1.2 Challenges in the optimization of therapeutic proteins production
The mammalian cell platform is attracting most of the research investments worldwide in order to be continuously improved for recombinant protein production, as well as cell line selection and culture protocols to reduce time-to-market (Ailor et al., 2000). Bioproducts obtained from mammalian cells are highly complex, and because these therapeutics can induce strong and undesired side effects, their production is highly constrained by the regulatory agencies worldwide. The global development process of a new therapeutic product, and its acceptance and homologation by regulation agencies, can require up to 10 years of efforts and significant financial investments; this includes cell line development and the production process, as well as conducting extensive testing of the end-product therapeutic to demonstrate both its medical efficiency and innocuity (DiMasi, Hansen, & Grabowski, 2003). In cases of diseases that are affecting only a small population, in which case the will of pharmaceutical companies could be low to inexistent because of the little size of the market, regulatory agencies allow accelerating the homologation process for these so-called “orphan” drugs. This can thus favor these drugs development whatever their financial context. Although the maximum recombinant protein concentration that is now reported has increased by 1000-fold (mg/L to g/L) in the past decades, there are still important drawbacks limiting product quality and process productivity reproducibility at the industrial scale(Wurm, 2004).Basically, reproducibility of the results is among the most fundamental requirements of mammalian cell culture processes to be acceptable industrially. The clones that are selected should generate cultures reproducing the characteristics of the very first culture, up to the large scale production (Jayapal et al., 2007). Mammalian cells, however, can exhibit a considerable
5
degree of variability and the sourcesof this variability remain often obscure. This variability in the performance of cell culture processes is mainly related to lot-to-lot inconsistency of production in terms of both quantity and quality. First, one major challenge facing therapeutic protein production in mammalian cells is that the expressionof proteins declinesover time (with cell generation) and is often unstable during the time of development (Anderson & Krummen, 2002a). Since cells are genetically modified (at least for producing a recombinant product), they are even more sensitive to genetic drift and loss of high-producer capacity due to intrinsic genetic repair mechanisms (Palomares, Estrada-Mondaca, & Ramírez, 2013). This implies that the long time required from cell line construction and selection to clinical trials mayface genomic instability of a selected mammalian cell line, and see a high-producer clone becoming a low-producer one.Second, therapeutic product glycosylation profile variations, besides variations in production level, can dramatically lower or even remove any commercial value. Glycosylation pattern has been reported to be extensively affected bycell type, culture process and culture media conditions(Hossler, Khattak, & Li, 2009). Therefore, any mistake in culture protocols or misunderstanding of culture behavior leading to non-reproducible product quality level may dramatically impact the therapeutic safety evaluation by regulatory agencies, thus resulting in the reject of product homologation. So, there is still a need to engineer a well-characterized cell line to expand its capacity so that it can control the glycosylation profile towards optimal pattern in differentculture conditions(Hossler et al., 2009). Third, there are still reports of potential product heterogeneities where a single optimal glycan profile cannot be achieved in mammalian cell culture processes. Glycoform heterogeneity, that highly depends on the manufacturing process, can even occur throughout a batch culture and may decrease the desired therapeutic efficiency. (Abu-Absi et al., 2010). The depletion of nutrients throughout batch cultures has been reported to cause such product heterogeneity (Castro et al., 1995) .So, the status of homogeneous glycoform profiles that can be systematically screened for in mammalian cell culture processes is still too low. Forth, to achievehigh titres of the product, both high cell specificproductivity and cell density should be achieved. Apoptosis, or programmed death, is known to be the major cause of cell death for mammalian cell lines used at industrial scale (Al-Rubeai, 1998; Laken & Leonard,
6
2001). Engineering of cell lines with anti-apoptotic factors, to be overexpressed during the culture, has been reported to delay the onset of apoptosis (Andersen & Krummen, 2002; Birch, Mainwaring, & Racher, 2005). However, the overexpression of these factors can cause stresses during cell culture that can compromise the productivity (figueroa et al., 2007; Ishaque & Al-Rubeai, 2002). Therefore, enhancement of cellular viability will not necessarily improve the overall productivity.Taken all of the above into account, it is clear that the mammalian cell platform is complex, and the keys allowing reaching an adequate mastering of its output, i.e. a therapeutic product having a high commercial value, require additional fundamental studies linking process conditions and cell physiology. Consequently, the industry has developed impressive high-throughput approaches enabling massive assays for the identification of optimized culture media and cell lines. However, the use of mathematical tools simulating cell and bioprocess behavior may help at defining favorable conditions at a lower cost and more rapidly, thus accelerating high-throughput studies.
1.3 Mathematical modeling of biochemical networks: rationale and objectives
1.3.1 Modeling as a tool for the control of a bioprocess
It is now clear that the development of a bioprocess involving the mammalian cell platform is, indeed, a multi-factorial task implying various disciplines from molecular biology to biochemical engineering (Koutinas, Kiparissides et al., 2011). Molecular biology works are required to generate stable cell lines producing a recombinant product of interest. Although significant breakthrough have been reached enabling the insertion of a new gene expression capacity in cells (Kayser et al., 2006), the challenge is to obtain high titers. As previously explain, cell behavior can be highly affected by its environment (Clark et al., 1990) and the result from an intuitive genetic modifications can be opposite to expectations (Andersen & Krummen, 2002). So, reaching high titers may rely on the combination of various factors such as 1) defining optimal culture media, 2) selecting a parental cell line, 3) identifying the genetic modification protocol, and 4) selecting high-producer stable cell lines (Fox, 2004). Moreover, the final production bioreactor unit may also require a subtle medium management strategy, such as fed-batch or perfusion culture protocols, in order to maximize cell productivity (Chu & Robinson, 2001). Indeed, a
7
valuable protocol should specifically define optimal feeding time profile, optimizing medium composition at all time. In that context, mathematical models may be expected to play an important role in both bioprocess characterization and control.Classical modelling approaches normally limit bioprocess characterization to mass balances around the bioreactor to determine the concentration time course of nutrients, products and byproducts (Bastin & Dochaln, 1990). These approaches were shown to allow for the control of bioreactor production with the mammalian cell platform (Dhir et al., 2000; Tremblay et al., 1992; Zhou et al., 2006). However, although such modelling approach lead to valuable process information, it may be too partial for enabling a complex control level involving many nutrients that are not necessarily limiting but which respective effects on cell behaviour reside within intracellular flux dynamics. Different compositions of media have been proven to lead to distinct cellular behaviours with regard to metabolic efficiency and reduced formation of by-products (Bonarius et al., 2001; Bonarius et al., 1998; Xie & Wang, 1996). Different medium protein and amino acid concentrations have also been shown to lead to different metabolic states (e.g. higher TCA activity), although the main nutrients, glucose and glutamine, were present in sufficient amounts (Nadeau et al., 2000; Xie & Wang, 1996).Replacement or supplementation of the nutrients with other available sources, e.g. galactose, also showed to modulate cell metabolism with regard to metabolic branch points, e.g. glycolysis and TCA (Altamirano et al., 2006; Altamirano et al., 2000; Wilkens, Altamirano, & Gerdtzen, 2011). An adequate information level ethat permits defining an effective control strategy may thus require a more descriptive model of cell behaviour. Such model could even have predictive properties of cell behaviour. This approach is directly in line with the "Process Analytical Technology" (PAT), an essential quality element of the “Pharmaceutical Current Good Manufacturing Practices (CGMPs)” for the 21st Century (Rathore, Bhambure, & Ghare, 2010), promoted by Food and Drug Administration (FDA) in 2004 (Gnoth et al., 2007).
Moreover, production bioprocesses using a mammalian cell platform normally include defined perturbations from the use of chemical additives (Kumar, Gammell, & Clynes, 2007), inducible promoters (Mullick et al., 2006) or a transient transfection strategy (Durocher, Perret, & Kamen, 2002; Pham, Kamen, & Durocher, 2006). Therefore, the
8
problem of defining an optimal culture management strategy becomes even more complex when sudden stresses affecting cell metabolism are imposed. Taken all of the above together, it seems obvious that mathematical models able to characterize and describe cell behaviour from various perturbations along bioprocesses are mostly required.
1.3.2 Models to better characterize a living cell
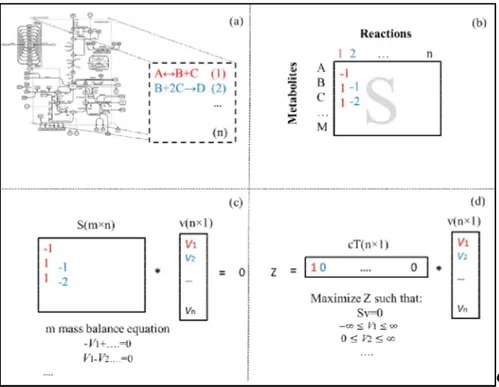
A cell can be considered as an open system which exchange energy and matter with the environment. This, in turn, enables the cell to maintain internal order and to synthesize building blocks for its functions, growth and survival. The material taken up by a cell follows a series of transformations usually referred as cellular metabolism (Alberts et al., 2002a). Cell metabolism is thus a dynamic coordinated ensemble of processes involving biochemical reactions all interrelated within a metabolic network. Metabolites are generally synthesized along metabolic pathways, i.e. the units of a metabolic network (De la Fuente et al., 2013). A living cell has its metabolic activities regulated and controlled by intricateregulatory mechanisms. To efficiently characterize cell physiology, a detailed mathematical representation of the metabolism is required. Depending on the level of detailed information available, different mathematical representations of cell metabolism may be developed. A lumped model, which considered only substrate, product and growth using Monod kinetics, for instance, represents the early attempts at developing metabolic models with a low level of details. A mathematical approach named as metabolic flux analysis (MFA), has then been developed for describing metabolic fluxes rates under steady state condition. In MFA, intracellular fluxes are calculated based on measured exchange rates (Price, Reed, & Palsson, 2004). Metabolic flux balance analysis (MFBA) is a special case of MFA in which a solution for the reaction rates of a network is obtained through the optimization of a particular network function (Edwards et al., 1999). The MFBA approach is not confined to measured reaction rates but it is limited to the assumption of an optimal behaviour of cells. Therefore, living cells are now studied more as a metabolic network with components, i.e. metabolites and biochemical reactions that are highly interconnected. In this regard, mathematical models have proven to provide a framework in which data obtained from high throughput experiments can be analyzed to reveal new insights into the functioning of cellular metabolism. Based on the
9
concept that cells in culture generally exhibit completely different behaviors depending on the environmental fluctuations, this mathematical framework should get its best use to predict how metabolic network responds dynamically to a changing environmental condition (Chin et al., 2008).
Different concentrations of glucose, glutamine, and amino acids can induce many cultures to shift to different metabolic states, i.e. oxidative metabolism or anaerobic glycolysis, different levels of inhibitory metabolites (Altamirano et al., 2004; chen & Harcum, 2007; Xie & Wang, 2006; Zhang, Shen, & Zhang, 2004). In addition to nutrient concentrations, growth factors, and lipids in culture medium have also shown to effect cellular behaviour, i.e. cell growth. Addition of product enhancers such as sodium butyrate to cell cultures has also proven to effect metabolic efficiency and promote special pathways (De Leon et al., 2007; McMurray-Beaulieu et al., 2009; Yee et al., 2008). More specific conditions include supplementing culture media with intracellular metabolites, i.e. pyruvate, also influencing particular cellular metabolic pathways (Genzel et al., 2005). Therefore, the role of a cell regulatory machinery is crucial to ensure metabolic homeostasis; i.e. maintaining intracellular conditions at defined setpoints (De la Fuente et al., 2013).
Moreover, the mathematical framework should also be able to predict how the introduction of perturbations to a cell, e.g. environmental or genetic, can effect cell metabolism (Cloutier & Wang, 2011). This is encouraged by the fact that cellular pathways are complex and highly interconnected while modulation of metabolic fluxes due to local genetic perturbation should not be studied separately, i.e. increased flux through the overexpression of the corresponding enzyme, but as a network (Morandini, 2009). This lack of systematic analysis is mostly well-known in the field of metabolic engineering. In many studies the overexpression of an enzyme, i.g. phosphofructokinase in glycolysis failed to increase flux rates in glycolysis pathway (Thomas et al., 1997). Therefore, there is a need for a dynamic mathematical framework that can reproduce some of these important observations. Such dynamic model should grasp cellular dynamics and the regulatory mechanisms involved in different conditions and operational systems (Bonarius, Schmid, & Tramper, 1997). MBA and MFBA methods bring valuable
10
insights into metabolic flux distribution at steady state, however, they lack information on the dynamics of the process.
1.3.1 Modeling cell behaviour: a long term objective of the research group
In 2007, Professor Mario Jolicoeur’s research group, at the Ecole Polytechnique de Montréal, developed a kinetic-metabolic model framework adapted to plant cells (Cloutier, Perrier, & Jolicoeur, 2007). It was demonstrated that the model can successfully describe the dynamics of plant cells metabolism. It was also applied to the control of intracellular concentration such as of the cytoplasmic inorganic phosphate at a defined set-point (Cloutier et al., 2009). It was even used as an in silico tool to design a culture management strategy to maximize secondary metabolites production in a bioreactor culture (Cloutier et al., 2009). Therefore, we have explored this kinetic-modelling approach for its use on mammalian cells.
1.4 Project objectives and methodology
This work aims to develop a mathematical model capable to describe CHO cell transient behavior in culture. Paying a particular attention to keeping a biologically relevant description of the CHO cell central metabolism, including cell growth and production in a recombinant product such as a protein and a monoclonal antibody (mAb), we have challenged our modelling approach with different CHO cell lines. A first series of data was limited to basic culture datasets (including cell growth, production, respiration, glucose, glutamine, lactate, and ammonia and intracellular concentrations of energetic nucleotides and cell energetics with time) for a cell line producing a recombinant t-PA (transplaminogen activator). This was used to develop the model structure and for the calibration of its parameters. Although mainly extracellular data were used (except for cell energetic), the model was assessed for its capacity to simulate intracellular events such as metabolic fluxes and metabolites concentrations. Then, we tested the adaptability of the model structure by challenging it with another cell line containing an inducible cumate gene switch enabling the production of a monoclonal antibody. We had access to the parental cell line as well as low- and high-producer cell lines. Finally, we assessed for the model predictive capacity while it was challenged to describe an in silico perturbation experiment, using a hypoxic stress as a case study.
11 1.5 Organization of the thesis
The thesis contains nine chapters. Chapter one presents a brief introduction describing the thesis context and objectives. The current status of knowledge on the mammalian cell platform and the challenges at improving bioprocess reproducibility and productivity are discussed. Mathematical modelling of cell behaviour, as a method to study mammalian cell metabolism, is finally introduced. In chapter two we elaborate on the most important characteristics of CHO cells while developing a kinetic metabolic model, putting a particular attention at cell metabolismand regulatory interactions involved in metabolic hemostasis. In the third chapter, the general methodology used in this work is presented, and the general algorithm followed to develop the kinetic metabolic model is shown. In chapter four, a metabolic model is developed on the basis of biochemical information available for CHO cells metabolic network, and assumptions on unknown information are discussed. The model is first calibrated on previously published experimental data obtained in our research group (McMurray-Beaulieu et al., 2009).In chapter five, the capacity of the model to be adapted to another recombinant CHO cell line is presented. Extensive measurements of extra- and intra-cellular metabolites concentrations were obtained for another CHO cell line; a parental and its high- and low-producer derived clones producing a recombinant monoclonal antibody under the induction of a cumate gene switch.
In chapter six, the model is implemented with regulation mechanisms of glycolysis pathway and assessed to study the dynamics of metabolic network in response to a hypoxic stress.
In chapter seven, we present the general discussion, in chapter eight, the main conclusions and in chapter nine proposed future works are summarized.
12
CHAPTER 2
LITERATURE REVIEW
2.1 CHO cells for the production of mAbs
The domestic Chinese hamster originates from Beijing (Peking), and the first report on the use of this animal for the treatment of Pneumococcal infection goes back to 1919 by Hsiehin China (Hsieh, 1919). Much later, subsequent research on Chinese hamster ovary in the mid-20th century suggested that the low chromosome number of this animal made it a good candidate for research. It was at that time that Dr. Theodore T. Puck, a pioneer in mammalian cell culture, established the first Chinese hamster ovary cells (CHO) in plate (Tjio & Puck, 1958).It soon became clear that these cells were readily good candidate in in vitro culture. Up to now, CHO cells showed a high adaptive ability and ease of maintenance which make them good candidates for fundamental research in biomedical, pharmacology and cell signaling (Figler et al., 2003; Schulte & Fredholm, 2003). This cell, which naturally grows as adherent cells, can also be adapted to suspension culture showing adequate resistance to shear stress when cultured in bioreactors (Jayapal et al., 2007). Nowadays, over 70% of all recombinant proteins are produced by CHO cell derived platforms (Jayapal et al., 2007). In addition of being predisposed to genetic modification and in vitro culture, CHO cells are also being used from the mass effect created after the homologation of various recombinant therapeutics using these cells; i.e. it facilitates homologation of a new product since the cell platform is now well known by the regulatory agencies (Meyer et al., 2008). Among all recombinant proteins, monoclonal antibodies have received special attention during the past decades. Antibodies are large proteins with a Y-shape which are produced by B-cells in response to foreign object and used by the immune system to identify and neutralize it (Riechmann et al., 1988). When antibodies are produced from a population of B cells which is derived from a single parental cell they are homogeneous and named monoclonal antibodies.Monoclonal antibodies have received most of the industrial attention because of the important market share with almost 376 preclinical to market products (Pavlou & Belsey, 2005). For example Vectibix (Anti-EGFR mAb), Avastin (Anti-VEGF mAb), and Herceptin (Anti-HER2 mAb) have been commercialized as therapeutic agents regarding colorectal, lung, and breast cancer respectively. Xolair (Anti-IgE mAb), Raptiva (Anti-CD11a mAb), Campath (Anti-CD52 mAb), and Rituxan
13
(Anti-CD20 mAb) are also some examples of mAbs commercialized to treat asthma, psoriasis, and lymphoma respectively (Jayapal et al., 2007). From an industrial point of view, CHO cells are highly efficient for the production of antibodies for a couple of reasons. First, they exhibit a stable growth, in terms of cell counts and prolonged cell viability, due to their robust nature (Chu & Robinson, 2001). Second, they can be easily adopted to grow in suspension culture which is favorable for large scale industrial production (Boeger et al., 2005). Third, glycoproteins that are expressed in CHO cells have a glycosylation profile that is more human-like comparing to other cell lines(Ghaderi et al., 2012). Fourth, there is a good record of several genetic amplification systems (e.g. chaperones such as Hsp70 and Hsp27) in CHO cells (Lee et al., 2009). Fifth, host-cell related contaminating impurities are well understood in CHO cells resulting in more efficient downstream processes comparing to other mammalian cell lines (Wurm, 2005). All these factors ultimately results in higher titers of recombinant proteinreaching up to 5 g/L (Kim, Kim, & Lee, 2012) in fedbatch cultures. CHO cells viability has been improved through genetic modifications such as, complementing the cell machinery with growth factor endogenous proteins (e.g. insulin like growth factors) (Galbraith et al., 2006; Sunstrom et al., 2000; Zanghi et al., 2000) or optimizing cell-cycle control genes (e.g. cyclin-dependent kinases) (Fussenegger et al., 1998), or through the enhancement of cellular metabolism (Irani et al., 1996; Wlaschin & Hu, 2006). Various strategies also showed to be successful in enhancing CHO cells productivity at the genomic level, i.g. the use of cytomegalovirus (CMV) and beta-actin and EF-1α as strong promoters, and the insertion of dihydrofolate reductase (DHFR) as an amplification marker (Cacciatore, Chasin, & Leonard, 2010), just to name a few. Above all these, the complete sequencing of CHO Genome has recently been accomplished and can support future breakthroughs in CHO-cell production platform (Xun et al., 2011). However, there is still a risk in terms of performance variability during scaling-up and manufacturing (Li et al., 2010).
2.2 Physiology andmetabolism ofmammalian cells
Thissection presents themain metabolic pathwayspresentin CHO cells, as well as their common behaviour. Mammalian cellsare eukaryoticcells that have a phospholipid membrane composed of proteins and lipids that surround the cytoplasm of the cell
14
(Figure 2.1). The cytoplasm is filled with dispersed particles and compartments such asnucleus,ribosome, Golgi apparatus, and mitochondria. Thesecompartmentshaveunique properties. The nucleus containsmostof the genetic material. Ribosome is involved in protein synthesis. Golgi apparatus modifies the proteins, specially those for excretion. In mammaliancells, thepower generation mostly takes place inthe mitochondria. Mitochondria, which is the location where theKrebs cycleandoxidative phosphorylationprovidesmost ofthe energy of acellunder aerobic conditions.
Figure 2.1Schematic diagram ofmammalian cells (Boumphrey, 2009)
2.2.1 Nutrition management
Mammalian cellsneed various classes ofnutrients: the macronutrients, presents in mM in the culture medium, carbohydrates, amino acids, vitamins, and micronutriments, present
15
in M, inorganic ions, each bringingthe cell elementary content in atomssuch ascarbon (C), oxygen (O), hydrogen(H), phosphorus (Pi), sodium, potassium, calcium, magnesium, and nitrogen (N). There are other trace elements (<M) such as zinc, selenium, copper, manganese oriron (Fe) (to name a few)alsorequired by thecellsbut inmuch smaller amounts plus defined growth factors. Ithas been demonstrated that the nutritional statusof mammalian cellsstronglyinfluencetheir ability for growth and production.In other words, medium composition is known to affect the productivity ofmammalian cells in vitro (Grosvenor, 2008). Furthermore, fed-batch culture protocols are now widely used since these allow for maintaining and controlgrowth condition and is now seen essentialto extend culture durationfor improving final product titers (up to 5 g/L) (Yang & Xiong, 2012). Fed-batch processes are currently highly favorable for industrial scale production because they are reproducible, easy to operate and scale up to as high as 20,000-liter volumes (Whitford, 2006). In order to develop a fed-batch protocol, parameters as optimal feed profile and time should be identified which requires an efficient process monitoring system. Although on-line measurements techniques have been developed during past years, an available tool allowing prediction of cell behaviour in response to culture conditions is still desirable. In that context, kinetic models can be useful as a tool for a priori determination of cells requirements for further implementation of control (Pörtner, Schwabe, & Frahm, 2004). Nutrients are then feeding the entry points of the cell metabolism.
2.2.2 Cellular metabolism - The way from genotype to phenotype
Cell functions and operations are accomplished through a series of biochemical reactions usually occurring inside a cell. biochemical reactions involve in the processes of taking up complex molecules (sources of carbon, nitrogen), and further breaking down to produce energy and other intermediate molecules (Alberts et al., 2002). Intermediate molecules finally build up new macromolecules and cellular components (Barnes et al., 2000). Enzymes are protein catalysts that control biochemical reactions and a protein itself consists of a string of amino acids, each one of which is coded by the string of DNA constituting a gene. Recalling that biochemical reactions involve in the conversion of substrates into products, often by transporting chemical groups, giving the function to the
16
compound, to or from the substrates.Thereare sixmajor classes ofbiochemical reactions involved in cellular metabolism (Berg, Tymoczko, & Stryer, 2002)(Table 2.1).
Table 2.1 Types of reactions involved in metabolism
Classes of reaction Mechanism Nomenclature
Enzyme Commission
Oxidation - Reduction Electron Transfer EC 1 : Oxydoreductases Transfer of a group Transfer of a functional group
from one to another
EC 2 : Transferases Hydrolysis Hydrolysis of a biochemical bond EC 3 : Hydrolases Addition / Subtractionof
functional groups
Additionof a functional groupsto a double bondorsubtractionforma double bond
EC 4 : Lyases
Isomeration Rearrangementof atoms EC 5 : Isomerases
“ Ligation “ involving ATP
lysis Formation of covalent bonds
EC 6 : Ligases
Biochemical reactions are thus managed through enzyme-powered pathways in cells. These series of biochemical reactions are collectively known as cellular metabolism. Cell metabolism thus leads to the passage of information between genotype (information held in genome) and phenotype (growth and cell metabolism) (Lewontin, 2011).
2.2.2.1 Catabolism and anabolism – Inputs and outputs of cellular primary metabolism The cell metabolism consists of two major interdependent parts, with the catabolism and the anabolism (Figure 2.2). Catabolism is responsible for the breakdown of complex organic compounds, nutrients, and macromolecules, while providing positive energy (ATP) and redox potential (NADH, and NADPH) and feeding the rest of the metabolism in precursor molecules. The other part, the anabolism, is responsible for the synthesis of metabolites and macromolecules, from precursors, which are required for cell functions, growth and viability. Anabolism is known to be highly demanding in energy and redox potential (Steuer et al., 2006). Under aerobic condition, oxidative phosphorylation is responsible for massive energy production in support of anabolism (Lunt & Vander Heiden, 2011).