HAL Id: hal-02865112
https://hal.archives-ouvertes.fr/hal-02865112
Submitted on 11 Jun 2020
HAL is a multi-disciplinary open access
archive for the deposit and dissemination of
sci-entific research documents, whether they are
pub-lished or not. The documents may come from
teaching and research institutions in France or
abroad, or from public or private research centers.
L’archive ouverte pluridisciplinaire HAL, est
destinée au dépôt et à la diffusion de documents
scientifiques de niveau recherche, publiés ou non,
émanant des établissements d’enseignement et de
recherche français ou étrangers, des laboratoires
publics ou privés.
Ecological Platform for Assimilating Data (EcoPAD,
v1.0) into models
Yuanyuan Huang, Mark Stacy, Jiang Jiang, Nilutpal Sundi, Shuang Ma,
Volodymyr Saruta, Chang Gyo Jung, Zheng Shi, Jianyang Xia, Paul J.
Hanson, et al.
To cite this version:
Yuanyuan Huang, Mark Stacy, Jiang Jiang, Nilutpal Sundi, Shuang Ma, et al.. Realized
ecologi-cal forecast through an interactive Ecologiecologi-cal Platform for Assimilating Data (EcoPAD, v1.0) into
models. Geoscientific Model Development, European Geosciences Union, 2019, 12 (3), pp.1119-1137.
�10.5194/gmd-12-1119-2019�. �hal-02865112�
https://doi.org/10.5194/gmd-12-1119-2019 © Author(s) 2019. This work is distributed under the Creative Commons Attribution 4.0 License.
Realized ecological forecast through an interactive Ecological
Platform for Assimilating Data (EcoPAD, v1.0) into models
Yuanyuan Huang1,2, Mark Stacy3, Jiang Jiang1,4, Nilutpal Sundi5, Shuang Ma1,6, Volodymyr Saruta1,6, Chang Gyo Jung1,6, Zheng Shi1, Jianyang Xia7,8, Paul J. Hanson9, Daniel Ricciuto9, and Yiqi Luo1,6,10
1Department of Microbiology and Plant Biology, University of Oklahoma, Norman, Oklahoma, USA 2Laboratoire des Sciences du Climat et de l’Environnement, 91191 Gif-sur-Yvette, France
3University of Oklahoma Information Technology, Norman, Oklahoma, USA
4Key Laboratory of Soil and Water Conservation and Ecological Restoration in Jiangsu Province, Collaborative Innovation
Center of Sustainable Forestry in Southern China of Jiangsu Province, Nanjing Forestry University, Nanjing, Jiangsu, China
5Department of Computer Science, University of Oklahoma, Norman, Oklahoma, USA
6Center for Ecosystem Science and Society, Northern Arizona University, Flagstaff, Arizona, USA
7Tiantong National Forest Ecosystem Observation and Research Station, School of Ecological and Environmental Sciences,
East China Normal University, Shanghai 200062, China
8Research Center for Global Change and Ecological Forecasting, East China Normal University, Shanghai 200062, China 9Environmental Sciences Division and Climate Change Science Institute, Oak Ridge National Laboratory,
Oak Ridge, Tennessee, USA
10Department of Earth System Science, Tsinghua University, Beijing 100084, China
Correspondence: Yuanyuan Huang ([email protected]) and Yiqi Luo ([email protected]) Received: 18 March 2018 – Discussion started: 25 May 2018
Revised: 14 January 2019 – Accepted: 9 March 2019 – Published: 25 March 2019
Abstract. Predicting future changes in ecosystem services is not only highly desirable but is also becoming feasible as several forces (e.g., available big data, developed data assim-ilation (DA) techniques, and advanced cyber-infrastructure) are converging to transform ecological research into quan-titative forecasting. To realize ecological forecasting, we have developed an Ecological Platform for Assimilating Data (EcoPAD, v1.0) into models. EcoPAD (v1.0) is a web-based software system that automates data transfer and processing from sensor networks to ecological forecasting through data management, model simulation, data assimilation, forecast-ing, and visualization. It facilitates interactive data–model integration from which the model is recursively improved through updated data while data are systematically refined under the guidance of model. EcoPAD (v1.0) relies on data from observations, process-oriented models, DA techniques, and the web-based workflow.
We applied EcoPAD (v1.0) to the Spruce and Peat-land Responses Under Climatic and Environmental change (SPRUCE) experiment in northern Minnesota. The
EcoPAD-SPRUCE realizes fully automated data transfer, feeds mete-orological data to drive model simulations, assimilates both manually measured and automated sensor data into the Ter-restrial ECOsystem (TECO) model, and recursively fore-casts the responses of various biophysical and biogeochemi-cal processes to five temperature and two CO2treatments in
near-real time (weekly). Forecasting with EcoPAD-SPRUCE has revealed that mismatches in forecasting carbon pool dy-namics are more related to model (e.g., model structure, pa-rameter, and initial value) than forcing variables, opposite to forecasting flux variables. EcoPAD-SPRUCE quantified acclimations of methane production in response to warm-ing treatments through shifted posterior distributions of the CH4:CO2 ratio and the temperature sensitivity (Q10) of
methane production towards lower values. Different case studies indicated that realistic forecasting of carbon dynam-ics relies on appropriate model structure, correct parameter-ization, and accurate external forcing. Moreover, EcoPAD-SPRUCE stimulated active feedbacks between experimenters and modelers to identify model components to be improved
and additional measurements to be taken. It has become an interactive model–experiment (ModEx) system and opens a novel avenue for interactive dialogue between modelers and experimenters. Altogether, EcoPAD (v1.0) acts to integrate multiple sources of information and knowledge to best in-form ecological forecasting.
1 Introduction
One ambitious goal of ecology as a science discipline is to forecast states and services of ecological systems. Forecast-ing in ecology is not only desirable for scientific advances in this discipline but also has practical values to guide re-source management and decision-making towards a sustain-able planet Earth. The practical need for ecological fore-casting is particularly urgent in this rapidly changing world, which is experiencing unprecedented natural resource deple-tion, increasing food demand, serious biodiversity crisis, ac-celerated climate changes, and widespread pollution in the air, waters, and soils (Clark et al., 2001; Mouquet et al., 2015). As a result, a growing number of studies have re-ported forecasting of, e.g., phenology (Diez et al., 2012), car-bon dynamics (Luo et al., 2016; Gao et al., 2011; Thomas et al., 2017), species dynamics (Clark et al., 2003; Kearney et al., 2010), pollinator performance (Corbet et al., 1995), epi-demics (Ong et al., 2010), fishery (Hare et al., 2010), algal bloom (Stumpf et al., 2009), crop yield (Bastiaanssen and Ali, 2003), biodiversity (Botkin et al., 2007), plant extinction risk (Fordham et al., 2012), and ecosystem service (Craft et al., 2009) in the last several decades. Despite its broad appli-cations, ecological forecasting is still sporadically practiced and lags far behind demand due to the lack of infrastructure that enables timely integration of models with data. This pa-per introduces a fully interactive infrastructure, the Ecologi-cal Platform for Assimilating Data (EcoPAD, v1.0) into mod-els, to inform near-time ecological forecasting with iterative data–model integration.
Ecological forecasting relies on both models and data. However, currently the ecology research community has not yet adequately integrated observations with models to best inform forecasts. Forecasts generated from scenario ap-proaches are qualitative and scenarios are often not based on ecological knowledge (Coreau et al., 2009, 2010). Data-driven forecasts using statistical methods are generally lim-ited for extrapolation and sometimes contaminated by con-founding factors (Schindler and Hilborn, 2015). The recent emergent mechanism-free nonparametric approach, which depends on the statistical pattern extracted from data, is re-ported to be promising for short-term forecast (Ward et al., 2014; Perretti et al., 2013; Sugihara et al., 2012) but has lim-ited capability in long-term prediction due to the lack of rel-evant ecological mechanisms. Process-based models provide capacity in long-term prediction and flexibility in capturing
short-term dynamics on the basis of a mechanistic under-standing (Coreau et al., 2009; Purves et al., 2013). Wide ap-plications of process-based models are limited by their often complicated numerical structure and sometimes unrealistic parameterization (Moorcroft, 2006). The complex and uncer-tain nature of ecology precludes the practice of incorporating as many processes as possible into mechanistic models. Our current incomplete knowledge about ecological systems and unrepresented processes under novel conditions is partly re-flected in model parameters associated with large uncertain-ties. Good forecasting therefore requires effective communi-cation between process-based models and data to estimate re-alistic model parameters and capture context-dependent eco-logical phenomena.
Data–model fusion, or data–model integration, is an im-portant step to combine models with data. But previous data– model integration activities have mostly been done in an ad hoc manner instead of being interactive. For example, data from a network of eddy covariance flux tower sites across the United States and Canada were compared with gross primary productivity (GPP) estimated from different models (Schae-fer et al., 2012). Luo and Reynolds (1999) used a model to examine ecosystem responses to gradual, as in the real world, vs. step increases in CO2concentration as in elevated CO2
experiments. Parton et al. (2007) parameterized CO2impacts
in an ecosystem model with data from a CO2experiment in
Colorado. Such model–experiment interactions encounter a few issues: (1) models are not always calibrated for individ-ual sites and therefore not accurate; (2) it is not very effective because it is usually a one-time practice without many itera-tive processes between experimenters and modelers (Dietze et al., 2013; Lebauer et al., 2013); (3) it is usually unidirec-tional as data are normally used to train models, while the guidance of the model for efficient data collection is lim-ited; and (4) it is not streamlined and could not be dissem-inated with common practices among the research commu-nity (Lebauer et al., 2013; Dietze et al., 2013; Walker et al., 2014).
A few research groups have developed data assimilation systems to facilitate data–model integration in a systematic way. For example, data–model integration systems, such as the Data Assimilation Research Testbed – DART (Anderson et al., 2009) – and the Carbon Cycle Data Assimilation Sys-tems – CCDAS (Scholze et al., 2007; Peylin et al., 2016), combine various data streams (e.g., FLUXNET data, satellite data, and inventory data) with process-based models through data assimilation algorithms such as the Kalman filter (An-derson et al., 2009) and variational methods (Peylin et al., 2016). These data assimilation systems automate model pa-rameterization and provide an avenue to systematically im-prove models by combining as much data as possible. Data-informed model improvements normally happen after the end of a field experiment, and interactive data–model integration is limited as feedbacks from models to ongoing experimental studies are not adequately realized. In addition, wide
appli-cations of these data assimilation systems in ecological fore-casting are constrained by limited user interactions with a steep learning curve to understand these systems, especially for experimenters who have limited training in modeling.
Web-based technology facilitates interactions. Web-based modeling, which provides user-friendly interfaces to run models in the background, is usually supported by the sci-entific workflow, a sequence of processes through which a piece of work passes from initiation to completion. For example, TreeWatch.Net (https://treewatch.net, last access: January 2019) has recently been developed to make use of high-precision individual tree-monitoring data to parameter-ize process-based tree models in real time and to assess in-stant tree hydraulics and carbon status with online result vi-sualization (Steppe et al., 2016). Although the web portal of TreeWatch.Net is currently limited to the purpose of visual-ization, it broadens the application of data–model integration and strengthens the interaction between modeling research and the general public. The Predictive Ecosystem Analyzer (PEcAn) is a scientific workflow that wraps around differ-ent ecosystem models and manages the flows of informa-tion coming in and out of the model (Lebauer et al., 2013). PEcAn enables web-based model simulations. Such a work-flow has advantages, for example making ecological model-ing and analysis convenient, transparent, reproducible, and adaptable to new questions (Lebauer et al., 2013) and en-couraging user–model interactions. PEcAn uses the Bayesian meta-analysis to synthesize plant trait data to estimate model parameters and associated uncertainties, i.e., the prior in-formation for process-based models. Parameter uncertain-ties are propagated to model uncertainuncertain-ties and displayed as outputs. It is still not fully interactive in that states are not updated iteratively according to observations and the web-based data assimilation and ecological forecasting have not yet been fully realized.
Iterative model–data integration provides an approach to constantly improve ecological forecasting and is an impor-tant step, especially in realizing near-real-time ecological forecasting. Instead of projecting into the future by assimilat-ing observations only once, iterative forecastassimilat-ing constantly updates forecasting along with ongoing new data streams and/or improved models. Forecasting is likely to be im-proved unidirectionally so that either only models are up-dated through observations, or only data collections and field experimentations are improved according to theoretical and model information, but not both. Ecological forecasting can also be bidirectionally improved so that both models and field experimentations are optimized hand-in-hand over time. Al-though the bidirectional case is rare in ecological forecast-ing, unidirectional iterative forecasting has been reported. One excellent example of forecasting by dynamically and repeatedly integrating data with models is from infectious disease studies (Niu et al., 2014; Ong et al., 2010). The dy-namics of infectious diseases are traditionally captured by susceptible–infected–removed (SIR) models. In the
forecast-ing of the Sforecast-ingapore H1N1-2009 infections, SIR model pa-rameters and the number of individuals in each state were updated daily, combining data renewed from local clinical reports. The evolution of epidemic-related parameters and states was captured by iteratively assimilating observations to inform forecasting. As a result, the model correctly fore-casted the timing of the peak and decline of the infection ahead of time. Iterative forecasting dynamically integrates data with models and makes the best use of both data and theoretical understandings of ecological processes.
The aim of this paper is to present a fully interactive plat-form, the web-based EcoPAD (v1.0), to best inform ecolog-ical forecasting. The interactive feature of EcoPAD (v1.0) is reflected in iterative model updating and forecasting by dy-namically integrating models with new observations, bidirec-tional feedbacks between experimenters and modelers, and flexible user–model communication through web-based sim-ulation, data assimilation, and forecasting. Such an interac-tive platform provides the infrastructure to effecinterac-tively inte-grate available resources from models and data, modelers and experimenters, and scientists and the general public to im-prove scientific understanding of ecological processes, boost ecological forecasting practice, and transform ecology to-wards quantitative forecasting.
In the following sections, we first describe the system de-sign and major components of EcoPAD (v1.0). We then use the Spruce and Peatland Responses Under Climatic and En-vironmental change (SPRUCE) experiment (Hanson et al., 2017) as a test bed to elaborate the functionality and new opportunities brought by the platform. We finally discuss the implications of EcoPAD (v1.0) for better ecological forecast-ing.
2 EcoPAD (v1.0): system design and components 2.1 General description: web-based data assimilation
and forecast
EcoPAD (v1.0) (https://ecolab.nau.edu/ecopad_portal/, last access: January 2019) focuses on linking ecological exper-iments and data with models and allows for easily acces-sible and reproducible data–model integration with interac-tive web-based simulation, data assimilation, and forecast capabilities. Specifically, EcoPAD (v1.0) enables automated near-time ecological forecasting that works hand-in-hand between modelers and experimenters and updates periodi-cally in a manner similar to weather forecasting. The system is designed to streamline web request–response, data man-agement, modeling, prediction, and visualization to boost the overall throughput of observational data, promote data– model communication, inform ecological forecasting, and improve scientific understanding of ecological processes (see the Supplement for detailed functionalities of EcoPAD v1.0).
To realize such data-informed ecological forecasting, the essential components of EcoPAD (v1.0) include experi-ments and data, process-based models, data assimilation techniques, and the scientific workflow (Figs. 1–3). The sci-entific workflow of EcoPAD (v1.0) that wraps around eco-logical models and data assimilation algorithms acts to move datasets in and out of structured and cataloged data collec-tions (metadata catalog), while leaving the logic of the eco-logical models and data assimilation algorithms untouched (Figs. 1, 3). Once a user makes a request through the web browser or command line utilities, the scientific workflow takes charge of triggering and executing corresponding tasks, be it pulling data from a remote server, running a particu-lar ecological model, automating forecasting, or making the result easily understandable to users (Figs. 1, 3). With the workflow, the system is agnostic to operation system, envi-ronment, and programming language and is built to horizon-tally scale to meet the demands of the model and the end-user community.
2.2 Components 2.2.1 Data
Data are an important component of EcoPAD (v1.0) and Eco-PAD (v1.0) offers systematic data management to digest di-verse data streams. The “big data” ecology generates a large volume of very different datasets across various scales (Mou-quet et al., 2015; Hampton et al., 2013). These datasets might have high temporal resolutions, such as those from real-time ecological sensors, or the display of spatial information from remote sensing sources and data stored in the geographic in-formation system (GIS). These datasets may also include, but are not limited to, inventory data, laboratory measure-ments, FLUXNET databases, or data from long-term ecolog-ical networks (Baldocchi et al., 2001; Johnson et al., 2010; Robertson et al., 2012). Such data contain information re-lated to environmental forcing (e.g., precipitation, temper-ature, and radiative forcing), site characteristics (e.g., soil texture and species composition), and biogeochemical com-position. Datasets in EcoPAD (v1.0) are derived from other research projects in comma-separated value files or other loosely structured data formats. These datasets are first de-scribed and stored with appropriate metadata via either man-ual operation or scheduled automation from sensors. Each project has a separate folder where data are stored. Data are generally separated into two categories. One is used as boundary conditions for modeling and the other category is related to observations that are used for data assimilation. Scheduled sensor data are appended to existing data files with prescribed frequency. Attention is then given to how the particular dataset varies over space (x, y) and time (t ). When the spatiotemporal variability is understood, it is then placed in metadata records that allow for query through its scientific workflow.
Figure 1. Schema of approaches to forecast future ecological re-sponses from common practice (a) and the Ecological Platform for Assimilation of Data (EcoPAD, v1.0) (b). The common prac-tice makes use of observations to develop or calibrate models to make predictions, while the EcoPAD (v1.0) approach advances the common practice through its fully interactive platform. EcoPAD (v1.0) consists of four major components: experiment and data, model, data assimilation, and the scientific workflow (green ar-rows or lines). Data and model are iteratively integrated through its data assimilation systems to improve forecasting. Its near-real-time forecasting results are shared among research groups through its web interface to guide new data collections. The scientific work-flow enables web-based data transfer from sensors, model simula-tion, data assimilasimula-tion, forecasting, result analysis, visualizasimula-tion, and reporting, encouraging broad user–model interactions, espe-cially for experimenters and the general public with a limited back-ground in modeling. Images from the SPRUCE field experiments (https://mnspruce.ornl.gov/, last access: January 2019) are used to represent the data collection and the flowchart of the TECO model is used to delegate ecological models.
2.2.2 Ecological models
A process-based ecological model is another essential com-ponent of EcoPAD (Fig. 1). In this paper, the Terrestrial ECOsystem (TECO) model is applied as a general ecologi-cal model for demonstration purposes since the workflow and data assimilation system of EcoPAD (v1.0) are relatively in-dependent of the specific ecological model. Linkages among the workflow, data assimilation system, and ecological model are based on messaging. For example, the data assimilation system generates parameters that are passed to ecological models. The state variables simulated from ecological mod-els are passed back to the data assimilation system. Modmod-els may have different formulations. As long as they take in the same parameters and generate the same state variables, they are functionally identical from the “eye” of the data assimi-lation system.
TECO simulates ecosystem carbon, nitrogen, water, and energy dynamics (Weng and Luo, 2008; Shi et al., 2016). The
original TECO model has four major submodules (canopy, soil water, vegetation dynamics, and soil carbon and nitro-gen) and is further extended to incorporate methane biogeo-chemistry and snow dynamics (Huang et al., 2017; Ma et al., 2017). As in the global land surface model CABLE (Wang et al., 2010; Wang and Leuning, 1998), canopy photosynthesis that couples surface energy and water and carbon fluxes is based on a two-big-leaf model (Wang and Leuning, 1998). Leaf photosynthesis and stomatal conductance are based on the common scheme from Farquhar et al. (1980) and Ball et al. (1987), respectively. Transpiration and associated la-tent heat losses are controlled by stomatal conductance, soil water content, and the rooting profile. Evaporation losses of water are balanced between the soil water supply and the at-mospheric demand based on the difference between satura-tion vapor pressure and the actual atmospheric vapor pres-sure. Soil moisture in different soil layers is regulated by water influxes (e.g., precipitation and percolation) and ef-fluxes (e.g., transpiration and runoff). Vegetation dynamic tracks processes such as growth, allocation, and phenology. The soil carbon and nitrogen module tracks carbon and ni-trogen through processes such as litterfall, soil organic mat-ter (SOM) decomposition, and mineralization. SOM decom-position modeling follows the general form of the Century model (Parton et al., 1988) as in most Earth system models. SOM is divided into pools with different turnover times (the inverse of decomposition rates), which are modified by envi-ronmental factors such as the soil temperature and moisture. 2.2.3 Data assimilation
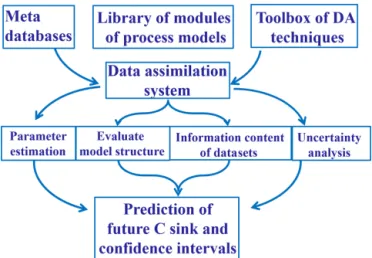
Data assimilation is growing in importance as process-based ecological models, despite largely simplifying the real sys-tems, need to be complex enough to address sophisticated ecological issues. These ecological issues are composed of an enormous number of biotic and abiotic factors interact-ing with each other. Data assimilation techniques provide a framework to combine models with data to estimate model parameters (Shi et al., 2016), test alternative ecological hy-potheses through different model structures (Liang et al., 2015), assess the information content of datasets (Weng and Luo, 2011), quantify uncertainties (Zhou et al., 2012; Weng et al., 2011; Keenan et al., 2012), derive emergent ecological relationships (Bloom et al., 2016), identify model errors, and improve ecological predictions (Luo et al., 2011b) (Fig. 2). Under the Bayesian paradigm, data assimilation techniques treat the model structure and the initial and parameter val-ues as priors that represent our current understanding of the system. As new information from observations or data be-comes available, model parameters and state variables can be updated accordingly. The posterior distributions of esti-mated parameters or state variables are imprinted with infor-mation from the model, observations, and data as the chosen parameters act to reduce mismatches between observations and model simulations. Future predictions benefit from such
Figure 2. The data assimilation system inside the Ecological Plat-form for Assimilation of Data (EcoPAD, v1.0) towards better fore-casting of terrestrial carbon dynamics.
constrained posterior distributions through forward model-ing (Fig. S1 in the Supplement). As a result, the probability density function of predicted future states through data as-similation normally has a narrower spread than that without data assimilation when everything else is equal (Niu et al., 2014; Luo et al., 2011b; Weng and Luo, 2011).
EcoPAD (v1.0) is open to different data assimilation tech-niques since the scientific workflow of EcoPAD (v1.0) is in-dependent of the specific data assimilation algorithm. For demonstration, Markov chain Monte Carlo (MCMC) (Xu et al., 2006) is described in this study.
MCMC is a class of sampling algorithms to draw samples from a probability distribution obtained through constructed Markov chains to approximate the equilibrium distribution. The Bayesian-based MCMC method takes into account var-ious uncertainty sources that are crucial in interpreting and delivering forecasting results (Clark et al., 2001). In the ap-plication of MCMC, the posterior distribution of a parame-ter for given observations is proportional to the prior distri-bution of that parameter and the likelihood function linked to the fit or match (or cost function) between model simu-lations and observations. EcoPAD (v1.0) currently adopts a batch mode; that is, the cost function is treated as a single function to be minimized and different observations are stan-dardized by their corresponding standard deviations (Xu et al., 2006). For simplicity, we assume uniform distributions in priors and Gaussian or multivariate Gaussian distributions in observational errors, which can be operationally expanded to other specific distribution forms depending on the avail-able information. A detailed description is availavail-able in Xu et al. (2006).
2.2.4 Scientific workflow
EcoPAD (v1.0) relies on its scientific workflow to interface with ecological models and data assimilation algorithms, manage diverse data streams, and automate iterative ecologi-cal forecasting in response to various user requests. Work-flow is a relatively new concept in the ecology literature but is essential to realize real- or near-real-time forecasting. Thus, we describe it in detail below. The essential compo-nents of the scientific workflow of EcoPAD (v1.0) include the metadata catalog, web application-programming inter-face (API), the asynchronous task or job queue (Celery), and the container-based virtualization platform (docker). The workflow system of EcoPAD (v1.0) also provides structured result access and visualization.
Metadata catalog and data management
Datasets can be placed and queried in EcoPAD (v1.0) via a common metadata catalog, which allows for effective man-agement of diverse data streams. Calls for good manman-agement of current large and heterogeneous ecological datasets are common (Vitolo et al., 2015; Michener and Jones, 2012; Elli-son, 2010). Kepler (Ludascher et al., 2006) and the Analytic Web (Osterweil et al., 2010) are two example systems that endeavor to provide efficient data management through the storage of metadata, including clear documentation of data provenance. Similarly to these systems, EcoPAD (v1.0) takes advantage of modern information technology, especially the metadata catalog, to manage diverse data streams. The Eco-PAD (v1.0) metadata scheme includes a description of the data product, security, access pattern, and time stamp of last metadata update. We use MongoDB (https://www.mongodb. com/, last access: January 2019), a NoSQL database technol-ogy, to manage heterogeneous datasets to make documenta-tion, query, and storage fast and convenient. Through Mon-goDB, measured datasets can be easily fed into ecological models for various purposes such as to initialize the model, calibrate model parameters, evaluate model structure, and drive model forecasts. For datasets from real-time ecologi-cal sensors that are constantly updating, EcoPAD (v1.0) is set to automatically fetch new data streams with adjustable frequency according to research needs.
Web API, asynchronous task queue, and docker
The representational state transfer (RESTful) API can de-liver data to a wide variety of applications is the gateway of EcoPAD (v1.0) and enables a wide array of user inter-faces and data dissemination activities. Once a user makes a request, such as through clicking on relevant buttons from a web browser, the request is passed through the RESTful API to trigger specific tasks. The RESTful API bridges the talk between the client (e.g., a web browser or command line terminal) and the server (Fig. 3). The API exploits the full
functionality and flexibility of the HyperText Transfer Proto-col (HTTP) such that data can be retrieved and ingested from EcoPAD (v1.0) through the use of simple HTTP headers and verbs (e.g., GET, PUT, POST, etc.). Hence, a user can in-corporate summary data from EcoPAD (v1.0) into a website with a single line of html code. Users will also be able to ac-cess data directly through programming environments like R, Python, and MATLAB. Simplicity, ease of use, and interop-erability are among the main advantages of this API, which enables web-based modeling.
Celery (https://github.com/celery/celery, last access: Jan-uary 2019) is an asynchronous task or job queue that runs in the background (Fig. 3). The task queue (i.e., Celery) is a mechanism used to distribute work across work units such as threads or machines. Celery communicates through mes-sages, and EcoPAD (v1.0) takes advantage of the RabbitMQ (https://www.rabbitmq.com/, last access: January 2019) to manage messaging. After the user submits a command, the request or message is passed to Celery via the RESTful API. These messages may trigger different tasks, which include but are not limited to pulling data from a remote server where original measurements are located, accessing data through a metadata catalog, running model simulations with user-specified parameters, conducting data assimilation that recur-sively updates model parameters, forecasting future ecosys-tem status, and post-processing model results for visualiza-tion. The broker inside Celery receives task messages and handles out tasks to available Celery workers that perform the actual tasks (Fig. 3). Celery workers are in charge of receiving messages from the broker, executing tasks, and returning task results. The worker can be a local or re-mote computation resource (e.g., the cloud) that has con-nectivity to the metadata catalog. Workers can be distributed into different information technology (IT) infrastructures, which makes the EcoPAD (v1.0) workflow expandable. Each worker can perform different tasks depending on the tools in-stalled in each worker. One task can also be distributed to dif-ferent workers. In such a way, the EcoPAD (v1.0) workflow enables the parallelization and distributed computation of ac-tual modeling tasks across various IT infrastructures and is flexible in implementing additional computational resources by connecting additional workers.
Another key feature that makes EcoPAD (v1.0) easily portable and scalable among different operation systems is the utilization of a container-based virtualization platform, the docker (https://www.docker.com/, last access: January 2019). The docker can run many applications that rely on different libraries and environments on a single kernel with its lightweight containerization. Tasks that execute TECO in different ways are wrapped inside different docker contain-ers that can “talk” with each other. Each docker container embeds the ecosystem model into a complete file system that contains everything needed to run an ecosystem model: the source code, model input, run time, system tools, and li-braries. Docker containers are both hardware-agnostic and
Figure 3. The scientific workflow of EcoPAD (v1.0). The workflow wraps ecological models and data assimilation algorithms with the docker containerization platform. Users trigger different tasks through the representational state transfer (RESTful) application-programming interface (API). Tasks are managed through the asynchronous task queue, Celery. Tasks can be executed concurrently on a single or more worker servers across different scalable IT infrastructures. MongoDB is a database software that takes charge of data management in EcoPAD (v1.0), and RabbitMQ is a message broker.
platform-agnostic, and they are not confined to a particu-lar language, framework, or packaging system. Docker con-tainers can be run from a laptop, workstation, virtual ma-chine, or any cloud compute instance. This is done to support the widely varied number of ecological models running in various languages (e.g., MATLAB, Python, Fortran, C, and C++) and environments. In addition to wrapping the ecosys-tem model into a docker container, software applied in the workflow, such as Celery, RabbitMQ, and MongoDB, are all lightweight and portable encapsulations through docker con-tainers. Therefore, EcoPAD (v1.0) is readily portable and ap-plicable in different environments.
Structured result access and visualization
EcoPAD (v1.0) enables structured result storage, access, and visualization to track and analyze data–model fusion prac-tice. Upon the completion of the model task, the model wrap-per code calls a post-processing callback function. This call-back function allows model-specific data requirements to be added to the model result repository. Each task is associated with a unique task ID and model results are stored within the local repository that can be queried by the unique task ID. The storage and query of model results are realized via the MongoDB and RESTful API (Fig. 3). Researchers are authorized to review and download model results and
param-eters submitted for each model run through a web-accessible URL (link). The EcoPAD (v1.0) web page also displays a list of historical tasks (with URL) performed by each user. All current and historical model inputs and outputs are avail-able to download, including the aggregated results produced for graphical web applications. In addition, EcoPAD (v1.0) also provides a task report that contains an all-inclusive re-cap of submitted parameters, task status, and model outputs with links to all data and graphical results for each task. Such structured result storage and access make sharing, tracking, and referring to modeling studies instantaneous and clear.
3 EcoPAD (v1.0) performance at test bed – SPRUCE 3.1 SPRUCE project overview
EcoPAD (v1.0) is being applied to the SPRUCE experiment located at the USDA Forest Service Marcell Experimental Forest (MEF; 47◦30.4760N, 93◦27.1620W) in northern
Min-nesota (Kolka et al., 2011). SPRUCE is an ongoing project that focuses on long-term responses of northern peatland to climate warming and increased atmospheric CO2
concentra-tion (Hanson et al., 2017). At SPRUCE, ecologists measure various aspects of responses of organisms (from microbes to trees) and ecological functions (carbon, nutrient, and water cycles) to a warming climate. One of the key features of the
SPRUCE experiments is manipulative deep soil–peat heat-ing (0–3 m) and whole-ecosystem warmheat-ing treatments (peat +air warmings), which include tall trees (> 4 m) (Hanson et al., 2017). Together with elevated atmospheric CO2
treat-ments, SPRUCE provides a platform for exploring mech-anisms controlling the vulnerability of orgmech-anisms, biogeo-chemical processes, and ecosystems in response to future novel climatic conditions. The SPRUCE peatland is espe-cially sensitive to future climate change and also plays an im-portant role in feeding back to future climate change through greenhouse gas emissions as it stores a large amount of soil organic carbon. Vegetation in the SPRUCE site is dominated by Picea mariana (black spruce) and Sphagnum spp. (peat moss). The studied peatland also has an understory that in-cludes ericaceous and woody shrubs. There are also a limited number of herbaceous species. The whole-ecosystem warm-ing treatments include a large range of both aboveground and belowground temperature manipulations (ambient, con-trol plots of +0, +2.25, +4.5, +6.75, and +9◦C) in large 115 m2open-topped enclosures with elevated CO2
manipu-lations (+0 or +500 ppm). The difference between ambient and +0◦C treatment plots is the open-topped and controlled-environment enclosures.
The SPRUCE project generates a large variety of ob-servational datasets that reflect ecosystem dynamics from different scales and are available from the project web page (https://mnspruce.ornl.gov/, last access: January 2019) and file transfer protocol (FTP) site (ftp://sprucedata.ornl. gov/, last access: January 2019). These datasets come from multiple sources, including half-hourly automated sen-sor records, species surveys, laboratory measurements, and laser-scanning images. The involvement of both modeling and experimental studies in the SPRUCE project creates the opportunity for data–model communication. Datasets are pulled from SPRUCE archives and stored in the EcoPAD (v1.0) metadata catalog for running the TECO model and conducting data–model fusion or forecasting. The TECO model has been applied to simulate and forecast carbon dy-namics with productions of CO2 and CH4 from different
carbon pools, soil temperature response, snow depth, and freeze–thaw cycles at the SPRUCE site (Jiang et al., 2018; Huang et al., 2017; Ma et al., 2017).
3.2 EcoPAD-SPRUCE web portal
We assimilate multiple streams of data from the SPRUCE experiment to the TECO model using the MCMC algorithm and forecast ecosystem dynamics in both near time and for the next 10 years. Our forecasting system for SPRUCE is available at https://ecolab.nau.edu/ecopad_portal/ (last ac-cess: January 2019). From the web portal, users can check our current near- and long-term forecasting results, conduct model simulation, data assimilation, and forecasting runs, and analyze and visualize model results. Detailed
informa-Figure 4. Schema of interactive communication between model-ers and experimentmodel-ers through the prediction–question–discussion– adjustment–prediction cycle to improve ecological forecasting. The schema is inspired by an episode of experimenter–modeler com-munication stimulated by the EcoPAD-SPRUCE platform. The ini-tial methane model constrained by static-chamber methane mea-surements was used to predict the relative contributions of three methane emission pathways (i.e., ebullition, plant-mediated trans-portation (PMT), and diffusion) to the overall methane fluxes un-der different warming treatments (+0, +2.25, +4.5, +6.75, and +9◦C). The initial results indicated a dominant contribution from ebullition, especially under +9◦C, which was doubted by experi-menters. The discrepancy stimulated communication between mod-elers and experimenters, with detailed information listed in Table 1. After extensive discussion, the model structure was adjusted and field observations were reevaluated. A second round of forecasting yielded more reliable predictions.
tion about the interactive web portal is provided in the Sup-plement.
3.3 Near-time ecosystem forecasting and feedback to experimenters
As part of the forecasting functionality, EcoPAD-SPRUCE automates near-time (weekly) forecasting with continuously updated observations from SPRUCE experiments (Fig. 4). We set up the system to automatically pull new data streams every Sunday from the SPRUCE FTP site that holds obser-vational data and update the forecasting results based on new data streams. Updated forecasting results for the next week are customized for the SPRUCE experiments with differ-ent manipulative treatmdiffer-ents and displayed in the EcoPAD-SPRUCE portal. At the same time, these results are sent back to SPRUCE communities and displayed together with near-term observations for experimenter reference.
3.4 New approaches to ecological studies towards better forecasting
3.4.1 Case 1: interactive communications among modelers and experimenters
EcoPAD-SPRUCE provides a platform to stimulate in-teractive communication between modelers and experi-menters through the loop of prediction–question–discussion– adjustment–prediction (Fig. 4). We illustrate how the prediction–question–discussion–adjustment–prediction cy-cle and stimulation of modeler–experimenter communica-tion improve ecological prediccommunica-tions through one episode dur-ing the study of the relative contribution of different path-ways to methane emissions. An initial methane model was built upon information (e.g., site characteristics and envi-ronmental conditions) provided by SPRUCE field scientists, taking into account important processes in methane dynam-ics, such as production, oxidation, and emissions, through three pathways (i.e., diffusion, ebullition, and plant-mediated transportation). The model was used to predict the relative contributions of different pathways to overall methane emis-sions under different warming treatments after being con-strained by measured surface methane fluxes. Initial fore-casting results, which indicated a strong contribution from ebullition under high warming treatments, were sent back to the SPRUCE group. Experimenters doubted such a high con-tribution from the ebullition pathway and a discussion was stimulated. It is difficult to accurately distinguish the three pathways from field measurements. Field experimenters pro-vided potential avenues to extract measurement information related to these pathways, while modelers examined model structure and parameters that may not be well constrained by available field information. A detailed discussion is provided in Table 1. After extensive discussion, several adjustments were adopted as a first step to move forward. For example, the three-porosity model that was used to simulate the diffu-sion process was replaced by the Millington–Quirk model to more realistically represent methane diffusions in peat soil; the measured static-chamber methane fluxes were also ques-tioned and scrutinized more carefully to clarify that they did not capture the episodic ebullition events. Measurements such as these related to pore water gas data may provide ad-ditional inference related to ebullition. The updated forecast-ing is more reasonable than the initial results, although more studies are in need to ultimately quantify methane fluxes from different pathways.
3.4.2 Case 2: acclimation of ecosystem carbon cycling to experimental manipulations
As a first step, CH4static-chamber flux measurements were
assimilated into TECO to assess potential acclimation phe-nomena during methane production under five warming treatments (+0, +2.25, +4.5, +6.75, +9◦C). Initial results
Figure 5. Posterior distribution of the ratio of CH4:CO2(a) and the
temperature sensitivity of methane production (Q10_CH4, b) under five warming treatments.
indicated a reduction in both the CH4:CO2 ratio and the
temperature sensitivity of methane production based on their posterior distributions (Fig. 5). The mean CH4:CO2 ratio
decreased from 0.675 (+0◦C treatment) to 0.505 (+9◦C), while the temperature sensitivity (Q10) for CH4production
decreased from 3.33 (+0◦C) to 1.22 (+9◦C treatment). Such shifts quantify the potential acclimation of methane produc-tion to warming, and future climate warming is likely to have a smaller impact on emissions than most current predictions that do not take account of acclimation.
Despite the fact that these results are preliminary, as more relevant datasets are under collection with current ongo-ing warmongo-ing manipulations and measurements, assimilatongo-ing observations through EcoPAD (v1.0) provides a quantita-tive approach to assess acclimation through time. Melillo et al. (2017) revealed that the thermal acclimation of soil res-piration in Harvard Forest is likely to be phase (time) de-pendent during their 26-year soil warming experiment. Eco-PAD (v1.0) provides the possibility to trace the temporal path of acclimation with its streamlined structure and archive ca-pacity. Shi et al. (2015) assimilated carbon-related measure-ments in a tallgrass prairie into the TECO model to study acclimation after 9-year warming treatments. They revealed a reduction in the allocation of GPP to shoot, the turnover rates of the shoot and root carbon pools, and an increase in litter and fast carbon turnovers in response to warming treat-ments. Similarly, as time goes on, the SPRUCE experiment will generate more carbon-cycling-related datasets under dif-ferent warming and CO2treatments, which can be mounted
to EcoPAD (v1.0) to systematically quantify acclimations in carbon cycling through time in the future.
3.4.3 Case 3: partitioning of uncertainty sources Uncertainties in ecological studies can come from observa-tions (including the forcing that drives the model), different model structures to represent the real world, and the specified model parameters (Luo et al., 2016). Previous studies tended to focus on one aspect of the uncertainty sources instead
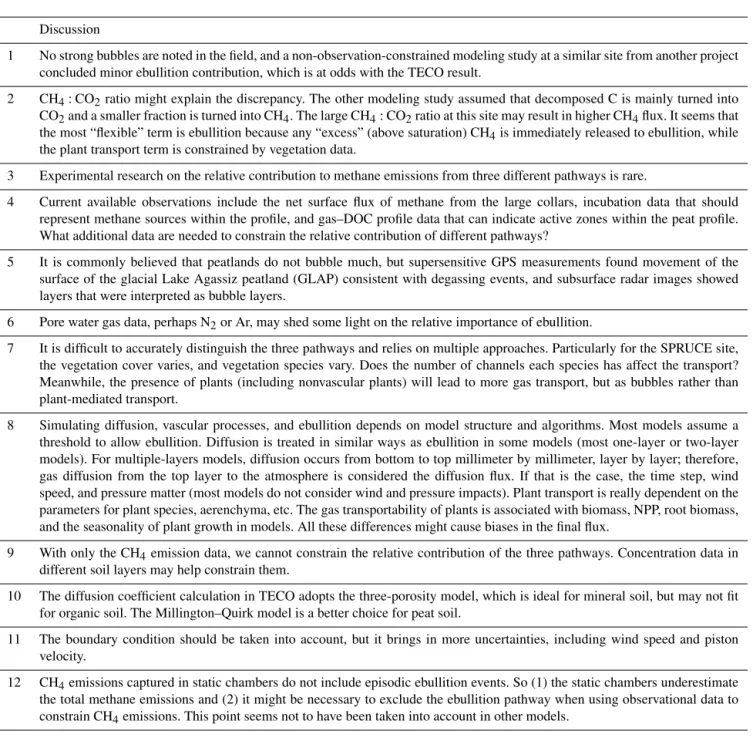
Table 1. Discussion stimulated by EcoPAD-SPRUCE forecasting among modelers and experimenters on how to improve predictions of the relative contribution of different pathways of methane emissions.
Discussion
1 No strong bubbles are noted in the field, and a non-observation-constrained modeling study at a similar site from another project concluded minor ebullition contribution, which is at odds with the TECO result.
2 CH4:CO2ratio might explain the discrepancy. The other modeling study assumed that decomposed C is mainly turned into
CO2and a smaller fraction is turned into CH4. The large CH4:CO2ratio at this site may result in higher CH4flux. It seems that
the most “flexible” term is ebullition because any “excess” (above saturation) CH4is immediately released to ebullition, while
the plant transport term is constrained by vegetation data.
3 Experimental research on the relative contribution to methane emissions from three different pathways is rare.
4 Current available observations include the net surface flux of methane from the large collars, incubation data that should represent methane sources within the profile, and gas–DOC profile data that can indicate active zones within the peat profile. What additional data are needed to constrain the relative contribution of different pathways?
5 It is commonly believed that peatlands do not bubble much, but supersensitive GPS measurements found movement of the surface of the glacial Lake Agassiz peatland (GLAP) consistent with degassing events, and subsurface radar images showed layers that were interpreted as bubble layers.
6 Pore water gas data, perhaps N2or Ar, may shed some light on the relative importance of ebullition.
7 It is difficult to accurately distinguish the three pathways and relies on multiple approaches. Particularly for the SPRUCE site, the vegetation cover varies, and vegetation species vary. Does the number of channels each species has affect the transport? Meanwhile, the presence of plants (including nonvascular plants) will lead to more gas transport, but as bubbles rather than plant-mediated transport.
8 Simulating diffusion, vascular processes, and ebullition depends on model structure and algorithms. Most models assume a threshold to allow ebullition. Diffusion is treated in similar ways as ebullition in some models (most one-layer or two-layer models). For multiple-layers models, diffusion occurs from bottom to top millimeter by millimeter, layer by layer; therefore, gas diffusion from the top layer to the atmosphere is considered the diffusion flux. If that is the case, the time step, wind speed, and pressure matter (most models do not consider wind and pressure impacts). Plant transport is really dependent on the parameters for plant species, aerenchyma, etc. The gas transportability of plants is associated with biomass, NPP, root biomass, and the seasonality of plant growth in models. All these differences might cause biases in the final flux.
9 With only the CH4emission data, we cannot constrain the relative contribution of the three pathways. Concentration data in
different soil layers may help constrain them.
10 The diffusion coefficient calculation in TECO adopts the three-porosity model, which is ideal for mineral soil, but may not fit for organic soil. The Millington–Quirk model is a better choice for peat soil.
11 The boundary condition should be taken into account, but it brings in more uncertainties, including wind speed and piston velocity.
12 CH4emissions captured in static chambers do not include episodic ebullition events. So (1) the static chambers underestimate
the total methane emissions and (2) it might be necessary to exclude the ebullition pathway when using observational data to constrain CH4emissions. This point seems not to have been taken into account in other models.
of disentangling the contribution from different sources. For example, model intercomparison projects (MIPs), such as TRENDY, focus on uncertainty caused by different model structures with prescribed external forcing (Sitch et al., 2008). Keenan et al. (2012) used data assimilation to con-strain parameter uncertainties in projecting Harvard Forest carbon dynamics. Ahlstrom et al. (2012) forced one partic-ular vegetation model by 18 sets of forcings from climate models of the Coupled Model Intercomparison Project Phase 5 (CMIP5), while the parameter or model structure uncer-tainty is not taken into account.
EcoPAD (v1.0) is designed to provide a thorough pic-ture of uncertainties from multiple sources, especially in car-bon cycling studies. By focusing on multiple instead of one source of uncertainty, ecologists can allocate resources to ar-eas that cause relatively high uncertainty. The attribution of uncertainties in EcoPAD (v1.0) will rely on an ensemble of ecosystem models, the data assimilation system, and climate forcing with quantified uncertainty. Jiang et al. (2018) fo-cused specifically on the relative contribution of parameter uncertainty vs. climate forcing uncertainty in forecasting car-bon dynamics at the SPRUCE site. By assimilating
pretreat-ment measurepretreat-ments (2011–2014) from the SPRUCE exper-iment, Jiang et al. (2018) estimated uncertainties in key pa-rameters that regulate peatland carbon dynamics. Combined with the stochastically generated climate forcing (e.g., pre-cipitation and temperature), Jiang et al. (2018) found that external forcing resulted in higher uncertainty than param-eters in forecasting carbon fluxes, but caused lower uncer-tainty than parameters in forecasting carbon pools. There-fore, more efforts are required to improve forcing measure-ments for studies that focus on carbon fluxes (e.g., GPP), while reductions in parameter uncertainties are more impor-tant for studies in carbon pool dynamics. Despite the fact that Jiang et al. (2018) do not quantify model structure un-certainty, incorporating multiple models into EcoPAD (v1.0) is in progress, and future uncertainty assessment will benefit from EcoPAD (v1.0) with its systematically archived model simulation, data assimilation, and forecasting.
3.4.4 Case 4: improving biophysical estimation for better ecological prediction
Carbon cycling studies can also benefit from EcoPAD (v1.0) through improvements in biophysical estimation. The soil environmental condition is an important regulator of below-ground biological activities and also feeds back to above-ground vegetation growth. Biophysical variables, such as soil temperature, soil moisture, ice content, and snow depth, are key predictors of ecosystem dynamics. After constraining the biophysical module by detailed monitoring data from the SPRUCE experiment through the data assimilation compo-nent of EcoPAD (v1.0), Huang et al. (2017) forecasted soil thermal dynamics under future conditions and studied the re-sponses of soil temperature to hypothetical air warming. This study emphasized the importance of accurate climate forcing in providing robust thermal forecasts. In addition, Huang et al. (2017) revealed nonuniform responses of soil temperature to air warming. Soil temperature responded more strongly to air warming during summer compared to winter. Soil tem-perature increased more in shallow soil layers compared to deep soils in summer in response to air warming. Therefore, extrapolating manipulative experiments based on air warm-ing alone may not reflect the real temperature sensitivity of SOM if soil temperature is not monitored. As a robust quan-tification of environmental conditions is known to be a first step towards a better understanding of ecological process, improvement in soil thermal predictions through the Eco-PAD (v1.0) data assimilation system is helpful in telling apart biogeochemical responses from environmental uncertainties and also in providing field ecologists with key environmental conditions beforehand.
3.4.5 Case 5: how do the updated model and data contribute to reliable forecasting?
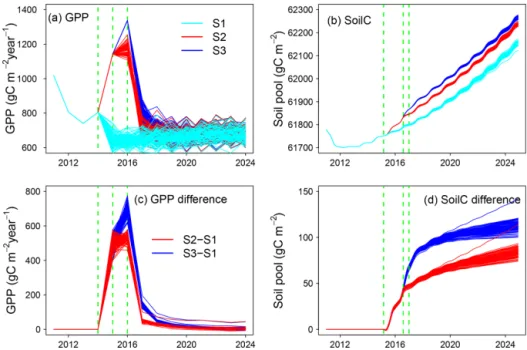
Through constantly adjusted model and external forcing ac-cording to observations and weekly archived model parame-ter, model structure, external forcing, and forecasting results, the contribution of model and data updates can be tracked by comparing forecasted vs. realized simulations. For example, Fig. 6 illustrates how updated external forcing (compared to stochastically generated forcing) and shifts in ecosys-tem state variables shape ecological predictions. “Updated” means the real meteorological forcing monitored from the weather station. We use stochastically generated forcing to represent future meteorological conditions. Future precipita-tion and air temperature were generated by vector autoregres-sion using a historical dataset (1961–2014) monitored by the weather station. Photosynthetically active radiation (PAR), relative humidity, and wind speed were randomly sampled from the joint frequency distribution at a given hour each month. Detailed information on weather forcing is available in Jiang et al. (2018). Similarly as in other EcoPAD-SPRUCE case studies, TECO is trained through data assimilation with observations from 2011–2014 and used to forecast GPP and total soil organic carbon content at the beginning of 2015. For demonstrating purposes, Fig. 6 only shows three series of forecasting results instead of updates from every week. Series 1 (S1) records forecasted GPP and soil carbon with stochastically generated weather forcing from January 2015– December 2024 (Fig. 6a, b, cyan). Series 2 (S2) records sim-ulated GPP and soil carbon with observed (updated) climate forcing from January 2015 to July 2016 and forecasted GPP and soil carbon with stochastically generated forcing from August 2016–December 2024 (Fig. 6a, b, red). Similarly, the stochastically generated forcing in Series 3 (S3) starts from January 2017 (Fig. 6a, b, blue). For each series, predictions were conducted with randomly sampled parameters from the posterior distributions and stochastically generated forcing. We displayed 100 mean values (across an ensemble of casts with different parameters) corresponding to 100 fore-casts with stochastically generated forcing.
GPP is highly sensitive to climate forcing. The differ-ences between the updated (S2, 3) and initial forecasts (S1) reach almost 800 gC m−2yr−1(Fig. 6c). The discrepancy is strongly dampened in the following 1–2 years. The impact of updated forecasts is close to 0 after approximately 5 years. However, the soil carbon pool shows a different pattern. The soil carbon pool is increased by less than 150 gC m−2, which is relatively small compared to the carbon pool size of ca. 62 000 gC m−2. The impact of updated forecasts grows with time and is highest at the end of the simulation year 2024. GPP is sensitive to the immediate change in climate forcing, while the updated ecosystem status (or initial value) has a minimum impact on the long-term forecast of GPP. The im-pact of updated climate forcing is relatively small for soil car-bon forecasts during our study period. Soil carcar-bon is less
sen-Figure 6. Updated vs. un-updated forecasting of gross primary production (GPP; panels a, c) and soil organic C content (SoilC; panels b, d). The upper panels show three series of forecasting with updated vs. stochastically generated weather forcing. “Updated” means the real meteorology forcing monitored from field weather stations. Cyan indicates forecasting with 100 stochastically generated weather forcings from January 2015 to December 2024 (S1); red corresponds to updated forecasting with two stages, which is updating with measured weather forcing from January 2015 to July 2016, followed by forecasting with 100 stochastically generated weather forcings from August 2016 to December 2024 (S2); and blue shows updated forecasting with measured weather forcing from January 2015 to December 2016, followed by forecasting with 100 stochastically generated weather forcings from January 2017 to December 2024 (S3). Panels (c) and (d) display mismatches between updated forecasting (S2, 3) and the original un-updated forecasting (S1). Red displays the difference between S2 and S1 (S2–S1), and blue shows the discrepancy between S3 and S1 (S3–S1). Dashed green lines indicate the start of forecasting with stochastically generated weather forcing. Note that panels (a) and (c) are plotted on a yearly timescale and panels (b) and (d) show results on a monthly timescale.
sitive to the immediate change in climate compared to GPP. However, the alteration of system status affects the soil car-bon forecast, especially on a longer timescale.
Since we are archiving updated forecasts every week, we can track the relative contribution of ecosystem status, forc-ing uncertainty, and parameter distributions to the overall forecasting patterns of different ecological variables and how these patterns evolve in time. In addition, as more observa-tions of ecological variables (e.g., carbon fluxes and pool sizes) become available, it is feasible to diagnose key factors that promote robust ecological forecasting by comparing the archived forecasts vs. observations and analyzing archives of model parameters, initial values, and climate forcing.
4 Discussion
4.1 The necessity of interactive infrastructure to realize ecological forecasting
Interactions enable the exchange and extension of infortion to benefit from collective knowledge. For example, ma-nipulative studies will have a much broader impact if the im-plications of their results can be extended from the regression
between environmental variables and ecosystem response, such as being integrated into an ecosystem model through model–data communication. Such an approach will allow us to gain information about the processes responsible for ecosystem response, constraining models, and making more reliable predictions. Going beyond the common practice of model–data assimilation, in which model updating lags far behind observations, EcoPAD (v1.0) enables iterative model updating and forecasting by dynamically integrating mod-els with new observations in near-real time. This near-real-time interactive capacity relies on its scientific workflow that automates data management, model simulation, data simula-tion, and result visualization. The system design encourages thorough interactions between experimenters and modelers. Forecasting results from SPRUCE were shared among re-search groups with different backgrounds through the web interface. Expertise from different research groups was in-tegrated to improve a second round of forecasting. Again, thanks to the workflow, new information or adjustments are incorporated into forecasting efficiently, making the forecast-ing system fully interactive.
We also benefit from the interactive EcoPAD (v1.0) plat-form to broaden user–model interactions and to broadcast
forecasting results. Learning about ecosystem models and data–model fusion techniques may undermine one’s produc-tivity and even discourage researchers from learning model-ing techniques because of their complexity and long learn-ing curve. Because EcoPAD (v1.0) can be accessed from a web browser and does not require any coding from the user’s side, the time lag between learning the model struc-ture and obtaining model-based results for one’s study is minimal, which opens the door for non-modeler groups to “talk” with models. The online storage of one’s results low-ers the risk of data loss. The results of each model run can be easily tracked and shared with a unique ID and web ad-dress. In addition, the web-based workflow also saves time for experts with automated model running, data assimila-tion, forecasting, structured result access, and instantaneous graphic outputs, bringing the possibility for a thorough ex-ploration of more essential parts of the system. The simplic-ity in use of EcoPAD (v1.0) at the same time may limit ac-cess to the code and lower flexibility. Flexibility for users with higher demands, for example those who want to test al-ternative data assimilation methods, use a different carbon cycle model, change the number of calibrated parameters, or include observations for other variables, is provided through the GitHub repository (https://github.com/ou-ecolab, last ac-cess: January 2019). This GitHub repository contains code and instructions for installing, configuring, and controlling the whole system; users can adapt the workflow to wrap their own model based on their needs. On the one hand, the open-source web-based system broadens the user community. On the other hand, it increases the risk of misuse and misinter-pretation. We encourage users to be critical and consult tem developers to avoid inappropriate application of the sys-tem.
4.2 Implications for better ecological forecasting Specific to the reliable forecasting of carbon dynamics, our initial exploration from EcoPAD-SPRUCE indicates that re-alistic model structure, correct parameterization, and accu-rate external environmental conditions are essential. The model structure captures important mechanisms that regu-late ecosystem carbon dynamics. Adjustment in the model structure is critical to our improvement of methane forecast-ing. Model parameters may vary between observation sites and change with time or environmental conditions (Medlyn et al., 1999; Luo et al., 2001). A static or wrong parameteri-zation misses important mechanisms (e.g., acclimation and adaptation) that regulate future carbon dynamics. Parame-ters that are not well constrained, for example caused by a lack of information from observational data, contribute to high forecasting uncertainty and low reliability in forecasting results. Correct parameterization is especially important for long-term carbon pool predictions as parameter uncertainty resulted in high forecasting uncertainty in our case study (Jiang et al., 2018). Parameter values derived under ambient
conditions were not applicable to the warming treatment in our methane case due to acclimation. The external environ-mental condition is another important factor in carbon pre-dictions. The external environmental condition includes both the external climatic forcing that is used to drive ecosystem models and also the environmental condition that is simu-lated by ecosystem models. As we showed that air warming may not proportionally transfer to soil warming, realistic soil environmental information needs to be appropriately repre-sented to predict soil carbon dynamics (Huang et al., 2017). The impact of external forcing is especially obvious in short-term carbon flux predictions. Forcing uncertainty resulted in higher forecasting uncertainty in carbon flux compared to that from parameter uncertainty (Jiang et al., 2018). Mis-matches in forecasted vs. realized forcing greatly increased simulated GPP and the discrepancy diminished in the long run. A reliable external environmental condition, to some ex-tent, reduces the complexity in diagnosing modeled carbon dynamics.
Pool-based vs. flux-based predictions are regulated differ-ently by external forcing and initial states, which indicates that differentiated efforts are required to improve short- vs. long-term predictions. External forcing, which has not been well emphasized in previous carbon studies, has a strong im-pact on short-term forecasting. The large response of GPP to forecasted vs. realized forcing, as well as the stronger forcing-caused uncertainty in GPP predictions, indicates that correct forcing information is a key step in short-term flux predictions. In this study, we stochastically generated the climate forcing based on local climatic conditions (1961– 2014), which is not sufficient to capture local short-term cli-mate variability. As a result, updated GPP went outside our ensemble forecasting. On the other hand, parameters and his-torical information about pool status are more important in term pool predictions. Therefore, improvement in long-term pool size predictions cannot be achieved with accurate climatic information alone. Instead, it requires accumulation in knowledge related to site history and processes that regu-late pool dynamics.
Furthermore, reliable forecasting requires an understand-ing of uncertainty sources in addition to future mean states. Uncertainty and complexity are major factors that lead to the belief in “computationally irreducible” and low intrinsic predictability of ecological systems (Beckage et al., 2011; Coreau et al., 2010; Schindler and Hilborn, 2015). Recent advances in computational statistical methods offer a way to formally account for various uncertainty sources in ecology (Clark et al., 2001; Cressie et al., 2009). The Bayesian ap-proach embedded in EcoPAD (v1.0) brings the opportunity to understand and communicate forecasting uncertainty. Our case study revealed that forcing uncertainty is more impor-tant in flux-based predictions, while parameter uncertainty is more critical in pool-based predictions. Actually, how fore-casting uncertainty changes with time, what the dominate contributors of forecasting uncertainty are (e.g., parameter,
initial condition, model structure, observation errors, forcing, etc.), how uncertainty sources interact among different com-ponents, and to what extent unconstrained parameters affect forecasting uncertainty are all valuable questions that can be explored through EcoPAD (v1.0).
4.3 Applications of EcoPAD (v1.0) to manipulative experiments and observation sites
Broadly speaking, data–model integration stands to increase the overall precision and accuracy of model-based experi-mentation (Luo et al., 2011b; Niu et al., 2014). Systems for which data have been collected in the field and that are well represented by ecological models therefore have the capac-ity to receive the highest benefits from EcoPAD (v1.0) to improve forecasts. In a global change context, experimen-tal manipulations, including ecosystem responses to changes in precipitation regimes, carbon dioxide concentrations, tem-peratures, season lengths, and species compositional shifts, can now be assimilated into ecosystem models (Shi et al., 2016; Xu et al., 2006; Gao et al., 2011; Lebauer et al., 2013). The impacts of these global change factors on carbon cycling and ecosystem functioning can now be measured in a sci-entifically transparent and verifiable manner. This leads to ecosystem modeling of systems and processes that can ob-tain levels of confidence that lend credibility (from the pub-lic point of view) to the forward progress of science toward forecasting and predicting (Clark et al., 2001). These are the strengths of a widely available interface devoted to data– model integration towards better forecasting.
The data–model integration framework of EcoPAD (v1.0) creates a smart interactive model–experiment (ModEx) sys-tem. ModEx has the capacity to form a feedback loop in which field experiments guide modeling and modeling in-fluences experimental focus (Luo et al., 2011a). We demon-strated how EcoPAD (v1.0) works hand-in-hand between modelers and experimenters in the life cycle of the SPRUCE project. The EcoPAD-SPRUCE system operates while exper-imenters are making measurements or planning for future re-search. Information is constantly fed back between modelers and experimenters, and simultaneous efforts from both par-ties illustrate how communication between models and data advance and shape our understanding towards better fore-casts during the life cycle of a scientific project. ModEx can be extended to other experimental systems to do the follow-ing: (1) predict what an ecosystem’s response might be to treatments once the experimenter has selected a site and de-cided the experimental plan; (2) assimilate the data exper-imenters are collecting during the experiment to constrain model predictions; (3) project what an ecosystem’s responses may likely be in the rest of the experiment; (4) tell experi-menters which important datasets they may want to collect in order to understand the system; (5) periodically update the projections; and (6) improve the models, the data assimila-tion system, and field experiments during the process.
In addition to manipulative experiments, the data assimi-lation system of EcoPAD (v1.0) can be used for automated model calibration for FLUXNET sites or other observa-tion networks, such as NEON and LTER (Johnson et al., 2010; Robertson et al., 2012). The application of EcoPAD (v1.0) at FLUXNET, NEON, or LTER sites includes three steps in general. First, build the climate forcing in the suit-able formats of EcoPAD (v1.0) from the database of each site. Second, collect the prior information (include obser-vations of state variables) in the data assimilation system from FLUXNET, NEON, or LTER sites. Third, incorporate the forcing and prior information into EcoPAD (v1.0) and then run EcoPAD (v1.0) with the dynamic data assimilation system. Furthermore, the proposed continental-scale ecology study (Schimel, 2011), EcoPAD (v1.0) once properly applied could also help evaluate and optimize the field deployment of environmental sensors and supporting cyber-infrastructure, which will be necessary for larger, more complex environ-mental observing systems being planned in the US and across different continents.
4.4 Future developments
EcoPAD (v1.0) will expand as time goes on. The system is designed to incorporate multiple process-based models, diverse data assimilation techniques, and various ecologi-cal state variables for different ecosystems. The case stud-ies presented in earlier sections are based primarily on one model. A multiple (or ensemble) model approach is helpful in tracking uncertainty sources from our process understand-ing. With rapidly evolving ecological knowledge, emerging models with different hypotheses, such as the microbial– enzyme model (Wieder et al., 2013), enhance our capacity in ecological prediction but can also benefit from rapid tests against data if incorporated into EcoPAD (v1.0). In addition to MCMC (Braswell et al., 2005; Xu et al., 2006), a vari-ety of data assimilation techniques have been recently ap-plied to improve models for ecological forecasting, such as the EnKF (Gao et al., 2011), genetic algorithms (Zhou and Luo, 2008), and 4-D variational assimilation (Peylin et al., 2016). Future development will incorporate different opti-mization techniques to offer users the option to search for the best model parameters by selecting and comparing the best method for their specific studies. We focus mostly on carbon-related state variables in the SPRUCE example, and the data assimilation system in EcoPAD (v1.0) needs to include more observed variables for constraining model parameters. For example, the NEON sites not only provide measured ecosys-tem CO2 fluxes and soil carbon stocks, but also resource
(e.g., GPP–transpiration for water and GPP–intercepted PAR for light) use efficiency (Johnson et al., 2010).
Researchers interested in creating their own multiple model and/or multiple assimilation scheme version of Eco-PAD (v1.0) can start from the GitHub repository (https: //github.com/ou-ecolab, last access: January 2019) where the