Digitized
by
the
Internet
Archive
in
2011
with
funding
from
Boston
Library
Consortium
Member
Libraries
31
415
dewe
Massachusetts
Institute
of
Technology
Department
of
Economics
Working Paper
Series
Current
Accounts
in
the
Long
and
Short
Run
Aart
Kraay
Jaume
Ventura
Working
Paper
02-21
June
2002
Room
E52-251
50
Memorial
Drive
Cambridge,
MA
02142
This
paper
can
be
downloaded
without
charge
from
the
Social
Science
Research Network
Paper
Collection
atMASSACHUSETTSINSTITUTE OFTECHNOLOGY
JUN
1
3
2002
'
Massachusetts
Institute
of
Technology
Department
of
Economics
Working
Paper
Series
Current
Accounts
in
the
Long
and
Short
Run
Aart
Kraay
Jaume
Ventura
Working
Paper
02-21
June
2002
Room
E52-251
50
Memorial
Drive
Cambridge,
MA
02142
This
paper
can be
downloaded
without
charge from
the
Social
Science
Research Network
Paper
Collection
atRevised
Draft
Current
Accounts
in
the
Long and
Short
Run
Aart
Kraay*
The
World
Bank
Jaume
Ventura
MIT,
CEPR
and
NBER
June 2002
Abstract:
Faced
withincome
fluctuations, countriessmooth
theirconsumption by
raising savings
when
income
is high,and
viceversa.How
much
ofthese savingsdo
countries invest at
home
and abroad?
In otherwords,what
arethe effects offluctuations in savings
on domestic
investmentand
the currentaccount?
Inthe longrun,
we
find thatcountries investthe marginal unit ofsavings indomestic
and
foreignassets inthe
same
proportionsas
intheirinitial portfolio,so
thatthelatteris remarkablystable. Inthe short run,
we
find thatcountries investthe marginal unitofsavings mostlyinforeign assets,
and
only graduallydo
they rebalancetheir portfolioback
to itsoriginalcomposition. This
means
that countries not onlytry tosmooth
consumption, butalsodomestic
investment.To
achievethis, theyuse
foreignassetsas
a buffer stock.*Thispaperhasbeenpreparedforthe2002
NBER
MacroeconomicsAnnual.We
aregrateful toourdiscussantsFabrizioPerriandEricvanWincoopaswell astothe participantsfor theirusefulcomments.
Theopinionsexpressed hereare the authors',and do notnecessarilyreflectthoseoftheWorldBank,its
Countries are subject to transitory
income
shocks such
aschanges
intheterms
oftrade, fluctuations in production, policyreforms, natural disasters,
and
many
others.There
isample
evidence
thatcountriesuse
theirassets to bufferorsmooth
the effects oftheseshocks
on consumption,
raising savingswhen
income
is highand
viceversa.1The
main
goal ofthispaper
is toimprove
our understanding ofthecombination ofassetsthatcountries
use
forthis purpose. In particular,we
ask:how
do
countriesallocatethe marginal unitof savings
between
domestic
and
foreign assets? Or,equivalently,
what
are the effects of fluctuations in savingson domestic
investmentand
thecurrent
account?
2The
traditionalview
is thatcountries invest the marginal unitofsavings inforeign assets. Underlying this
view
are theassumptions
that investment risk isweak
and
diminishing returns are strong.The
firstassumption ensures
thatcountries investtheirsavings only in
those
assetsthat offerthe highestexpected
return.The second
assumption
implies that investingany
fraction ofthe marginal unit ofsavings indomestic
capitalwould
loweritsexpected
returnbelow
that offoreign assets.Hence
the marginal unit ofsavings is invested in foreign assets,justifying thetraditional rule thatfluctuations in savings leadtofluctuations in the currentaccount
of roughlythesame
magnitude.While
theoreticallycoherent, this rulehas
been
consistently rejectedby
the data.The
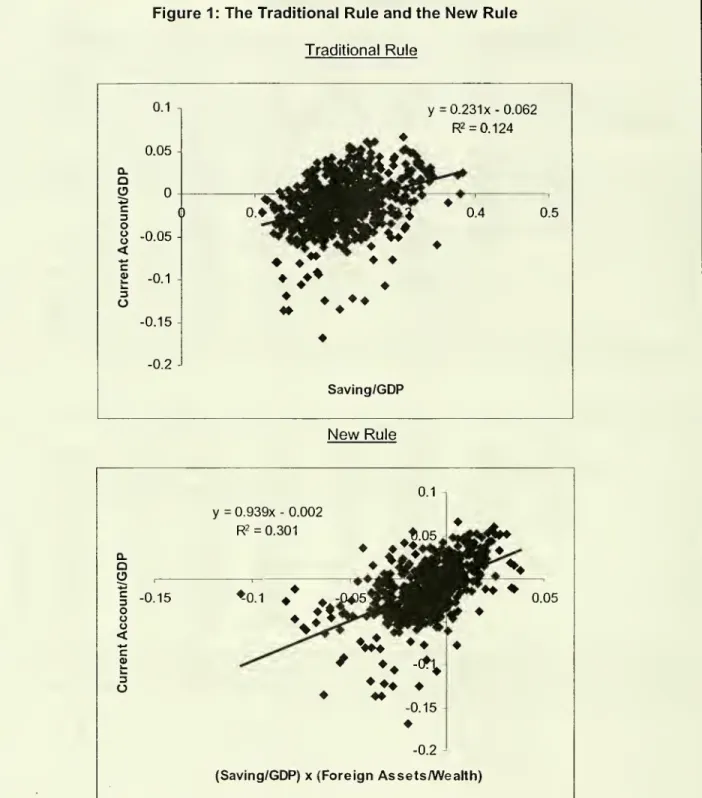
top panel of Figure 1shows
pooledannual
observations ofthe currentaccount
and
savingsfor21OECD
countriesover
thepast30
years.A
regression ofthecurrent
account
on
savings delivers a slope coefficientthat is positive butmuch
lowerthan one. This is nothing butthe
famous
resultofFeldsteinand
Horioka [1980] that fluctuations in savings leadto parallelfluctuations in investment,with onlyminor
effectson
the currentaccount.1
Forevidenceonconsumption-smoothing,see Deaton[1991]whowrites that"consumptionislessvolatile
than income,itfluctuates lessaboutitstrend,theamplitudeofitsbusinesscycle variationisless,andthe
varianceofitsgrowthrate islessthanthevarianceofthegrowthrateofincome"p.133-34.
2
Why
docountriesuseassetstosmooth consumption ratherthan simplybuyinsuranceabroad?Implicitinthisparagraph andbasicallyinallthat followsistheassumptionthatcountriesareunableor unwillingto
selltheiridiosyncraticrisk.Thisassumptionisa centraltenetofthe intertemporalapproachtothe current
In
an
earlierpaper,we
proposed
anew
view
thatcountries invest the marginalunit ofsavings as the
average
one
(Kraayand Ventura
[2000]). Thisiswhat
one
shouldexpect if, in contrasttothetraditionalview, investment riskis strong
and
diminishingreturns are
weak.
The
firstassumption
impliesthat countries are unwilling tochange
the composition oftheir portfolios, unless
shocks
have
large effectson
thedistribution of asset returns.The
second assumption ensures
thatthedistribution ofasset returnsis unaffected by the
way
countries investthe marginal unit ofsavings.Hence,
the marginal unitofsavings isinvested as theaverage
one, leading tothenew
rulethat fluctuations insavings lead tofluctuations inthe currentaccount
thatare equal tosavingstimesthe
share
offoreign assets in thecountryportfolio. Thisrule notonly istheoreticallycoherent, butit also providesasurprisingly
good
description ofthe data.The
bottom
panel of Figure 1shows
that a simple regression ofthe currentaccount
on
the interaction
between
savingsand
the shareofforeign assetsdelivers a slopecoefficientcloseto
one
and
a zero intercept. Moreover, this interactionterm by
itselfexplains
around
thirtypercent oftheobserved
variation in the currentaccount.3Hidden
in thebottom
panel ofFigure 1 there isa vast differencebetween
thepredictive
power
ofthenew
rule inthe longand
the shortrun. Figure2 illustrates thispoint. In thetop panel,
we
have
plottedtheaverage
currentaccount
over a thirty-yearperiod against the
average
ofsavings time theshare
of foreign assets during thesame
period.
The
new
ruleexplains about85
percentofthe long run oraverage
cross-country differences in current accounts. Inthe
bottom
panel,we
have
plotted the(demeaned)
currentaccount
foreach
countryand year
againstthe(demeaned)
interaction ofsavings
and
the initial share offoreign assetsin wealthforthesame
country
and
year.The
new
ruleexplains basicallynone
ofthe year-to-yearwithin-reality.Thequestionofwhythisissoisoneofthemostintriguingpuzzlesininternationalfinance.See
Lewis[1999]forasurveyoftheliteratureonthis topic.
3
Sinceforeignassetsconstituteasmallfractionofobservedcountryportfolios, thisviewimplies that
fluctuationsinsavingsshould mostlyleadtoparallelfluctuationsininvestment,andistherefore consistent withthe Feldstein-Horiokafinding.What wefound mostsurprisingaboutthis viewinourearlierpaperis
thatithassharplydifferentimplicationsforthe currentaccountresponsetoanincreaseinsavingsin
debtorandcreditorcountries.Since debtors bydefinitionhold morethantheirwealth indomesticcapital,
theyinvestat
home
morethantheincreaseinsavings,resultingina currentaccountdeficit. Incontrast, creditorcountries investathome
lessthanthe increaseinsavings,resulting inacurrentaccountsurplus.country differences in current accounts.
The
contrastbetween
thetwo
panels indicatesadiscrepancy
between
the longand
the short run behavior ofthecurrent account.4Isthe short-run relationship
between
savingsand
the currentaccount
just noiseorare there clearpatterns behind this cloud of points?
How
do
we
reconcile the apparentlyhaphazard
behaviorofthe currentaccount
in the shortrun with its neatbehaviorinthe long run?
The
main
contribution ofthis paper,we
think, is to provideclear
answers
to thesequestions.To
do
this, it is useful to startby
pointing outthatthenew
ruleembodies
theview
thatthe currentaccount
primarily reflects portfoliogrowth,i.e.
changes
inthe size ofthecountry portfoliowithout systematicchanges
in itscomposition.
The
empiricalsuccess
ofthenew
rulein thetop panelof Figure2
simplyreflectsthe observationthat thecomposition ofcountryportfolios
has
been
remarkably
stable in the long run. This is
shown
in Figure 3. Ifwe
want
tounderstand
why
thenew
rule
performs so
poorly inthebottom
panelofFigure 2,we
must
explainhow
and
why
in the short run increasesin savings lead mostlyto portfoliorebalancing, i.e. systematic
changes
inthe composition ofthecountry portfolio. Ifin additionwe
want
to reconcile thetwo
panels ofFigure2,we
must go
furtherand
also explainwhy
this short-runportfolio rebalancing is
undone
inthe long run.Our
hypothesis isthatthe pattern of portfolio rebalancing is consistentwiththeview
thatadjustment
coststo investment are important. Ifthis is the case,an
increasein savingsthat raisesinvestment
reduces
theexpected
return to capitaland
inducescountries to rebalancetheir portfolios
towards
foreign assets.Under
these
conditions,theshort-run current
account
surplus is largerthan theone
predictedby
thenew
rule.Once
savings returns tonormal, investmentdeclines,adjustment
costsdisappear
and
thecountry portfolio returnsgraduallytoits original composition.
Throughout
thisadjustment
process, the currentaccount
surplus is smaller than theone
predicted by4
We
alsonotedthisdiscrepancyinourearlierpaper, althoughitwasmuchlesspronouncedinthesmallersampleof13countriesand 23years(1973-1995)that
we
usedthere.Here,we
have been abletoextend oursampleto21 countriesand upto32years per country (1966-1997).Allthe resultsobtained inthethe
new
rule. In the long run, theshock does
not affectthecomposition ofthecountryportfolio
and
thenew
rule applies.With
thistheoretical pictureat hand,we
go
back
tothedatato searchforpatternsin thediscrepancies
between
theobserved
currentaccount
and what
thenew
rule
would
predict.When
we
do
this, the picturethatcomes
outfrom
thedata turns outto
be
clearand unambiguous: on
impact, countries rebalancetheir portfoliostowards
foreign assets
and
thenew
rulesystematically under-predicts the short-run effects ofincreases insavings
on
the currentaccount. Intheyearsthat follow, countriesrebalancetheirportfolios
back towards
their original composition. During this period,the
new
rulesystematically over-predictsthe currentaccount.We
findthat thewhole
adjustment
process
lastsabout
fiveyears. Overall, theevidence isconsistent with theview
thatadjustment coststo investment are important and, to avoid payingthem,
countries
use
foreign assets as a bufferstock tosmooth
fluctuations in investment.The
theory presented herecan
also reconciletwo
apparentlycontradictoryobservations
about
the relationshipbetween
the currentaccount
and
investment.On
theone
hand, the long run or cross-sectional correlationbetween
investmentand
thecurrent
account
isweak
(Penatiand Dooley
[1984],Tesar
[1991]).On
the otherhand,theshort run or time-series correlation
between
investmentand
the currentaccount
isconsistently negative (Glick
and Rogoff
[1995]).The
theory presented here predictsthat inthelong run, portfolio rebalancing issmall
and
the correlationbetween
thecurrent
account
and
investment shouldbe
positive in creditorcountriesand
negative indebtor ones.
We
show
thatthedata is consistent withthis predictionand
thattheweak
cross-sectional correlation isthe resultof pooling datafrom debtorand
creditorcountries.
The
theoryalso predicts thatin theshort run portfolio rebalancing isimportant
and
this introduces asource
ofnegative correlationbetween
thecurrentaccount
and
investment. This istrue in allcountries, regardlessofwhether
they are debtors orcreditors.We
present a simpledecomposition
ofthe cross-sectionaland
time-series correlations
between
the currentaccount
and
investmentthat illustrates thisThe
paper
isorganizedas
follows: Section I presents a stylizedmodel
thatencapsulatesthe
main elements
ofour portfolio-basedtheoryofthe currentaccount. Section IIuses
themodel
to studyhow
countries reacttoincome
shocks. Section IIIexamines
the empiricalevidence
and
interprets itfrom
thevantage
point ofthe theory.Section IVinvestigatesthe relationship
between
investmentand
the currentaccount. SectionV
concludes.I.
An
Intertemporal
Model
of
the
Current
Account
In this section,
we
presenta stylizedmodel
ofhow
the currentaccount
responds
totransitoryincome
shocks. Sincewe
stop short ofmodeling
the worldequilibrium
and
focus insteadon
a smallopen economy,
theseshocks
shouldbe
interpreted as country-specific or idiosyncraticrisk. Following thetradition ofthe
intertemporal approach,
we
simplyassume
that countries are unableor unwilling tosellthis riskin international markets. In particular,
we
adopt
the starkestform
ofthisview
by
assuming
that the onlyassetthat is traded internationallyis a non-contingent bond. 5The
model
captureswhat
we
think are the essentialelements
of aportfolio-based
theoryofthe current account. This theory is builtaround
theconcept
ofcountryportfolio
and
a simpledecomposition
ofthe currentaccount
that relieson
thisconcept.By
the country portfolio,we
referto thesum
ofall productive assets located within the country plus its netforeign asset position.The
latterconsist of thesum
ofall claimson
domestic
assets heldby
foreignersminus
thesum
of all claimson
foreign assets heldby domestic
residents. In our simple model, the only productive asset located within the country isthestock of capital,and
the net foreign asset position is simplythestockof5
TheintertemporalapproachwasdevelopedbySachs [1981, 1982],Obstfeld [1982],Dornbusch [1983],
Svensson andRazin [1983],Persson and Svensson[1985],andMatsuyama[1987],amongothers.
non-contingent
bonds
owned
by
the country.By
thecomposition ofthe countryportfolio,
we
refer totheshare
ofthe net foreign asset position in it.To
interprettheevolution ofthe current
account
it is usefulto breakitdown
intotwo
components
orpieces:
changes
in the sizeofthecountry portfolio,which
we
callportfolio growth;and
changes
inthecomposition ofthecountry portfolio, orportfoliorebalancing.6We
studya small country populated by acontinuum
ofidenticalconsumers.
There
is a singlegood
thatcan be
used
forconsumption
and
investment.Consumers
have access
totwo
investmentopportunities:foreign loansand
domestic
capital.The
instantaneous interest rate
on
foreign loansis p.To
produce
one
unitofcapitalone
unit ofthe singlegood
is required. Sincecapital is reversibleand
does
not depreciate, itsprice isequalto
one
and
its return isequal tothe flow ofproductionminus
operatingcosts.
The
flowof productiongenerated
byone
unit of capital is7idt+0-dco;
where
n and
a
are non-negative constants;and
co is aWiener
processes, i.e. itschanges
arenormally distributedwith E[dco]=0
and
E[dco2]=dt.That
is, theflow ofproduction isnormally distributedwith instantaneous
mean
n and
instantaneous variance o.The
operating costs, a, are
assumed
tobe
proportional totheaggregate
investment rate:1 rik
(1)
«=*-—
(teo)k dt
where
k istheaggregate
stock ofcapital at the beginningofthe period. Sincecapitaldoes
notdepreciate, this is also thestockofcapitalthatwas
used
in production in the previousperiod.Note
thatwe
aretreating the relationshipbetween
operating costsand
investment asa congestion effectornegative externality.
One
set ofassumptions
thatjustifiesthis relationship
would be
thatinvestment requiresa public input thatcosts A.perunit of investment
and
thegovernment
financesthis input by raising a taxa
on
capital.
There
mightbe
alternativeand more
compelling sets ofassumptions
that6
Implicitinthis decompositionistheassumptionthatassetpricerevaluations are small. Thismightbe a
deliverthis relationship.
The
reason
we
adopt
ithere is simplybecause
it provides atractable
and
effectiveway
tocapture the notion ofadjustment
coststo investment.7The
representativeconsumer
valuesconsumption
sequences
withthese preferences:(2)
EJlnce"
5'
dt (6>0)
Given
ourassumptions about
theflow ofproductionand
theoperating costs,the returnto capitalis
(Tt-a)dt
+
adco; and
the representativeconsumer's budget
constraint
can be
writtenas
follows:(3)
da = [((n-a)-(1-x)
+
px)a-c]-dt
+
(1-x)-a-a-dco
where
c, aand
xdenote consumption,
wealthand
theshare
offoreign loans in theportfolioofthe representative
consumer.
The
budget
constraintillustratesthe standardrisk-returntrade-offunderlying investmentdecisions.
Each
extra unit ofwealth investedin
domestic
capital ratherthan foreign loans increases theexpected
return towealthby
n-a, atthe cost ofraising the varianceofthis return by
a
2. Finally,we
assume
that it isnot possibleto short-sell thecapital stock, i.e. x<1
.
Solving the representative
consumer
problem,we
findthe optimalconsumption
and
portfoliodecisions:8(4) c
=
5•a7
Theq-theory postulates thatinvestmentraisesthe price ofinvestmentgoodsrelative toconsumption
goods, leavingthe productivityof capitalconstant.
We
instead postulate thatinvestment lowerstheproductivityof capital, leaving therelativepriceofinvestmentand consumption goodsconstant. Itis likely
thatinrealeconomies, bothsortsofadjustmentcoststoinvestment areimportant. SeeLucas[1967]foran
earlymodelthatconsiders both typesofadjustmentcosts;andCaballero [1997]andDixitandPyndick
[1994]fortwoexcellent expositions ofexistingmodelsofadjustment costsofinvestment.
(5) x
= 1-max<{
r~^'°
When
decidingtheirconsumption,consumers behave
as
inthepermanent-income
theory ofFriedman.
Equation (4)shows
thatconsumption
is a fixedfraction ofwealth
and
isindependent
oftheexpected
returnand
volatilityofavailable assets.When
deciding theirportfolio,consumers behave
as
inthemean-variance
theory ofMarkowitz
and
Tobin. Equation (5)shows
thattheshares
ofeach
asset in the portfoliodepend
onlyon
themean
and
variance ofthedifferent assetsand
noton
thelevel of wealth.The
kink in thedemand
forforeign assets isthe result ofthe short-sale constrainton domestic
capital, i.e. x<1.In equilibrium,the
demand
and
supply ofcapitalmust be
equaland
this impliesthat:
(6)
(1-x)a
=
k+
dk
The
lefthand
side of Equation (6) isthedemand
for capital. Sincewe
have
assumed
that onlydomestic
consumers
holddomestic
capital, thisdemand
isequal to theshare of theirwealth thattheseconsumers
want
to hold indomestic
capital, timeswealth.
The
righthand
side of Equation (6) isthe supplyof capital,and
consists ofthecapitalstock atthe beginning ofthe period plus the investment
made
during the period.This
completes
the description ofthe model.There
aretwo
state variables: kand
a;and
one
shock: dco.The
"new
rule"model
ofour previouspaper
obtains as thelimiting
case
inwhich
X—
>0. Inthis case,there areno
adjustment costs to investmentand
the only state variable isthe levelofwealth.Assume
that7i>p+A.(p-5). Thisparameter
restrictionensures
thattheeconomy
is productiveenough
so
thattheselling constraint
on
capital isnever
binding.Then,
it is straightforwardtouse
Equations (1)-(6) toobtainthe
dynamics
forthecapital stockand
wealth:9(7) (8)
dk
kda
a=x-
1 -2 k^ji-p-a
•—
ay
•dta
T
2 a+
p-8
dt+
—
-adco
aEquations
(7)-(8)provide the lawof motion ofthesystem from
any
given initialcondition
and sequence
of shocks.Our
next goal is touse
thisdynamical
system
tostudy
how
thecurrentaccount
responds
toincome
shocks.II.
Portfolio
Growth
and
Portfolio
Rebalancing
To
illustratethe model's implications,we
analyzethe behaviorofsavings,investment
and
the currentaccount
after atransitoryincome
shock.To
do
this, it isuseful firstto establish
some
notation. LetS
and
CA
be
savingsand
the current1
da
1 dfx-a)account
bothas
ashare
ofwealth, i.e.S=
and
CA
=
. Itfollowsthat,a
dt a dtalong
any
particularsample
paththatwe
consider, the currentaccount
can be
writtenas follows:
dx
(9)
CA
=
x-S
+
—
dt
Equation (9)
shows
that it is possibleto interpretthecurrentaccount
as
thesum
of
two
terms.The
firstone
measures
thechange
inthe stockofforeign assetsthatToderiveEquations(7)-(8),rememberthatinthelimitofcontinuous timedkdt=0.
would
keep
constantthecompositionofthe countryportfolioand
this iswhat
we
referto
as
portfoliogrowth.The
second term
measures
thechange
in thecompositionofthecountry portfolio
and
this iswhat
we
refer toas
portfoliorebalancing.To
develop
intuitionsabout
the interplaybetween
thesetwo
components
ofthecurrent account,
we
present next a series ofexamples.
In all ofthem,
we
assume
thefollowing
sample
pathforthe production shock:(10)
^
v
' dt
tel-co,^)
e-o
-1 tefTpT;,) (e>0)te[T
2,oo)That
is, the countryexperiences asequence
ofunexpected
productionshocks
equalto
edt
times thecapital stockfor a finite periodand
zero afterwards.We
refer tothe period [TLT2) asthe
shock
periodand
to (-^.T^and
[T2 ,°°)as
the pre-and
post-shock
periods, respectively.Figure
4
shows
the behavior oftheforeign asset position alongthissample
path.
Regardless
oftheinitial condition, duringthepre-shock period theshare
offoreign assets
converges towards
x*=
1+
1 \ 1 f i A
2-X
\{2-X
X
1 (n-
p)-
p+
5+
v7
K .The
a
simulation behind Figure 4
assumes
that thisvaluehas
been
reached by
t=0. Duringthe
shock
periodthe shareofforeign assets increases steadily, albeit at adecliningrate.
The
magnitude
ofthis increasedepends
on
X. High values ofX
implythat theeffects of increased investment
on
operating costs are largeand
provide a stronginducement
for investorsto rebalance theirportfoliostowards
foreign assets. Duringthe post-shock period, investment
and
operating costs decline.As
a result, theshare offoreign assets slowly returns to its pre-shock level.
We
nextstudy the implications ofthis behavior oftheshareofforeign assetsforthe current account.
Consider
firstthecase
inwhich
adjustment coststoinvestment are negligible,i.e.
A—
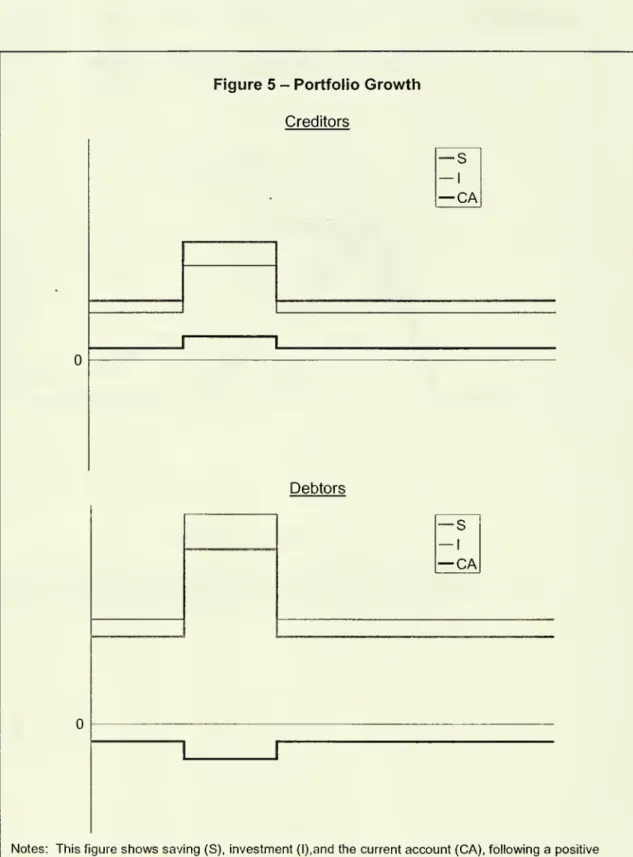
>0. Figure4
shows
that inthiscase
theshare
offoreign assets is constantdx
throughout.
As
a result, there isno
portfolio rebalancing, i.e.—
=
;and
the currentdt
account
is equalto portfoliogrowth; i.e.CA
=
x•S
.This isthe"new
rule"model
thatwe
analyzed
in our previous paper,and
its implicationsfora creditorand
adebtor country are depicted in Figure 5.The
top panelshows
a creditor country, i.e. x*>0, whilethebottom
panelshows
adebtorcountry, i.e. x*<1. Both countries raisetheirsavings during theshock
period as a result ofthe standard"consumption-smoothing"
motive.Both
countries also investthese
marginal savingsindomestic
capitaland
foreign loansinthe
same
proportionsas
theiraverage
portfolio. Since theforeignassetshare
issmall in absolutevalue,
we
findthat in both countriesthe increase in investmentis ofthe
same
orderofmagnitude as
the increase in saving. But itis not exactlythesame,
and
this leads to different currentaccount
responses
in debtorand
creditorcountries.Inthe creditorcountry investment increases
somewhat
less than savingsand
thecurrent
account
registers asurplus. In thedebtor country investment increasessomewhat
more
than savingsand
the currentaccount
registers a deficit.This is themain
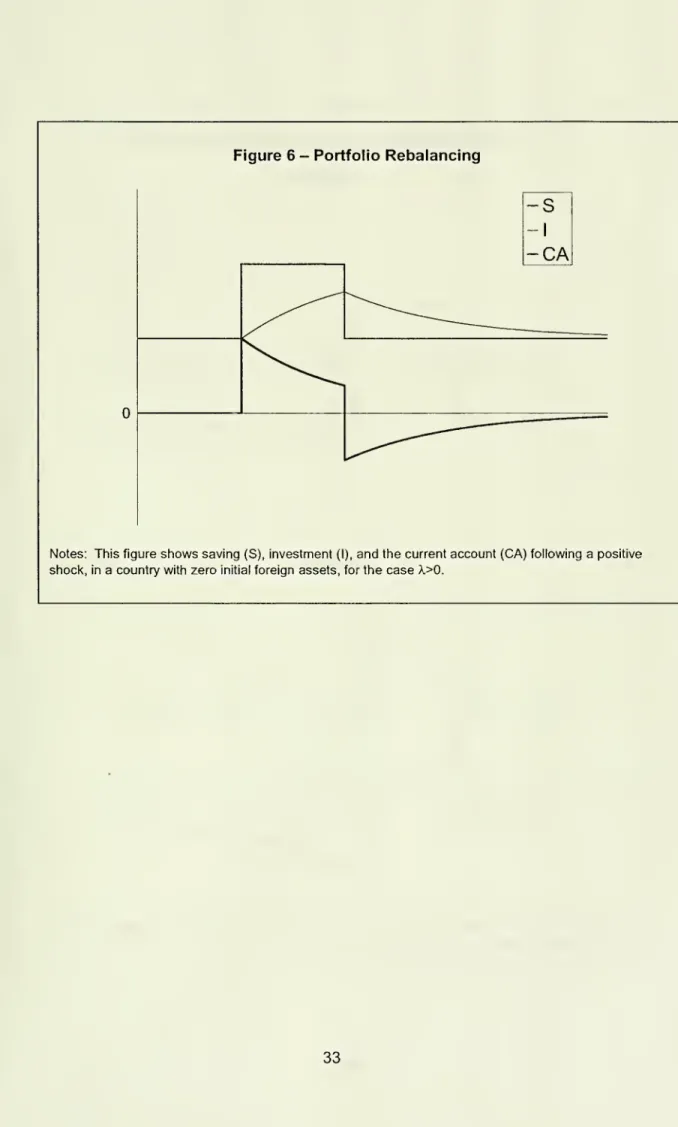
resultofour previous paper.Consider
nextthecase
inwhich adjustment
costs toinvestment areno
longernegligible, i.e. X>0. Figure 6
shows
thecase
ofa countrythat is neithera debtor nor acreditor.
By
choosing
thecase
x*=0,we
know
thatintheabsence
ofadjustment
costs,the current
account
would
be
zero before, duringand
aftertheshock. Figure 6shows
the behavior ofsavings, investment
and
the currentaccount
inthis case.The
countryraises its savings during the
shock
periodforthesame
"consumption-smoothing"
motive
as
before. Butadjustment
costsnow
discourage largeswings
in investment,and
this affectshow
these savings aredistributedbetween domestic
capitaland
foreign loans.
During the
shock
period,thecountryuses
most
of its increase in savingstopurchase
foreign loans, while investment increases only gradually.Consumers
rebalancetheirportfolios
towards
foreign assetsbecause
the increase in investmentraisesoperating costs
and
this lowerstheexpected
return todomestic
capital.The
portfolio-rebalancing
component
ofthecurrentaccount
is positiveand,as
a result, thenew
rule under-predicts the currentaccount
surplus in the shortrun. In the post-shockperiodinvestmentfalls slowly, but
remains
higherthannormal
forawhile. Sinceproductivity
has
returnedto its pre-shock level, savings return tonormal
and
thehigher-than-normalinvestment is
now
financedby
a sale of foreign loans.Consumers
rebalancetheir portfolios
back towards
theiroriginal compositionbecause
the declineininvestment lowers operating costs
and
this raisestheexpected
returntodomestic
capital.
The
portfolio-rebalancingcomponent
ofthe currentaccount
isthereforenegative and,
as
a result, thenew
ruleover-predictsthecurrentaccount
surplus inthemedium
run.As
time passes, the country portfolio returnsto itsoriginal compositionand
thenew
rule appliesagain inthe long run.This
example
clearlyshows
the roleofforeign loansas
a bufferstock tosmooth
thefluctuations in investment.
Without access
toforeign loans, countrieswould be
forced notonlyto invest all oftheirsavingsat
home
butalso todo
so
contemporaneously.
Access
toforeign loans permits countries atospread
theirdomestic
investment over time and, in thisway,
avoid paying highadjustment
costs.To
do
this, countriestemporarily placetheir savings inforeign loansand
slowly convertthem
intodomestic
investment.It is possibletodesign
more
complicatedexamples
inwhich
the currentaccount
exhibits richer
dynamics.
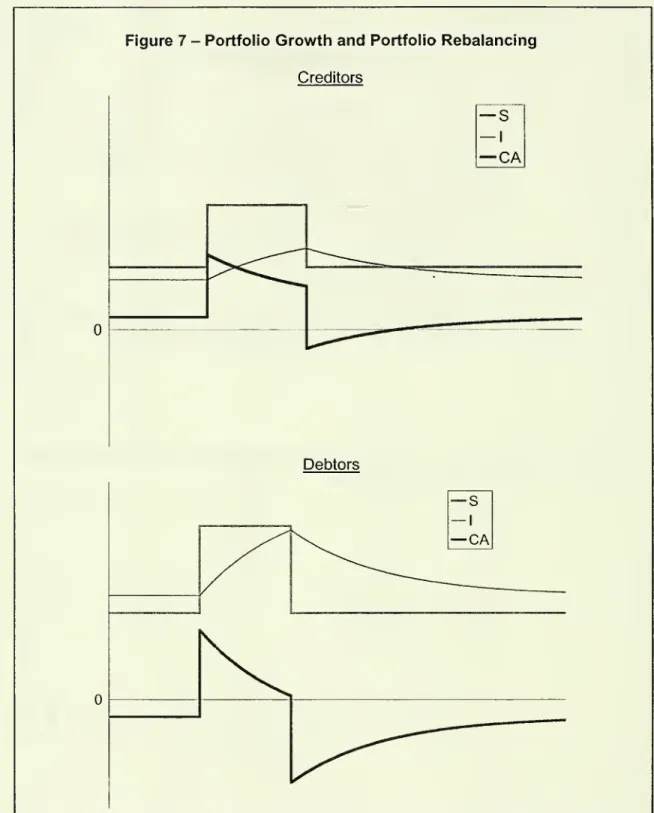
For instance, Figure 7shows
thecase
of positive adjustmentcosts in a creditor
and
a debtorcountry.One
can
interprettheseexamples
as a combinationof portfoliogrowthand
portfolio rebalancing along the lines oftheexplanationsof Figures
5
and
6.The
theorydeveloped
here thereforeequips uswith aclear picture of the factors that
determine
how
the currentaccount
reacts to increasesinsavings.
The
next stepistogo
back
to actualdataand
attemptto interpret itfrom
thevantage
point ofthetheory.III.
The
Process
of
Current
Account
Adjustment
In the introduction,
we
argued
that in the long runmost
ofthe variation incurrent
accounts
inOECD
countries isdue
to portfoliogrowth
effects, while in the shortrun, current
account
fluctuations primarilyreflectchanges
in the composition ofcountryportfolios orportfolio rebalancing.
We
made
this pointbased
on
theobservationthatthesimple interaction ofacountry's foreign asset
share
with its saving,averaged over
thepastthirtyyears,
proved
tobe
a verygood
predictor ofthe country'saverage
current account.
However,
thesame
interaction using annual dataproved
tobe
a verypoor
predictor ofyear-to-yearfluctuations in current accounts. Thiswas
shown
inthetwo
panelsof Figure2.10The
theorypresented
above
has
the potential to explain these observations. Inthe
presence
ofadjustment
costs to investment, thetheorypredicts that in theshort-run countries react totransitory
income
shocks by
raising savingsand
rebalancing theirportfolios
towards
foreign assets. Ifthese costs are sufficientlystrong, thetheorycan
therefore explain
why
the shortrun variation inthe currentaccount
isdominated by
portfolio rebalancing,
and
notportfolio growth.The
theoryalso predicts that in theaftermath ofthe
shock
countries graduallyrebalance theirportfoliosback
to theiroriginal composition. Therefore the theory
can
also explainwhy
thelong-run variationin the current
account
isdominated
by portfoliogrowth,and
not portfolio rebalancing.The
theoryalsohas
very clearpredictionsforthe patterns of portfoliorebalancingthat
we
shouldobserve
in the data.The
new
rule orportfoliogrowth
10
Ofcourse,onecould arguethatthisdiscrepancyinthe"between"and"within"resultsissimplydueto
muchgreatermeasurementerrorinthewithin-country variationincurrent accountsandportfoliogrowth
than inthebetween-countryvariation. Whilemeasurementerroris certainlypresent,
we
clearlydonotthinkitisthewholestory.
One
waytoseethisistonotice that(i) measurementerrorintheRHS
variableinour regressionwillbias theslopecoefficientdownwardby afactorequaltothe signal-to-noiseratio,and
(ii)measurementerrorinboththe
LHS
andRHS
variableswillbiastheR
2coefficientby afactorequaltotheproductofthe signal-to-noiseratios inthetwovariables. Since
we
observeaslopecoefficientofone-halfand an
R
2coefficientthatfallsfrom0.6 inthe"between" regressionto 0.03inthewithin regression, thisimpliesasignalto noiseratioofonly 0.5 intheRHS
variableand0.1 intheLHS
variable. Whilethere areclearlyvariousmeasurementissuesinourdata,we
finditimplausiblethatthe dataisasnoisyasthis calculationwouldsuggest.component
ofthecurrentaccount
under-predictsthe actual currentaccount
during theshock
period as countries rebalancetheir portfoliostowards
foreignassets,whilethenew
rule over-predictsthe currentaccount
aftertheshock
as countries rebalance theirportfolios
back towards
itsoriginal composition. In other words, acontemporaneous
increasein savings should
be
associatedwith a positive portfolio-rebalancingcomponent
ofthe current account,while past increases in savingsshouldbe
associated with negative values inthe
same
component.
Moreover, forthenew
ruletoapply inthe long run,these positive
and
negativecomponents
shouldbe
roughlyofthesame
magnitude. In thissection,we
show
that thedata is consistent with thesepredictions.
We
beginby
decomposing
observed
currentaccounts
into portfoliogrowthand
portfolio rebalancing
components.
As
in the theory, let Xctdenote
theshare
offoreignassets in theportfolio ofcountryc atthe beginning of period t,
and
letS
ctand
CAc
tdenote
gross national savingand
the currentaccount balance
as afraction ofGDP
during periodt.
We
measure
the portfolio-growthcomponent
ofthe currentaccount as
PG
ct=
xct•
S
ct, i.e. the net
purchases
offoreign assetsthatwould be observed
duringperiod t if a country
were
to distribute itssavingbetween
domestic
and
foreign assetsin the
same
proportionas
its existing portfolio atthe beginning ofthe period.We
measure
the portfolio-rebalancingcomponent
ofthe currentaccount
residuallyas
thedifference
between
the actual currentaccount
and
the portfolio-growthcomponent,
i.e.PR
ct=CA
ct-x
ct -Sct .To
implement
this decomposition,we
requiredataon
current accounts, savingand
theshareofforeign assets in country portfolios.We
obtain annual dataon
currentaccounts
in currentUS
dollarsfrom
the InternationalMonetary
Fund's InternationalFinancialStatistics.
We
measure
gross national saving as thesum
ofthe currentaccount
and
grossdomestic
investment in currentUS
dollars,and express
bothas a
fraction of
GDP
incurrentUS
dollars, obtaining investmentand
GDP
from
theWorld
Bank's
World
Development
Indicators.We
obtain dataon
theshare of foreign assetsin wealth
from
Kraay, Loayza,Serven and Ventura
(2000).We
restrictattention tothesetof21 industrial countriesfor
which
at least20
annual observationson
this variableare available
over
the period1966-1997 covered by
this dataset.With
dataon
savingand
the portfolio-rebalancingcomponent
ofthe currentaccount
in hand,we
estimate a series ofdynamic
linearregressions ofthe form:p q /
(11)
PR
d=a
c+£<|>
w
-PR
Cit_v+£Ycv-S
Ci,_ v+P
cZ
ct+u
ctv=1 v=0
where PRc
tand
S
ctare the portfolio-rebalancingcomponent
ofthe currentaccount
and
saving
as
described above; Zct isa vectorof control variables,and
Ud
is awell-behavederrorterm.
We
thenuse
the point estimates ofthe coefficientsto retrievethe impliedimpulse
response
function ofportfolio rebalancing in periodt+ktoan
increase insavingdPR
c•,lin period t, i.e. :
—
.
These
impulseresponses
provideus
with a picture ofhow
3S
ctcountries
change
thecomposition of their portfolios followingan
increase in saving.The
results offoursuch
regressions aresummarized
inTable
1.The
top panelofTable
1 reportsthe estimated coefficients,while thebottom
panel reportsthe corresponding impulseresponse
functions using the21 -countrysample
ofannual
observations.
The
estimated impulseresponse
functions are also plotted in thefourpanelsof Figure8.
We
begin byassuming
that all ofthe slope coefficients are thesame
acrosscountries. In our simplestspecification,
we
alsosetp=0
and
introduce5
lags ofsaving.11
The
results of thisspecification are reported in thefirstcolumn
ofTable
1. In this case, theimpulseresponse
function simply consists oftheestimated coefficientson
currentand
lagged saving.We
find a strong positivecontemporaneous
correlationbetween
savingand
thecurrent account.The
pointestimate of0.6can be
interpretedas the fraction of
an
increase in saving that,on
impact,would be
invested in foreignassets bya countrywith zero initialforeign assets. Thisfraction
would be
slightlyhigher (lower)in creditor(debtor) countries
because
ofthe portfolio-growthcomponent.
Sincethelatter
measures
thecurrentaccount
balancethatwould keep
the compositionoftheirportfoliosconstantfollowing
an
increase in saving, it is by construction positivein creditorcountries
and
negative in debtorones.The
subsequent
lags ofsaving all enter with negativecoefficientsthat are decreasing in absolute value and,with theexception ofthefirst lag, are notsignificantlydifferent
from
zero.These
coefficientscan be
interpreted as thefraction ofthe initialincrease in savingthat is reallocated
back towards domestic
assets ineach
ofthesubsequent
fiveyears. Interestingly, thesum
ofthe coefficientson
lagged saving is-0.09
which
is insignificantly differentfrom
zero. Thissuggests
thatthe initial shifttoward
foreign assets is largelyundone
in the nextfive years, with the bulk of thereadjustmentoccurring in thefirstyearfollowing the increase in saving. This pattern is
consistent with the predictions ofthetheory.
The
restofTable
1 reports avariety of robustnesschecks on
this basic result.We
begin by introducing lagged values ofthe portfolio-rebalancingcomponent
ofthe current account,and
findthat thefirstand second
lags are stronglysignificant,whilethird (and higher) lagsare not.12
Although
this slightly altersthe point estimatesofthecoefficients
on
currentand
lagged saving,we
find thattheshape
of impulseresponse
function isverysimilar tothat reported in thefirst regression.
The
main
differenceisthattheinitial shifttoward foreign assets is slightlysmallerthan before, at
50
percent ofthe increase in saving.
11
In unreportedresults,
we
findthatfifthandhigherlagsofsavingareinsignificantlydifferentfrom zeroinmostspecifications,andaddinghigher lags haslittleeffectonthe pointestimatesofthe coefficientsonthe
firstfivelags.
12
We
areassumingherethatthetimedimensionofour panelissufficientlylargethatwe
canobtain consistentestimatesofthe coefficientson thelaggeddependentvariableinthepresenceof fixed effects relyingon large-Tasymptotics.Remember
alsothatsavingisconstructedas investmentplus the currentaccount,andthelatteris highlycorrelated withthedependentvariableinEquation(11). Tothe extentthat
the portfolio-rebalancing componentofthe currentaccountismeasuredwitherrorsthatare persistentover
time,thiscould introduceacorrelation betweenthe residualsandcurrentandlaggedsaving. Inthe specifications withlagsofthedependentvariable,wetest foranddonotrejectthenullofnoserial
dependenceinthe residuals,andsowe canruleoutthispotentialsourceofbiasinourestimated impulse responses.
Inthe next
column
we
augment
the specification ofthe previouscolumn
with several additional control variables.To
the extent thatthere are othershocks
to returns thatchange
the desiredcomposition
of country portfolios,and
totheextentthat these are correlated with saving, thiswill bias our results in directionswhich
depend
on
the signsofthese correlations.For
example,
ifthere areglobalshocks which
raise savingand
investmentin all countries (suchas
changes
inworld interest rates),we
willbe
underestimating the size ofthe initial shifttowardforeignassets
when
savingincreases. Similarly, ifin countries
and
yearsinwhich
saving is high, factorsthatincrease the desired rateof
investment
(suchas
population or productivitygrowth),we
may
againbe
underestimating the shifttoward
foreign assets.To
controlforthesefactors,
we
introduceyear
dummies
tocapture global shocks, population growth,and
Solow
residuals as a proxyforproductivitygrowth.13The
thirdcolumn
ofTable
1reports the results of this
augmented
regression. Populationgrowth
and Solow
residualsenter significantlywith the
expected
negative signs,and
we
find a largershifttoward
foreign assetsthan before, with75
percent oftheinitial increasein savingallocated
toward
foreign assets.However,
thesubsequent
pattern ofadjustment isthesame
as
before, with the initial shifttoward
foreign assets being reversed in nextfew
years.
Inthefinal
column,
we
relaxtheassumption
thatthe slope coefficients inEquation (11) arethe
same
across
countries,and
instead estimate this equation separatelyforeach
country.Because
ofthefairly shorttime-series available foreach
country,
we
adopt
amore
parsimonious
lag structure, introducing onlytwo
lags ofthedependent
variableand
of saving,as
well as populationgrowth
and
Solow
residuals.We
reporttheaverage
and
standard deviation across countries oftheestimatedcoefficients in the last
column
ofTable
1. 14Notsurprisingly,
we
find thatthecountry-13
We
constructSolowresidualsasthegrowthinGDP
atconstantprices lessgrowthinemploymenttimesthe period averageshareoflabourin
GDP,
drawingthelattertwovariablesfromtheOECD
LabourForceStatisticsandNationalAccounts.
Inthepresenceofparameter heterogeneityacrosscountries, thepooled estimates reportedinthe
previoustwocolumnswill not deliverconsistentestimatesofaverage (acrosscountries)ofthese
parameterswhenthereisalaggeddependentvariable(PesaranandSmith (1995)). However,the
averageacrosscountriesoftheestimatedcoefficientswillprovideaconsistentestimateoftheaverage
by-country
parameters
aremuch
less preciselyestimated,and
the dispersion acrosscountries in the pointestimates is large. Nevertheless,
we
find results that arequalitatively
and
quantitativelyquite similar tothoseinthe previous columns.On
average, thefraction of
an
increasein savingthat is allocatedtoforeign assets is0.7,and
this initial shifttoward
foreign assets isquicklyundone
insubsequent
periods.One
drawback
oftheannual dataon which
we
have
reliedso
faristhat it is notinformative
about
theintra-yeardynamics
of savingand
the current account. For 12 ofthe countries in our
sample,
we
were
abletoobtain quarterlyobservationson
thecurrentaccount, investment
and
GDP
beginning in1980
orearlierfrom
theInternational Financial Statistics
and
theOECD
Quarterly National Accounts. Forthesecountries,
we
linearly interpolatethe annual dataon
theforeignasset shareand use
itto construct quarterly portfoliogrowth
and
rebalancingcomponents.
We
thenre-estimate Equation (11) using quarterly data, introducing eight lags of the portfolio
rebalancing
component
ofthe current account,and
eight lags of saving.We
do
nothave
quarterlydataon
population oremployment
growth required to introducethesame
control variablesas
inthe previous regressionswith annual data (Regressions 3and
4 inTable
1).We
therefore include only a setof perioddummies
and
realGDP
growth
as
controls.As
before,we
summarize
the results ofthese country-by-country regressionsby
computing
themean
and
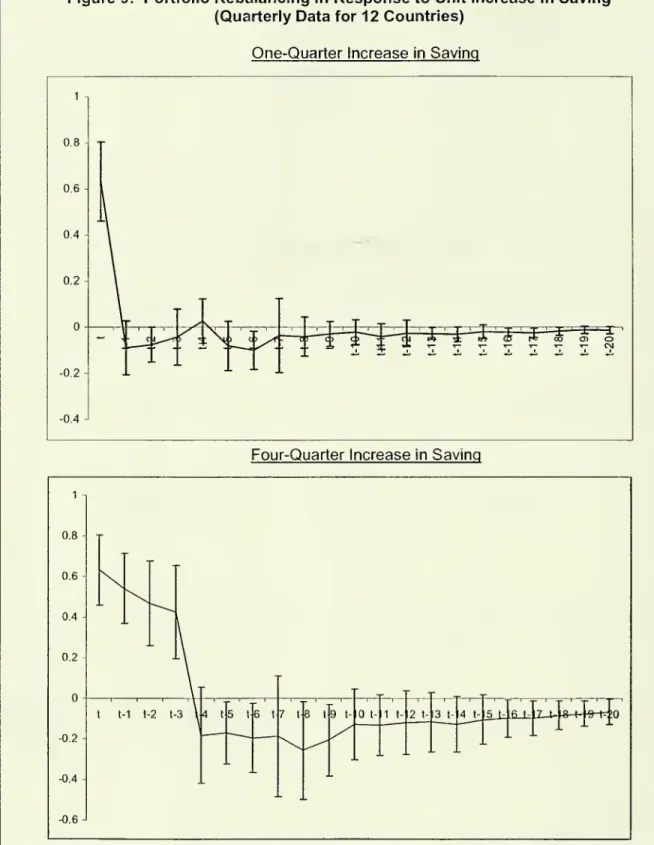
standarddeviation acrosscountries ofthe estimated impulse responses.As shown
in the top panel of Figure9,we
find thaton
impact, justover
60
percentofan
increase in saving thatlastsone
quarteris invested abroad. Beginning immediately inthe next quarter, this initialshifttoward
foreign assets beginsto
be
reversedas
countries run currentaccount
deficits. Ifwe
considerashock
tosaving that lastsfour quarters,the pattern that
emerges
is verysimilar to thatwe saw
in the annual data. This is
shown
inthebottom
panel of Figure 9. During theshock
period, countries run positive but declining current
account
surplusesas
theyuse
response.
We
findresults thatarequantitativelyquitesimilaracross allspecificationsdespitethis potentialsourceofbiasinthe estimates whichimpose parameter homogeneityacrosscountries.
foreign assets
as
a bufferstocktosmooth
investment. Insubsequent
years, countries run currentaccount
deficits inorderto restoretheir original pre-shock portfolios.To
sum
up,while portfolio growth explainsmuch
ofthe long-run variation incurrent accounts, portfolio rebalancing
dominates
in the short run. In all ofourspecifications,
we
find thatthe portfolio-rebalancingcomponent
ofthe currentaccount
follows a
remarkably
clearpattern.On
impact,up
tothree-quartersof ashock
to savingis invested
abroad as
countriesuse
foreign assetsas
a bufferstocktosmooth
investment intheface of adjustmentcosts. In
subsequent
periods, the initial increasein saving
produces
currentaccount
deficitsas
countries shifttheir portfoliosback
totheir original composition.
IV.
The
Current
Account
and
Investment
Over
the past20
years considerable empirical efforthas
been
devoted
todocumenting
the correlationsbetween
investmentand
thecurrent account.Two
stylized facts
have emerged.
First, cross-countrycorrelationsbetween
investmentand
the current
account
areweak
(Penatiand Dooley
[1984],Tesar
[1991]).Second,
withincountriesthetime-series correlation
between
investmentand
thecurrentaccount
isconsistently negative (Glick
and
Rogoff[1995]).We
document
thatthesetwo
stylizedfacts hold in our
sample
ofcountries in Figure 10. In the toppanelwe
plot long-runaverages
ofthe currentaccount
as afraction ofGDP
(on thevertical axis)against long-run investment rates (onthe horizontal axis) forthe21 industrial countriesin our sample.Across
countries,we
find a veryweak
negative correlationbetween
thetwo,with a coefficientof-0.036. Inthe
bottom
panel,we
plotthesame
two
variablesexpressed as
deviationsfrom
countrymeans,
pooling all available annualobservations. Withincountries, the correlation
between
investmentand
thecurrentaccount
is strongly negative, witha coefficient of-0.329.15Thisdifference
between
the correlationsbetween
the currentaccount
and
investment inthe long
and
shortrun are consistent with theview
ofthe currentaccount
proposed
in this paper.To
see
this, it is useful towritethecurrentaccount
and
investment
as
follows:(12)
CA
ct=x
ct -Sct+PR
ct(13) l
ct
=(1-x
el)-S
et-PR
elThese
equationsdecompose
the currentaccount
and
investment into theirportfolio-growth
and
portfolio-rebalancingcomponents.
The
key
observation toexplainthepattern ofcorrelations
between
the currentaccount
and
investment is thatthelong-run relationship
between
thesevariables isdominated by
their portfolio-growthcomponents,
while the short-run relationship isdominated by
the portfolio-rebalancingcomponents.
To
make
this statement precise,we
decompose
thecoefficientof aregressionofthe current
account
on
investment into thecontributions ofportfoliogrowth
and
portfolio rebalancing. Let pbe
this regression coefficientand
define PG_
Cov(xS,(1-x)l)
gnd
PR_
Cov(CA,l)Cov(x-S,(1-x)l)
Sjnceb=3
pg+b
prVar(l) P Var(l) Var(l) ' P P P
'
we
interpret (3PG
and
(3PR
as
the contributions of portfoliogrowthand
portfoliorebalancingtothe relationship
between
the currentaccount
and
investment.When
we
perform thisdecomposition
on
thebetween
estimatorin the top panelof Figure 10,
we
find that (3PG
=-0.041
and
(3PR
=0.005. Consistentwith thetheory,
portfolio rebalancing plays
no
role inthe long runand
the relationshipbetween
thecurrent
account
and
investment reflects only portfolio growth. Moreover, thetheorypredicts thatthecorrelation
between
thecurrentaccount
and
investment shouldbe
Thisisalmostexactlythesameastheaverageofcountry-by-countryestimates reportedinGlickand
Rogoff[1995],
negative in debtor countries
(where
x>1)and
positive in creditorcountries(where
x<1).The
intuition is simpleand
follows immediatelyfrom
thenew
rule: in debtorcountriesincreasesin saving
generate
even
greater increases in investment, leading to currentaccount
deficits, while in creditorcountriesthe increase in investment is less than thatofsaving, leading tocurrent
account
surpluses. Since oursample
ofcountries consistsofa mixture of
15
debtorand
6creditorcountries,we
should expectto find a negativebutnot especially strong correlation
between
investmentand
the currentaccount
in across-section thatpools all countries together. This is exactly
what
we
found
inthe toppanel ofFigure 10. But
when
we
divideour
sample
into debtorsand
creditorsand
compute
thecorrelations separately inthetwo
groups,we
shouldfind a negativecorrelation
among
debtorsand
a positive correlationamong
creditors. Figure 1 1shows
thatthis isthe case.
Of
course,we
have
onlya very smallsample
ofcreditorsand
debtors,
and so these
differences in slopes shouldbe
takenwith a grain of salt.Nevertheless,
we
notethatthey are consistentwiththe theory.When
we
perform thesame
decomposition on
thewithinestimator inthebottom
panel of Figure 10,we
findthat (3PG
=-0.014
and
pPR=-0.315. Consistentwith the theory, portfolio rebalancing is importantin theshort runand
this introduces asourceof negative correlation
between
thecurrentaccount and
investment. In thepresence
ofadjustment
costs, ashock
toincome
in a given period triggersan adjustment process
thatlastsfor
many
periods. In particular,a
positiveshock
toincome
raises savingcontemporaneously and
isfollowedby
several periods of portfolio rebalancing,as
countries
have
higherthannormal
investment financed by currentaccount
deficits inorderto restoretheir pre-shock portfolios.
The
oppositeoccurswhen
thereis anegative shock.
Thus
positiveshocks
triggera "ripple"effectofsubsequent
higher investmentand
lower current accounts,and
vice versafor negativeshocks. This"ripple" effect is a
source
of negative correlationbetween
investmentand
the currentaccount
within countries.V.
Concluding
Remarks
By
reconciling longand
short run data, thispaper
completes
theview
ofthecyclical behaviorofsavings, investment
and
the currentaccount
in industrialcountriesthat
we
firstproposed
inKraay
and Ventura
[2000].Faced
withincome
shocks,countries
smooth
consumption by
raising savingswhen
income
is highand
vice versa.In the short run, countries invest
most
oftheirsavings inforeign assets, only torebalance their portfolios
back
to their original composition in the nextfourto five years. Inthe long run, countryportfoliosare remarkably stable, thenew
ruleappliesand
fluctuations in savings lead'tofluctuationsin the currentaccount
thatare equal tosavings times the
share
offoreign assets in thecountry portfolio.By
usingforeignassets
as
abuffer stock, countriessmooth
investment inordertosave on
adjustmentcosts.
An
interesting implication ofthisview
of international capital flows isthatthestock offoreign assets
and
the currentaccount
aremore
volatilethanconsumption,
investment
and domestic
capital stock. Butthisdoes
notmean
that internationalcapitalflowsare afactor thatcontributesto
making
macroeconomic
aggregates
more
volatileorunstable.
To
the contrary, theview
presented heresuggests
that theabilitytopurchase
and
sell foreign assets allowscountries not onlytosmooth
theirconsumption,
but alsotheir investment. Foreign assetsand
the currentaccount
absorb
partofthevolatilityofthese other
macroeconomic
aggregates.References
Caballero, Ricardo,
"Aggregate
Investment," InJohn
B.Taylorand
MichaelWoodford,
Eds.,
Handbook
ofMacroeconomics,
Vol. 1B.Amsterdam,
The
Netherlands:Elsevier, 1999.
Deaton,
Angus.
Understanding Consumption.
Oxford:Clarendon
Press, 1992.Dixit,
Avinash
K.,and Robert
S. Pindyck,Investment
Under
Uncertainty. Princeton,NJ: Princeton University Press, 1994.
Dombusch,
Rudiger, "Real Interest Rates,Home
Goods,
and
Optimal
ExternalBorrowing,"JournalofPolitical
Economy,
XCI
(1983), 141-153.Feldstein, Martin,
and Charles
Horioka,"Domestic
Savings
and
International Capital Flows,"Economic
Journal,XC
(1980), 314-329.Glick,
Reuven
and Kenneth
Rogoff, "Global versus Country-Specific ProductivityShocks
and
the Current Account," JournalofMonetary
Economics," 35
(1995),159-192.
Kraay, Aart,
and
Jaume
Ventura, "CurrentAccounts
inDebtor
and
Creditor Countries,"QuarterlyJournal of
Economics,
XCV
(2000), 1137-1166.Kraay, Aart,
Norman
Loayza, Luis Serven,and
Jaume
Ventura, "Country Portfolios,"NBER
Working
Papers, No. 7795, July2000.Lewis, Karen, "Trying to Explain
Home
Bias in Equitiesand Consumption,"
Journal ofEconomic
Literature,XXXVII
(1999),571-608.
Lucas, Robert E. "Adjustment
Costs
and
theTheory
ofSupply," JournalofPoliticalEconomy,
(1967)75, 321-334.Matsuyama,
Kiminori, "CurrentAccount
Dynamics
in a Finite Horizon Model," JournalofInternational
Economics,
XXIII (1987), 299-313.Meilon, Robert,
"Optimum Consumption
and
PortfolioRules
in aContinuous-Time
Model," Journal of
Economic
Theory, III (1971), 373-413.Obstfeld, Maurice,
"Aggregate
Spending
and
theTerms
ofTrade: IsThere
aLaursen-Metzler Effect?" QuarterlyJournal of
Economics,
XC
(1982), 251-270.Obstfeld Maurice,
and Kenneth
Rogoff,"The
IntertemporalApproach
tothe Current Account." InGene Grossman
and Kenneth
Rogoff, eds.,Handbook
ofInternational
Economics.
Amsterdam,
The
Netherlands: Elsevier, 1995.Penati, A.
and
M. Dooley, 1984. Currentaccount
imbalances
and
capital formation inindustrial countries, 1949-81,
IMF
StaffPapers
31, 1-24.Persson, Thorsten,
and
LarsSvensson,
"CurrentAccount
Dynamics
and
theTerms
ofTrade: Harberger-Laursen-Metzler
Two
Generations
Later," Journal of PoliticalEconomy,
XCIII (1985), 43-65.Pesaran,
Hashem
and
Ron
Smith, (1995). "EstimatingLong-run
Relationshipsfrom
Dynamic
Heterogenous
Panels". Journal of Econometrics.68
(1995) 79-113. Sachs,Jeffrey,"The
CurrentAccount
and
Macroeconomic
Adjustment
in the 1970s,"Brookings
Papers
on
Economic
Activity, 1 (1981), 201-268.,
"The
CurrentAccount
in theMacroeconomic
Adjustment
Process," .Scandinavian
Journal ofEconomics,
LXXXIV
(1982), 147-159.Svensson,
Lars,and Assaf
Razin,"The
Terms
ofTrade and
the CurrentAccount:The
Harberger-Laursen-Metzler Effect,"Journal ofPoliticalEconomy,
XCI
(1983),97-125.
Tesar, Linda, "Savings, Investment
and
International Capital Flows," Journal ofInternational
Economics,
XXXI
(1991), 55-78.Ventura,
Jaume,
"A PortfolioView
ofthe U.S. CurrentAccount
Deficits". BrookingsPapers on
Economic
Activity. (2001), July.Tabid:
PortfolioRebalancing
and Saving
(An nualData
for 21Countries)
Reqression 1 Rearession 2 Reqression 3 Reqression 4
Mean
SDof
Coef S.E Coef S.E Coef S.E Coef Coefs
CoefficientEstimates sy 0.598 0.096 0.504 0.080 0.746 0.079 0.691 0.286 sy(-1) -0.281 0.133 -0.611 0.102 -0.824 0.104 -0.767 0.383 sy(-2) -0.120 0.106 0.112 0.077 0.109 0.070 0.123 0.167 sy(-3) -0.120 0.095 -0.043 0.073 0.040 0.067 sy(-4) -0.102 0.103 -0.031 0.065 -0.063 0.061 sy(-5) -0.060 0.078 0.020 0.058 0.019 0.057 pr(-1) 0.754 0.056 0.845 0.057 0.837 0.216 pr(-2) -0.114 0.069 -0.081 0.066 -0.152 0.186 pr(-3) -0.031 0.049 -0.076 0.047 dq * -0.375 0.050 -0.390 0.198 dpop -0.684 0.188 -0.267 1.293 CountryEffects
Y
Y
Y
YearEffectsN
N
Y
ImpulseResponses t 0.598 0.096 0.504 0.054 0.746 0.059 0.691 0.286 t-1 -0.281 0.133 -0.231 0.096 -0.193 0.095 -0.179 0.222 t-2 -0.120 0.106 -0.119 0.058 -0.114 0.056 -0.111 0.142 t-3 -0.120 0.095 -0.122 0.060 -0.098 0.054 -0.088 0.106 t-4 -0.102 0.103 -0.102 0.042 -0.122 0.047 -0.059 0.076 t-5 -0.060 0.078 -0.039 0.028 -0.068 0.040 -0.038 0.063 t-6 -0.014 0.024 -0.040 0.037 -0.024 0.057 t-7 -0.003 0.020 -0.019 0.035 -0.018 0.048 t-8 0.000 0.016 -0.008 0.033 -0.014 0.041 t-9 0.001 0.012 -0.002 0.030 -0.013 0.036 t-10 0.001 0.009 0.001 0.027 -0.011 0.032Note: Thistable reportsthe results ofestimating Equation (11)inthepaper. Thefirstthreecolumnsassumeslope
coefficients are he
same
acrosscountries. The lastcolumnreportsthemean
andstandarddeviation acrosscountriesofcountry-by-countryestimates Standard errors fortheimpulseresponsesincclumns(2)and(3)are
simulated using500 drawsfromtheestimateddistributionof coefficients.
Figure
1:The
TraditionalRule
and
the
New
Rule
TraditionalRule
nationalsaving :rvations foran 0.1 -0.05 -Q.Q
O
0-*3 § ( g -0.05-<
£ -0.1 -3o
-0.15 --0.2y=0.231x-
0.062 R2= 0.124*
*
Saving/GDPNew
Rule
0.1 -y =0.939x-0.002R
2 =0.301 Ji.Q5,W"
*
0.05 5alth) § -0.15 *0.1*
^
-1W5*WM
1
^^^
**
£^
+
U
-<%-5
-0.15 --0.2(Saving/GDP)x (Foreign
Assets/W
Note: Thetopi
(gross national
unbalancedpar
bottom) panelplotsthe currentaccount balance as a shareof
GDP
againstgrosssaving interacted with the foreignassetposition),poolingallavailableannual obs«
leiof21