HAL Id: hal-01609306
https://hal.archives-ouvertes.fr/hal-01609306
Submitted on 3 Oct 2017
HAL is a multi-disciplinary open access
archive for the deposit and dissemination of
sci-entific research documents, whether they are
pub-lished or not. The documents may come from
teaching and research institutions in France or
abroad, or from public or private research centers.
L’archive ouverte pluridisciplinaire HAL, est
destinée au dépôt et à la diffusion de documents
scientifiques de niveau recherche, publiés ou non,
émanant des établissements d’enseignement et de
recherche français ou étrangers, des laboratoires
publics ou privés.
Passive heaving of elliptical cylinders with active
pitching – From cylinders towards flapping foils
Martin Griffith, David Lo Jacono, John Sheridan, Justin S. Leontini
To cite this version:
Martin Griffith, David Lo Jacono, John Sheridan, Justin S. Leontini. Passive heaving of elliptical
cylinders with active pitching – From cylinders towards flapping foils. Journal of Fluids and Structures,
Elsevier, 2016, vol. 67, pp. 124-141. �10.1016/j.jfluidstructs.2016.09.005�. �hal-01609306�
O
pen
A
rchive
T
OULOUSE
A
rchive
O
uverte (
OATAO
)
OATAO is an open access repository that collects the work of Toulouse researchers and
makes it freely available over the web where possible.
This is an author-deposited version published in:
http://oatao.univ-toulouse.fr/
Eprints ID : 18521
To link to this article :
DOI:10.1016/j.jfluidstructs.2016.09.005
URL : http://dx.doi.org/10.1016/j.scriptamat.2016.07.006
To cite this version :
Griffith, Martin and Lo Jacono, David and Sheridan, John and
Leontini, Justin S.
Passive heaving of elliptical cylinders with active
pitching – From cylinders towards flapping foils.
(2016) Journal of
Fluids and Structures, vol. 67. pp. 124-141. ISSN 0889-9746
Any correspondence concerning this service should be sent to the repository
administrator: staff-oatao@listes-diff.inp-toulouse.fr
Passive heaving of elliptical cylinders with active pitching – From
cylinders towards
flapping foils
Martin D. Gri
ffith
a,⁎, David Lo Jacono
b,c, John Sheridan
d, Justin S. Leontini
aaSwinburne University of Technology, Hawthorn, Victoria 3122, Australia
bUniversité de Toulouse; INP; IMFT (Institut de Mécanique des Fluides de Toulouse), Allée Camille Soula, F-31400 Toulouse, France cCNRS; IMFT, F-31400 Toulouse, France
dFluids Laboratory for Aeronautical and Industrial Research (FLAIR), Department of Mechanical and Aerospace Engineering, Monash
University, Melbourne, Victoria 3800, Australia
A B S T R A C T
This paper presents a study of the flow past elastically mounted cylinders with prescribed rotational oscillation about the cylinder centre, which are free to heave, or oscillate transverse to theflow. The configuration serves as an idealized model of a flapping-foil energy harvester. A range of geometries are tested, from the circular cylinder with an aspect ratio of 1.0 to elliptical cylinders up to aspect ratio of 6.0 approaching aflat plate. The driving frequency of the rotational oscillation is varied, while the amplitude of rotation isfixed atπ/2, meaning both axes of the geometries present fully to the oncomingflow each cycle. The Reynolds number is 200. The natural frequency of the elastic-mounting is set to the Strouhal frequency for a circular cylinder. The ratio of the mass of the cylinder to the mass of the equivalent volume of displaced fluid is set to 5.0. Configurations with zero-damping reveal a rich parameter space, with increasing cross-stream oscillation with increasing geometry aspect ratio. Driving frequencies for peak oscillation amplitude are grouped around a driving frequency of 0.9 times the natural frequency of the elastic structure. The variation of the power input to actuate the rotational oscillation of the cylinder is also analysed. Thefluid structure interaction is analysed for energy harvesting potential; power output is modelled by linear damping on the heave. Increasing the damping on the structure leads to optimal values of driving frequency and damping for each aspect ratio tested. For each aspect ratio, comparisons are drawn and similarities found between these optimal cases for power output and the undamped cases for maximum oscillation amplitude and velocity. The study of the parameter space serves as a useful starting point for
further study of the many parameters affecting the performance of flapping-foil energy
harvesting.
1. Introduction
The need to limit the growth of greenhouse gas emissions has driven the search for alternative zero- or low-emission energy sources. The feasibility of extracting energy from aflow using a pitching and heaving aerofoil was explored inKinsey and Dumas (2008). Rotational and cross-stream oscillation was prescribed on a NACA 0015 aerofoil in a uniform flow, varying the pitching frequency and amplitude, while keeping the cross-stream oscillation at one chord length and the pitching axis at one third of the
http://dx.doi.org/10.1016/j.jfluidstructs.2016.09.005
⁎Corresponding author.
chord length from the leading edge. A mechanism to extract energy was not considered, but rather the work done by thefluid on the body. When this work is positive, power extraction is possible. For their configuration, they identified optimal rotational frequencies (normalized by chord length andflow speed) in the range0.12 ≤ ≤ 0.18f and amplitudes in the range70° ≤Aθ ≤ 80°, whereAθis the
rotation amplitude. A keyfinding of the study was that the motion parameters, such as heaving amplitude and rotation frequency and amplitude, were the critical parameters for performance, and that geometry (aspect ratios ofΓ= 5.0, 6.67 and 50 were tested, where Γ is the ratio of chord length to thickness) and viscous parameters (Reynolds number was varied, as well as application of turbulence modelling) were of secondary importance. These are importantfindings as they support the generalization of lower-Reynolds number dynamics and the convergence of behaviour with aspect ratio, albeit only for aspect ratioΓ> 5.0.
Useful reviews of the subject can be found inXiao and Zhu (2014)andYoung et al. (2014).Xiao and Zhu (2014)suggest that more work be done on semi-activated and self-sustaining systems, as well as on three-dimensional configuration, specifically the effect of spanwise aspect ratio. Young et al. (2014)suggest work on self-sustaining systems and on foilflexibility; indeed many studies have focussed on the possibility of addingflexibility or a time-dependent deformation to the aerofoil, with the intent of increasing power extraction efficiency.Hoke et al. (2015)examined extraction and propulsion with an aerofoil with a camber that deforms throughout the oscillation. Excluding the energy required toflex the aerofoil, this lead to an increase in efficiency. They also suggested the possibility of having the aerofoilflex passively. Using an immersed boundary-lattice Boltzmann method, Wu et al. (2015 a,b)investigated energy harvesting from aflapping aerofoil with either a rigid or flexible plate attached to the trailing edge, with prescribed pitching and heaving and with prescribed pitching andflow-induced heaving, finding that whether a rigid or flexible tail was used could significantly affect the Strouhal number and efficiency of the optimal configuration.Tian et al. (2014)investigated the effect of active and passive leading and trailing edge deformation of a flapping-plate flow energy harvester, finding that plate flexibility does not significantly affect the power-extraction capability of the plate, but active control on the leading edge of the plate can.
Zhu (2011) examined optimal frequencies forflapping foil energy harvesting (f≈ 0.15, normalized by chord length andflow speed), with prescribed pitching and heaving motions. They argue that a stable wake is better for energy harvesting and that a fully passive system is feasible, due to the near zero average power needed to actuate the foil rotation under optimal conditions.Deng et al. (2015)studied inertial effects on a semi-passive energy harvester with prescribed pitching and free heaving. In contrast to many other studies on the problem, power extraction was modelled using linear damping on the heave, which was included in the equation of motion. They found that efficiency decreases monotonically with mass ratio, but that inertial effects are negligible for mass ratios of less than 10. They qualify their results by noting that changes in behaviour with variation of pitching axis location, three-dimensionality and rotational moment of inertia are likely or unknown. The work ofDeng et al. (2015)is notable in that the power extraction, via linear damping, is calculated and its effect included in the body motion dynamics; they also present their results in terms of efficiency and in terms of power output.
The current study examines primarily the effect of aspect ratio on the power output of a passively heaving cylinder with active pitching. In the works described above, generally, the efficiency of energy harvesting is described as:
∫
η T P P dt ρU bd = 1 ( − ) 1 2 , t t t t T y = = + out in 3 0 0 (1)wherePoutis the harvested power,Pinis the input power to actuate the rotation, and the term12ρU bd3 yrepresents the available energy
in theflow, with ρ being the fluid density, U the freestream velocity, b the spanwise length of the body and dythe cross-stream extent
of the body's path. This is an efficiency equation that relates the performance of the energy harvester to that of more traditional wind turbines; the Betz efficiency limit of 59% is often cited (Betz, 1966), giving the limit of how much energy can be extracted from a givenflow stream. Problematic to this formulation of efficiency is that some flapping foil energy harvesters will rely on large heave to extract energy. A large amplitude oscillation is an indicator of greater energy transfer from thefluid to the structure and of a greater value of path extent, by. This positive energy transfer, orPout, also counteracts to reduce efficiency by increasing the term by. This
measure of efficiency is important in contexts where arrays of such devices are being considered, or where a limit exists on, for example, the cross-stream space available. However, for the current study, we focus on the dynamics of a single, idealized oscillating system. Having an efficiency formulation for a system that relies on heave to generate power, but which penalizes for that same heave, can be misleading in contexts where the aim is to maximize the power output. However, in future work on arrays of oscillating cylinders or with limited cross-stream domain, the efficiency formulation shown in Eq.(1)would need to be considered. For the present work, to non-dimensionalize power, we effectively replace the cross-stream extent parameter, dy, with, D, the major axis of
the elliptical cross-section, synonymous with the chord length.
Also problematic is the treatment of the power required to drive the rotation of the body,Pin. The required instantaneous input power can be calculated asPin=Mθ˙, where M is the torque exerted on the body by thefluid andθ˙is the rotational velocity of the
body. Forflapping foil energy harvesting, the time-averaged mean ofPin, Pin, generally returns a positive value, indicating a required
net input of energy to drive the rotational oscillation. However, the time-dependent termPin, usually switches signs throughout the cycle, indicating afluid torque at times pushing in the same direction as the body rotation and at others pushing against it. The term
Pinthen represents the sum of the energies required to accelerate the body rotation (whenPin> 0) and the energy absorbed by the
structure (whenPin< 0).Section 3.3deals in more detail with the calculation of the mean input power,Pin.
Across the studies of flapping foil energy harvesting, a common thread is the large range of parameters, assumptions and idealizations used to analyse the problem. The current study is no different, but does have the aim of examining a more fundamental
configuration and the possibility of linking the problem with other studies, such as those of bluff-bodies and vortex-induced vibration. With that aim, the current study investigates aflapping foil energy harvester using simpler geometry, namely the circular and elliptical cylinders. The heave is flow-induced, described by an equation of motion that includes a restoring force and a damping/energy extraction force. Active control is imposed by rotation around the centre of mass of each body (at the half chord point). The rotation is of amplitude Aθ = /2π . The aspect ratio of the cylinder is varied from the circular cylinder of aspect ratio Γ= 1.0to the elliptical cylinder ofΓ= 6.0. For the circular cylinder, the pitching contributes only viscous shear stress forcing, with the local velocity resulting from the pitching on the cylinder surface always aligned tangentially to the surface. As aspect ratio is increased beyond 1, the component of normal stress due to the pressure resulting from the pitching increases. Therefore, at higher aspect ratios theflow can potentially resist the pitching motion more forcefully.
This study seeks to examine the body andfluid dynamics of optimal configurations for power output, and examine how they vary across different cross-sectional body geometries, with the aim of presenting useful base cases and conclusions for investigation of further effects and parameter variations, such as geometry and rotation kinematics.
2. Problem definition and method
The study investigatesflows for rotationally oscillating geometries ranging from the circular cylinder to the flat plate, where energy is extracted via a damper on the passive heaving motion. The geometries tested are shown inFig. 1; namely,five ellipses of aspect ratio,Γ= minor axismajor axis = 1.0, 1.5, 2.0, 4.0 and 6.0. The length scale for the system is the major axis of each elliptical cross-stream, D, while the velocity scale is the velocity of thefluid in the freestream, U.
The cylinder is elastically mounted in the cross-stream, or heave, direction. The harmonic oscillator equation governing the heaving motion is:
M Y( ¨ + ( / ) ˙ + (2c M Y πfN) ) = ,2Y Fy (2)
whereY¨,Y˙and Y are respectively the acceleration, velocity and displacement of the cylinder perpendicular to the freestream, Fyis
the lift force on the cylinder, M is the mass of the cylinder, m*is the ratio of the mass of the cylinder to the mass of the equivalent volume offluid,cis the damping coefficient and fN = k M/ /(2 )π is the natural structural frequency of the undamped system, where
k is the spring stiffness. The natural structural frequency is chosen to be close to the vortex shedding frequency for a stationary circular cylinder, that is, f *N = 0.20; note that for the remainder of the paper, frequencies described with the superscript
*denote a
frequency non-dimensionalized using D and U. The vortex shedding frequency of a stationary cylinder will vary with aspect ratio and with the alignment of the cylinder axes with theflow; this variation for the stationary cylinder is explored in the results.
Active control is implemented via a pitching motion, withθ=Aθsin(2πf tD ), where θ is the angular displacement,fDis the driving
frequency andAθ is the pitching amplitude. An amplitude of Aθ = /2π is chosen. The driving frequency of the pitching motion is
varied in the range0.00 ≤ * ≤ 0.40fD . Optimal power output is explored by also varying the damping of the system,c. A constant ratio
of body density tofluid density is chosen as,m* =ρbody/ = 5.0ρ ; this mass ratio is within the range suggested byDeng et al. (2015)in
which inertial effects are negligible in terms of power extraction. AlthoughDeng et al. (2015)dealt with a different geometry and parameter space to the current study, we use theirfinding as a guide, leaving open the possibility that our results may be sensitive to variation of mass ratio. The Reynolds number is defined as Re UD ν= / , where ν is the kinematic viscosity; bearing in mind the criticality of the kinematic behaviour of the cylinder explored inKinsey and Dumas (2008), the Reynolds number wasfixed at
Re=200for all simulations.
2.1. Numerical method
Simulations are carried out using a sharp-interface immersed boundary method to represent the moving circular and elliptical bodies on an underlying Cartesian grid, on which theflow is found by solving the incompressible Navier–Stokes equations using a second-orderfinite-difference scheme (Mittal et al., 2008). The pitching motion of the body is controlled, while the heaving motion is found by solving the linear oscillator Eq.(2).
Time integration is performed via a two-way time-splitting scheme. First the advection and diffusion terms of the discretized Navier–Stokes equations are integrated to an intermediate velocity field. The advection term is integrated using a second-order
Adams–Bashforth scheme, while the diffusion term is integrated using an implicit Crank–Nicolson scheme, hence the resulting equation is implicit and needs to be solved iteratively, which is done using a Gauss–Jacobi scheme.
Second, the pressure term of the Navier–Stokes equations needs to be integrated from the intermediate velocity field to obtain the velocityfield at the end of the timestep. Continuity is enforced for the final velocity field, resulting in a Poisson equation for the pressure correction (the difference between the pressure at the previous timestep and the current timestep), which is solved using a custom geometric multigrid scheme. The resulting pressurefield is then used to complete the integration to the velocity field at the end of the timestep.
The body surface is represented by linearfinite elements – in a two-dimensional flow, this surface reduces to a curve and the finite elements reduce to linear line segments. The boundary conditions on the body surface are enforced via interpolation from the flow field and the boundary condition to the set of “ghost” points – those points on the underlying Cartesian grid which are inside the body, but which have neighbouring points outside the body. This creates a custom stencil for each ghost point, which is defined at run time and varies, as does the set of ghost points, throughout the history of the simulation as the body moves.
The forces on the body are obtained by interpolating the pressure and viscous stresses from theflow field onto the nodes defining thefinite elements of the body surface, and then integrating these stresses in a finite element sense. These forces are fed to the equation of motion of the body, which is integrated forward in time along with the Navier–Stokes equations using a weakly coupled Newmark-β scheme (Newmark, 1959).
Boundary conditions for the velocity field are a Dirichlet condition on the upstream and lateral boundaries specifying the freestream condition, and a Neumann condition at the downstream boundary that all normal gradients are zero. On the immersed body boundary, theflow velocity is set to be equal to the motion of the body surface. For the pressure, a Neumann condition of the normal gradient equal to zero is prescribed at the upstream and lateral boundaries, and a Dirichlet condition of zero pressure specified at the downstream boundary. On the immersed body boundary, a Neumann condition of the pressure normal gradient equal to zero is specified.
The underlying Cartesian grid was designed with a regular grid spacing around the cylinder covering a region up to 3D in each direction from the origin. Grid spacings were then increased linearly to the domain boundaries. The inlet and lateral domain boundaries were located 15D from the origin, while the outlet boundary was located 40D downstream. Twice as many grid points were used in the streamwise direction than in the transverse direction; the number of grid points in each direction is restricted to the powers of 2, thereby leading to a grid size of2N+1× 2N, where N is a whole number. We denote each grid as GN, such that G10
corresponds to a grid size of 2048×1024.
For aspect ratio,Γ= 1.0, the circular cylinder, the results obtained using the immersed boundary method across the driving frequency range and for zero structural damping were validated against results for the same problem using a spectral-element method. The software for the spectral-element method has been tested extensively in other oscillating bluff body flows and flow-induced vibration studies (Nazarinia et al., 2009; Lo Jacono et al., 2010; Leontini et al., 2006; Griffith et al., 2011). The results for maximum non-dimensionalized oscillation amplitude, A *max, returned by the immersed boundary method on grid G9 showed negligible differences with those returned by the spectral element method.
For aspect ratios, Γ= 2.0 and 4.0, results were tested for the resolution of the underlying Cartesian grid, for the cases of maximum amplitude oscillation with zero damping, corresponding to driving frequenciesf *D = 0.185and 0.180 respectively. There is
no damping, which when applied reduces the maximum amplitude and velocity of the oscillation, leading to smaller velocity gradients in thefluid. Four grids, G8, G9, G10 and G11 were tested; simulations on each grid ran with timestepsΔ / = 0.005tU D , 0.003125, 0.002 and 0.001, respectively. Table 1 presents the grid size in the near-cylinder region, Δxfine, and the maximum
amplitude achieved,A *max, for each of the two geometries.
For aspect ratioΓ= 2.0, the results for maximum amplitude,A *max, run with grid G9 return an error of less than 1% compared to the value returned by grid G11. For aspect ratioΓ= 4.0, the results for maximum amplitude,A *max, run with grid G10 return an error of less than 1% compared to the value returned by grid G11.
For a case with damping,Table 2presents the same grid resolution study, but for the case of optimal power output for aspect ratioΓ= 4.0outlined later inSection 3.4. This case features damping and smaller amplitude oscillation due to energy extraction from the heave. It shows the convergence with grid resolution of the power output, with the value ofPouton grid G9 within 3% of the
value for the higher resolution grid G11. For all the simulations using the geometries of aspect ratiosΓ= 1.0, 1.5 and 2.0, grid G9 was used. ForΓ= 4.0and 6.0, grid G10 was used, except for a limited range of the most high amplitude cases for aspect ratioΓ= 6.0
andc= 0.0. In these cases, the amplitude was large enough to require a larger area of constant grid resolution around the origin. Another mesh was constructed, also of grid size 2048×1024, which pushed the area of constant grid spacing out to 4D from the
Table 1
Parameters and maximum amplitudes for the four immersed-boundary grids tested, forRe=200and c=0, the two cases producing maximum amplitude oscillation for aspect ratiosΓ= 2.0and 4.0, corresponding to driving frequenciesf *D= 0.185and 0.180, respectively.
Grid Δxfine Amax* ( = 2.0)Γ Amax* ( = 4.0)Γ
G8 D/32 1.4452 2.0044
G9 D/64 1.5561 2.1155
G10 D/128 1.5484 2.1628
cylinder, at the expense of some far-field resolution. The comparison of results obtained for lower amplitude oscillation cases run on the two grids used for aspect ratioΓ= 6.0returned negligible differences in maximum oscillation amplitude.
3. Results
3.1. Flow past stationary elliptical cylinders
For the vibrating cylinder cases tested here, the structural frequency is set at f *N = 0.20, which is approximately equal to the
vortex-shedding frequency, f *St for theflow past a stationary circular cylinder for Reynolds number, Re=200. However, this result refers only to the stationary aspect ratio,Γ= 1.0, geometry; this study includes rotationally oscillating elliptical cylinders of aspect ratios up toΓ= 6.0. For background to the study, as well as context to the selection of the structural frequency adopted, theflow past the five elliptical cylinders was simulated, over a range of fixed pitch angles, θ0, but with no translation or rotation permitted.
Fig. 2(a) plots the measured vortex shedding frequency, for each case, over the range of pitch angle,0° ≤θ0≤ 90°and aspect ratio,
Γ
1.0 ≤ ≤ 6.0. Due to the symmetry of the ellipse, this range encompasses all possible angles of the ellipse to theflow, and, effectively, the range of aspect ratios0.167 ≤Γ≤ 6.0– an ellipse of aspect ratioΓ= 0.167and pitch angleθ0= 90°is identical to an ellipse of
Γ= 6.0andθ0= 0°. The results show that for the circular cylinder of aspect ratioΓ= 1.0, the pitch angle of course has no effect on
the shedding frequency. For aspect ratioΓ= 1.5and 2.0, the shedding frequency increases for all pitching angles to as high as
f *St = 0.29forΓ= 2.0andθ0= 0°. This case represents an ellipse with its major axis aligned in the streamwise direction, reducing the
frontal area of the cylinder and narrowing the wake. The length scale of the vortex formation is reduced, leading to higher frequency shedding than is the case forΓ= 1.0. The effect increases with aspect ratio to the point that there is no vortex-shedding forΓ≥ 4.0
andθ0≤ 15°.
At the other end, shedding frequencies as low as f *St = 0.16are observed forΓ= 6.0andθ0= 90°. This represents the high aspect
ratio ellipse oriented with its minor axis aligned with the streamwise direction, retaining the frontal area of the circularΓ= 1.0
cylinder. In the near-wake, a larger formation region is present, leading to larger-scale vortex formation and lower shedding frequencies.Fig. 2(b) investigates whether the critical parameter is the width of the geometry with respect to the oncomingflow, by presenting the same data plotted inFig. 2(a), but with the shedding frequencies normalized by the frontal area of the tilted ellipses, Dθ, rather than the ellipse major axis, D. This normalization reduces the range of shedding frequencies significantly for the four
geometries of aspect ratio,Γ> 1.0.
For the following results for flow-induced vibration from pitching ellipses, a constant structural frequency of f *N = 0.20 is
selected, which is near the shedding frequency for theRe=200flow past a stationary cylinder and is also near or within the range of
Table 2
Parameters and results of the four immersed-boundary grids tested for the case ofRe=200,f *D= 0.175,Γ= 4.0andcD MU/ = 0.377.
Grid Δxfine Δ /tU D A *max Pout
G8 D/32 0.0020 1.1590 0.3033
G9 D/64 0.0040 1.2582 0.3542
G10 D/128 0.0020 1.3080 0.3827
G11 D/256 0.0010 1.3251 0.3940
Fig. 2. For stationary cylinders, (a) the variation of vortex shedding frequency,f *St, with pitch angle, θ0, for thefive geometries tested in the aspect ratio range,
Γ
1.0 ≤ ≤ 6.0. For aspect ratiosΓ= 4.0and 6.0, there is no vortex-shedding for pitch anglesθ0= 0°and 15°. Note, that due to the symmetry of the ellipse, thisfigure also encompasses results for aspect ratios in the range,0.167 ≤Γ< 1.0. In (b), the variation of vortex shedding frequency but with the frequencies normalized by the frontal area of the ellipse, rather than the major axis length D.
f *St exhibited by the other ellipses across the θ0range. The natural structural frequency, f *N = 0.20, serves as a starting point for
exploring the parameter space, leaving open the possibility that other behaviours and responses may result from different selected values of f *N.
3.2. Flow-induced heave with active pitching
The results in this section are for cylinders free to heave, according to Eq.(2). An active pitching of amplitudeAθ = /2π and
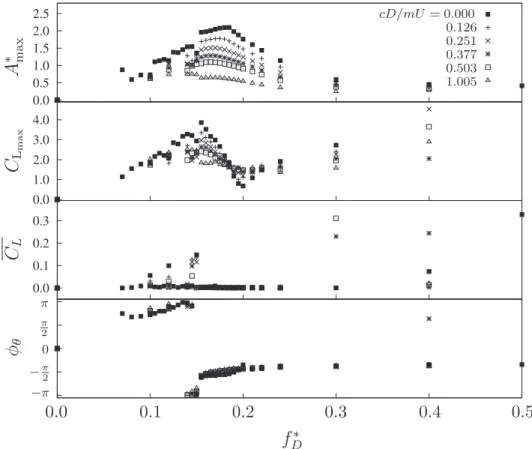
variable frequency is also applied. To begin with, results are shown for undamped configurations, c=0. For aspect ratioΓ= 4.0,Fig. 3
plots, at top, the variation of maximum displacement with driving frequency. Note that some of the simulations produce a non-symmetric heave response, therefore the maximum displacement is calculated as the largest displacement from the mean.
For driving frequencies 0.15 < * < 0.35fD the vortex shedding is synchronized with the driving frequency, while it is
de-synchronized outside of this range. The most distinct variation with driving frequency is the increase in maximum amplitude near
f *D = 0.15. This change in behaviour is also observed in the second panel of thefigure plotting the maximum value of the coefficient
of lift force,CL= 2 /F ρDUy ∞2.CLmax reaches its maximum value near the same driving frequency where the step change in maximum
amplitude is observed. Similarly, in the fourth panel plotting the phase lag,ϕθ, between the heave response of the cylinder to the
pitch oscillation, a step change from a phase lag of approximately ± π to approximately− /2π at the same driving frequencies can be observed, clearly indicating a significant change in dynamic behaviour.
The third panel plots the absolute value of the mean of the lift force,CL; this quantity gives an indication of the mean symmetry of
the flow and the cylinder dynamics. ForCL ≠ 0, the mean flow is non-symmetric around the y-axis. In relation to the driving
frequencies where the large step changes inA *maxandϕθare seen in thefirst and fourth panels, the value ofCLis greater than zero for
isolated cases (forf *D = 0.120and 0.150). This indicates a non-symmetricflow. For the f *D = 0.150case, a small increase in driving
frequency shifts the shedding to a different symmetric mode.
Fig. 4plots the same data shown inFig. 3, but for thefive elliptical cross-sections of aspect ratios,Γ= 1.0, 1.5, 2.0, 4.0 and 6.0. For each of the aspect ratios, the variation of the maximum displacement peaks in the region0.14 ≤ * ≤ 0.20fD . For aspect ratio
Γ= 1.0, the peak displacement occurs for f *D = 0.16. For the elliptical cylinders ofΓ= 1.5, 2.0 and 4.0, the peak shifts to around
f *D = 0.18, while forΓ= 6.0, the peak is at f *D = 0.15. Increasing aspect ratio, even by a small amount, increases the amplitude of
oscillation; the stronger the heave the more potential for extracting energy.
Similar to theΓ= 4.0case, theΓ= 6.0case exhibits a distinct step change inA *max near a driving frequency f *D = 0.150, as does
theΓ= 2.0case, although to a lesser extent, near f *D = 0.180. ForΓ= 2.0, 4.0 and 6.0,CLmax reaches its maximum value near the
same driving frequency where the step change in maximum amplitude is observed. The third panel also shows relatively isolated
Fig. 3. ForRe=200,m* = 5.0andΓ= 4.0, variation with driving frequency,f *D, of, from top, the maximum amplitude of vibration,A *max, maximum coefficient of lift,
cases of asymmetricflow near the transitions observable in the other panels. In the fourth panel plotting the phase lag, ϕθ, the
variations with driving frequency show a general similarity across the aspect ratio range, with the de-synchronized cases off *D ≲ 0.15
trending upwards towards a phase lag of π and then a shift in the synchronized region to a phase lag of− /2π .Nazarinia et al. (2009)
investigated the vortex shedding downstream of a circular cylinder with prescribed rotation and transverse oscillation, atRe=1322
(experimental) and 225 (numerical), varying the phase difference between the two oscillations. In contrast to the results ofFig. 4, a desynchronized region, characterized by quasi-periodic and chaotic vortex-shedding, was observed for phase differences in the approximate range−3 /4 ≤π ϕ≤ − /4π . Results outside of this range, including the whole positive side of the phase difference range, exhibited locked vortex-shedding. Theflow field of a locked case from the work ofNazarinia et al. (2009)(their Fig. 4b) bears strong similarity to a locked case from the current work for aspect ratioΓ= 1.0(see the second case ofFig. 6). However, the current results show desynchronized vortex-shedding over a positive phase lag range, and locked vortex-shedding over a negative. In terms of phase, the two sets of results do not match up well, but there are key differences in configurations to be considered. Firstly, the amplitude of rotational oscillation in the current work is 1.5 times greater than inNazarinia et al. (2009), which will significantly affect the vorticity generation on the cylinder. Furthermore, in the current work the prescribed transverse oscillation is replaced with a passive heave. Also, the results ofNazarinia et al. (2009)are for oscillation frequencies equal to the Strouhal frequency; they also found that small shifts in the driving frequency away from the Strouhal frequency could shift the boundaries between locked and unlocked shedding cases. In the current work, we see unlocked shedding for positive phase lags for driving frequencies of a half or three quarters of the Strouhal and structural frequencies, so different behaviour should be expected. The key point is that the wakes of the locked cases forΓ= 1.0are qualitatively similar, even though there may be differences in phase between the pitching and heaving and in the frequencies of the systems.
Clearly, there are several modes of vibration present in the limited parameter space plotted inFig. 4. For the section of the parameter space corresponding to aspect ratios1.0 ≤Γ≤ 6.0 and driving frequencies 0.11 ≤ * ≤ 0.20fD ,Fig. 5 plots contours of
spanwise vorticity for each case, at intervals of0.01 *fD. The focus is on this part of the parameter space as it encompasses the
high-amplitude oscillation synchronized regime – of most interest for power extraction – and also the distinct variations with driving frequency observed inFigs. 3 and 4. Each vorticityfield inFig. 5is plotted at the point of maximum heave. The aspect ratio increases from left, Γ= 1.0, to right Γ= 6.0, and the driving frequency increases from bottom, f *D = 0.11, to top, f *D = 0.20. The figure
encompasses several changes in behaviour; however broadly speaking, at the lower end of the driving frequency range presented, the vortex-shedding is disordered and unsynchronized with the driving frequency. Cross-referencing withFig. 4, these cases exhibit smaller heave responses than for the synchronized cases. For the cases ofΓ> 1.0, the variation with driving frequency of the phase lag between the heave response and the pitching actuation can be observed in the orientation of the cylinder at its peak heave. For the desynchronized cases, the ellipses, at maximum heave, are oriented with their minor axes aligned with the streamwise direction, while for the larger amplitude synchronized oscillations, the ellipses are oriented with the major axis aligned with theflow.
Fig. 4. ForRe=200,m* = 5.0and1.0 ≤Γ≤ 6.0, variation with driving frequency,f *D, of, from top, the maximum amplitude of vibration,A *max, maximum coefficient
There are several modes of oscillation and vortex shedding, and an attempt has been made to categorize them onFig. 5using seven separate labels, each label describing the quantity of vortex pairs (P's) and single vortices (S's) shed each cycle of the pitching oscillation, following the original naming scheme devised byWilliamson and Roshko (1988).Fig. 6presents examples of each of the modes. The label D mode refers to cases where the vortex shedding is not synchronized, or desynchronized, with the driving frequency,f *D. In the example of the D mode inFig. 6, there is no clear regular arrangement of the vortices evident in the vorticity contours. This disorder is reflected in the time series of the lift coefficient and the cylinder displacement. The frequency spectrum shows many peaks besides the primary frequency of f f/D = 1. For these desynchronized cases, these appear for driving frequencies
less thanf *D ≃ 0.15, the frequency associated with the elastic structure, f *N, plays a role. In the case shown inFig. 6, for aspect ratio
Γ= 1.0and driving frequencyf *D = 0.13, the structural frequency is equal to1.538 *fD. For this case – and for other D mode shedding
cases – the frequency spectra reveal peaks at the structural frequency, f=fN, and the driving frequency, f=fD, but also at
f=fN + (fN−fD). Such combinations imply some frequency modulation of the body oscillation (and presumably the vortex
shedding) at f *N by the rotational oscillation at f *D(Chowning, 1973). This is similar to the frequency modulation observed in the wakes of streamwise oscillating cylinders in a free stream, where vortex shedding at one frequency is modulated by the driving frequency (Leontini et al., 2011, 2013).
For all the aspect ratios, for f *D < 0.14, desynchronized vortex-shedding is observed. Asf *Dincreases, for all aspect ratios, ordered
vortex-shedding modes appear. For the aspect ratio,Γ= 1.0, case, a 2S mode emerges, characterized by two single vortices of
opposite sign shed each cycle of the pitching oscillation. In the example ofFig. 6, the ordered vortex-shedding can be observed in the times series and the frequency spectrum. The spectrum reveals peaks at the driving frequency, f *D, as well as monotonically decreasing peaks at the 3rd, 5th and 7th harmonics of the driving frequency. This arrangement of peaks is indicative of the spatio-temporal symmetry of thisflow, at least in the near wake – only odd harmonics maintain this symmetry. Advanced one half-cycle, reflected around the x-axis, with the sign of the vorticity reversed, the vorticity topology would be essentially identical. The 2S mode only appears for the aspect ratio,Γ= 1.0, 1.5 and 2.0 geometries. For the cases of the mode forΓ= 1.5and 2.0, theflow is close to
Fig. 6. Further details of each of the oscillation modes identified inFig. 5, presenting at left contours of spanwise vorticity (−1 ≤ωz ≤ 1
D
U ), in the middle, plots of the
time signal of cylinder displacement and lift coefficient and at right, frequency spectra of the lift signal, normalized by the peak power. The dotted vertical line on the frequency spectra corresponds tof=fN.
transitioning to the 2P mode.
The 2P mode is similar to the 2S mode, but involves a tendril of the opposite sign vorticity joining the single vortex of the 2S mode and then rolling up to form the other half of a vortex pair. In the example ofFig. 6, the frequency spectra is similar to the spectra of the 2S mode, retaining the spatio-temporal symmetry, but with greater relative energy in the 3rd and 5th harmonics of the driving frequency.
For the geometries of aspect ratioΓ= 2.0, 4.0 and 6.0, as the driving frequency is reduced fromf *D = 0.20, where the 2P mode is
present, the amplitude of oscillation increases. The two modes which appear, the2(2 )P and2(4 )P modes, are large amplitude types of the 2P, retaining the same spatio-temporal symmetry. The extra vortices present in the wake are formed via an instability of the shear layers that are shed from the body.
The large vertical motion of the ellipse, with its major axis essentially aligned with this vertical motion, creates two shear layers with an increasing cross-stream orientation as the amplitude increases – essentially a vertical wake. As the amplitude of oscillation increases, the velocity of the cylinder increases, which in turn results in a narrower vertical wake. This vertical wake is susceptible to the same classic Kármán instability as any bluff-body wake, and it could roll up into a series of vortices behind the main vortex pair. There will be a critical vertical velocity for the onset of the Kármán instability, and further increases of the velocity beyond this will also influence the frequency, and wavelength, of the instability.
For the 2(2P) mode a single extra vortex pair (with respect to the 2P mode) is created per half cycle, while for the 2(4P) mode, three extra pairs are created. An examination of the 2(4P) mode is presented inFig. 7. Each half cycle, four vortex pairs are shed. In thefirst panel of Fig. 7, the trailing edge vortex on the y< 0side is labelled TEP−. This pair forms when the ellipse reaches its minimum heave and the rotation of the ellipse is such that the major axis is aligned in the streamwise direction. On they> 0, the opposite sign TEP+ vortex pair can be seen forming. In the wake of each of these pairs, the two shear layers form a vertical
Kármán street, which exhibits three distinct roll-ups. Thefirst pair (labelled P1inFig. 7) is also reinforced by a vortex formation
from the leading edge as the body sweeps from an essentially horizontal configuration at maximum displacement to a vertical configuration near zero displacement. Due to the complexity of the vorticity topology, some of the pairs are not as distinct as others; the vorticity of one sign of a pair dissipates, is destroyed, or interacts with another pair. The key point here is that the vorticity created on the cylinder surface rolls into distinct vortices and vortex pairs both in the cylinder wake and on the cylinder surface. In this way, the 2(4P) mode is similar to the 2P and 2(2P) modes in terms of vortex generation from the cylinder, differing principally in the vortex dynamics away from the cylinder. The frequency spectrum of the lift coefficient for the example of mode 2(4P) shows a strong peak on the 7th harmonic of the driving frequency, which reflects the multiple vortex pair formation each half cycle.
This appears to be related to the frequency of the instability of the vertical wake, and the symmetry of theflow. A whole number of wavelengths or vortex pairs shed per half cycle, combined with the main vortex, or pair of vortices, shed at the end of the half cycle will maintain the spatio-temporal symmetry of theflow. Adding one pair of vortices per half cycle will see one-and-a-half shedding “events” per half cycle, and three events per cycle – therefore a significant frequency component at the third harmonic. Adding two pairs seesfive vortices per half cycle, and a contribution at the fifth harmonic. Adding three pairs sees seven vortices per half cycle and a contribution at the seventh harmonic, as observed for the 2(4P) wake and confirmed from observation of the spectrum of the lift force for this case inFig. 6.
This vertical wake shedding also plays a role in determining the amplitude. Since the preferred modes see a whole number of vortex shedding cycles in the vertical wake, the amplitude needs to adjust to allow this to occur. This adjustment changes the number of shedding cycles in two ways. First, the larger amplitude provides more space tofit vortex pairs. Second, the increase in amplitude implies an increase in the cylinder velocity, which sees a decrease in the vertical wake width. This decrease in wake width sees a decrease in the vortex shedding wavelength (coupled with an increase in frequency), hence increasing the number of vortex pairs in a given length. Theflow adjusts to set the amplitude close to an integer multiple of this vortex shedding wavelength.
As well as this vertical vortex shedding, the wake configuration is set by whether or not a pair or a single vortex is shed when the amplitude is maximum. This change is related to a change in phase between the rotation and heaveϕθ, which causes a change in the
mechanism of vortex formation. The cases atΓ= 6.0, f *D = 0.140(2( + )S P) andΓ= 6.0, f *D = 0.150(2(4 )P) illustrate these two
mechanisms.
These two cases sit either side of the large step change in maximum cylinder displacement observed forΓ= 6.0inFig. 4. The mode at f *D = 0.140is differentiated from the similarly named2( + )P S mode because of its distinct vortex formation mechanism at
the top of its travel related to its rotational phase.
The case at f *D = 0.140has a phaseϕθ ≃ /2π , as shown inFig. 4. This means that the ellipse is essentially pointing straight up and
down at the top of the motion, as shown inFig. 6. As the ellipse approaches the top of its travel it decelerates, and the negative vorticity in the shear layer on the back of the body is carried off by inertia and rolls up into a single vortex. This is the first mechanism of vortex formation. As the ellipse moves down towards the centre it also rotates, and the sweeping motion of the leading edge forms a positive vortex, which peels off a negative vortex from the shear layer now forming on the front of the body, hence forming a pair. This same process is repeated in the next half cycle.
The case at f *D = 0.150has a phaseϕθ ≃ − /2π , as shown inFig. 4. This means the ellipse is essentially pointing straight into the
flow at the top of the motion, as shown inFig. 6. As the ellipse approaches the top of its travel, it rotates from pointing straight up and down, and effectively “flicks” a negative-signed vortex from the trailing edge of the ellipse. This rotation also forms positive vorticity on the top side of the ellipse, which the newly formed negative vortex peels off, forming a vortex pair. This is the second mechanism of vortex formation. As the ellipse moves down towards the centre, it forms the essentially vertical wake that can break into subsequent vortex pairs due to the Kármán instability, in this case seeing three wavelengths, and three vortex pairs formed in the travel from top to bottom. This process is then repeated in the next half cycle. This complicated case is further illustrated in
Fig. 7.
The other mode categorized inFig. 5, the P+2S mode, is an example of synchronized asymmetric shedding. This mode exists at the transition between the desynchronized modes of the cases of lower driving frequencies and the spatio-temporally symmetric 2P and related modes (note that theflow forΓ= 6.0and f *D = 0.135is also of the P+2S mode, but is not shown inFig. 5. Thefield is
qualitatively similar to theflow forΓ= 4.0andf *D = 0.150, but biased in the opposite direction in y). The mode is synchronized with
Fig. 8. For the case of aspect ratioΓ= 1.5fromFig. 4, at left, a snapshot of vorticity near maximum positive displacement, with the ellipse aligned with theflow. At right, the same view of theflow, shifted in time half a period, reflected around the y-axis and the sign of vorticity reversed.
the driving frequency, yet has non-zero mean lift. This bias to one side is unusual, given the symmetry of the geometry and motion. A similar phenomenon has been observed for the vortex-sheddingflow past square cylinders (Sheard et al., 2009) and also in the onset of P+S wakes in theflow past oscillating circular cylinders (Leontini et al., 2006, 2007). This asymmetric phenomenon is illustrated inFig. 8, forΓ= 1.5andf *D = 0.18, which shows a closeup of the vorticity in the near wake region at the instant where the elliptical
body is aligned with the oncomingflow, shortly after the snapshot at maximum displacement shown inFig. 6for the same case. The second image is of the same snapshot half a period later, with the flow reflected about the y-axis and the sign of the vorticity reversed. In aflow with complete spatio-temporal symmetry around the centreline, the images would be identical. In the case shown here, on one side of the oscillation, the formation of the vortex is cut by the trailing edge of the ellipse, while on the other, a larger vortex forms. It was noted inSheard et al. (2009), as well as inSohankar et al. (1999), that the asymmetry occurs in two-dimensional flows above the critical Reynolds number for absolute stability to spanwise perturbations and that the phenomenon does not persist in fully three-dimensional simulations. The appearance of the asymmetry suggests the two-dimensionalflow may alter significantly when simulated in three-dimensions. The persistence of thefindings in this study, and similar ones, to three-dimensional flows is a possible area of further interest, particularly as much of the literature on flapping aerofoil power generation to date has not considered three-dimensional effects.
The mode that generally exhibits the greatest cylinder oscillation amplitude and velocity is the 2(P+2S) mode. A greater heave indicates the potential for power extraction. However, the actuation of the pitching motion requires energy input. Although higher aspect ratio ellipses produce greater heave, as shown inFig. 4, the increasing alignment of the surface of the ellipse normal to the tangential direction of the pitch, leads to an increasing pressure component to the torque applied by thefluid on the body. This increased resistance needs to be overcome, proving a negative energy input to anyfinal net power output, meaning this rotational actuation power input,Pin, needs to be considered.
3.3. Calculation ofPin
To rotationally oscillate the cylinder in the fluid, an input power is required, which will reduce the efficiency of any energy extraction from the heave. Therefore, some consideration of its variation and magnitude is needed. The equation of motion for the cylinder rotation is given by
τ=Iα (3)
where τ is the torque, I is the rotational moment of inertia and α is the rotational acceleration. The total torque is the sum of the torque needed to drive the oscillation, τd, and the torque that the fluid exerts on the cylinder, τf. Multiplying through by the
rotational velocity, ω, Eq.(3)can be cast as a balance of power, such that
τ ωd +τ ωf =Iαω (4)
In this way, the work done by any external control such as a motor over one oscillation cycle to rotate the cylinder is given by
∫
τ ω dt, t t t t T d = = + 0 0 (5) and the (rotational) work done by thefluid on the cylinder over one oscillation cycle is given by∫
τ ω dt. t t t t T f = = + 0 0 (6)I α, and ω are known or prescribed, so an expression for the instantaneous power needed to rotate the cylinder is
Pin=τ ωd =Iαω−τ ωf . (7)
The mean power input over an oscillation cycle is given by
∫
P T P dt = 1 . t t t t T in = = + in 0 0 (8) Dimensional input and output power terms (which are per unit of spanwise length), when expressed in this study, are assumed non-dimensionalized byρU D3 .The instantaneous torque on the cylinder exerted by thefluid can be calculated by integrating the product of the surface stress component normal to the vector from the axis of rotation and the length of this vector over the surface of the cylinder, i.e.,
∫
στf = ·((^ × )/|(^ × )|)| |r k r k r ds, S
! !
(9) where σ is thefluid stress vector from pressure (acting normally) and the traction vector from shear stress, S is the surface of the cylinder and r is the vector from the axis of rotation to the cylinder surface, andk!is the unit vector aligned with the axis of rotation. For aspect ratio Γ= 1.0, the only torque exerted by the fluid on the circular cylinder comes from the fluid viscosity, which generally acts in the opposite direction to the rotation. The entire surface of the circular cylinder is arrayed tangentially to the rotation, so there is no pressure component to fluid torque, τf. The amplitude of the oscillation is constant, so as the driving
efficiency of the power extraction. However, the behaviour does not hold for higher aspect ratios. As aspect ratio increases from
Γ= 1.0, the elliptical surface is increasingly perpendicular to the direction of the rotation, leading to the growth of the pressure component contribution to τf. What does this mean for anyfinal sum of extracted energy?
3.3.1. Consideration of energy extraction scenarios affectingPin
A representative case is chosen fromFig. 4, forΓ= 4.0and f *D = 0.180, which returns mean power inputPin= 0.156.Fig. 9(a)
plots the variation ofPin over two oscillation cycles. From the plot, the positive value ofPin is apparent; however, the sign ofPin
changes several times during each cycle; sometimes extra power is needed to drive the cylinder, sometimes power needs to be extracted or absorbed to resist the acceleration coming from thefluid. But to have the value ofPin= 0.156included in the final
calculation of the efficiency of energy extraction from the heave, assumes that the energy absorbed during those parts of the cycle where thefluid is acting to accelerate the rotation of the cylinder beyond its prescribed path, is fully collected. This is a best case scenario. In an application of the energy-harvesting method presented in this paper, the driving mechanism will have its own efficiency. Investigating the efficiency of a driving mechanism is beyond the scope of the current paper. However, the following results are included to give an understanding of the effect on net power of different input power scenarios. The three input power scenarios presented effectively cover a range of input power efficiencies.
Fig. 9(b) plots the same variation as in (a), only with the negative parts of the series set to zero,Pin1. This imagines a scenario
where energy is supplied to drive the cylinder, but the work done by thefluid on the cylinder is dissipated by the structure, not collected and not included in thefinal calculation of total power. For this variation,Pin, is greater, with a value of 0.235.Fig. 9(c) plots
the absolute value of the variation ofFig. 9(a),Pin2. This is a worst case scenario, where energy is spent accelerating the rotation, but
also spent in braking. Clearly, this is more expensive again, giving aPinof 0.313. For aspect ratioΓ= 4.0, the variation ofPinwithf *D
for the three scenarios plotted inFigs. 9(a), (b) and (c), is shown inFig. 9(d), illustrating the range of possible values ofPin.
In the following section, the variation of the mean power extracted from the heave,Pout, is explored independently ofPin; following
that, the importance ofPinto the optimal cases forPoutwill be considered, accounting for the three possible scenarios outlined above.
3.4. Damping to include energy extraction from the heave in the model
To simulate power extraction from the cylinder heave, a linear damping term,c, is applied to Eq.(2). The instantaneous power extracted from the heave is given as
Pout= ˙ ,cY2 (10)
whereY˙ is the velocity of the cylinder transverse to the oncomingflow. The average power output is given by
∫
P T P dt = 1 . t t t t T out = = + out 0 0 (11) Again, the power term per unit of spanwise length is non-dimensionalized byρU D3 . The power output scales with the damping,c, however the higher the damping the stronger the effect of the second term of Eq.(2). The damping increases the resistance to motion, reducing the magnitude ofY˙and ofPin. Thus power extraction affects the motion of the cylinder and thereby the flow. Thisinteraction means that an optimal damping term for power extraction will exist for each aspect ratio.
Fig. 10plots the same scalars as for the undamped cases presented inFig. 4, but for theΓ= 4.0case for various values of the damping, as a function of the driving frequency f *D. Thefirst feature that is most apparent is that the overall behaviour of the system is quite similar for all the values of damping, with only an apparent scaling of the amplitude. As the damping is increased from
Fig. 9. For the case of aspect ratioΓ= 4.0, c=0.0 andf *D= 0.180, the variation with time of input power with (a) complete rotational energy extraction,Pin, (b) no
c= 0.0, the amplitude of oscillation decreases monotonically across the range of driving frequency. This reflects the increasing effect of the( / ) ˙c M Y term in the harmonic oscillation described by Eq.(2).
The two branches of the amplitude response tied to the phase between the controlled pitching and the heaving motion (which is
Fig. 10. ForRe=200,m* = 5.0andΓ= 4.0, variation with driving frequency, f *D, of, from the top, the maximum amplitude of vibration,A *max, the maximum lift coefficient,CLmax, the absolute value of the mean lift,CL, and the phase lag between the rotation and the heave,ϕθ, across a range of damping coefficients,cD mU/ .
Fig. 11. Contour maps of mean output power,Pout, for aspect ratios,Γ= 1.0, 1.5, 2.0, 4.0 and 6.0, over the driving frequency,f *D, normalized damping coefficient,
also related to a change in main vortex production mechanism as explained inSection 3.2) still exist. The asymmetric modes, apparent due to a non-zero mean lift, are also recovered at low driving frequencies.
A focus of this study is the impact this damping has on the power extracted from theflow, and therefore the energy harvesting potential. For the zero damping set of results, the mean power output,Pout, calculated using Eq.(10), is zero. As damping increases,
Poutinitially increases, but the velocity of the cross-stream oscillation is also reduced. This will eventually reduce the power extracted. Thus an optimal damping occurs for power output. For the cases shown inFig. 10, of aspect ratioΓ= 4.0, the optimal configuration is for a dampingcD mU/ = 0.377and driving frequency f *D = 0.175, producing a mean power output ofPout= 0.354.
For all of the aspect ratios tested,Fig. 11presents contour maps of mean power output, as function of both driving frequency,f *D, and the damping coefficient,cD mU/ , for the aspect ratios,Γ= 1.0, 1.5, 2.0, 4.0 and 6.0. The axis ranges and contour scale are constant across thefive plots. The limiting case f *D = 0.00represents the case with no rotational forcing. The plots show that across
the geometries an increase in power output from the unforced case is possible. For thefive geometries, the cases of maximum power output are grouped mostly around a driving frequency off *D = 0.180, with the exception of theΓ= 1.0case, where the optimal case is
at f *D = 0.150. All these driving frequencies for optimal power output are less than the natural structural frequency of the system,
f *N = 0.20.
With the darkening colour contours with aspect ratio, an increase in the magnitude of power output with aspect ratio is apparent. The sharpest change in behaviour is from the circular cylinder of aspect ratio,Γ= 1.0, to the higher aspect ratio cases.Fig. 12(a) plots the variation of the different formulations of the input power, discussed inSection 3.3.1,Pin,Pin1andPin2across the optimal
cases for thefive aspect ratios tested.
Interestingly, for the non-idealizedPinscenarios, the lower aspect ratio optimal cases perform poorly, the required input power
increasing markedly for thePin formulations ofFigs. 9(b) and (c). For the case of aspect ratioΓ= 6.0, the worst case scenario for input power requires a mean input power of more than half of the mean output power. This power input constitutes a significant effect on the net power output, illustrating the importance of optimizing the actuation mechanism for the cylinder rotation.
Fig. 12(b) plots the net power (Pout−Pin) for the three different mean power input formulations. The highest values forPnetare for the
higher aspect ratio cases with marginal differences between the geometries ofΓ= 4.0and 6.0.
The effect on net power output of the different scenarios of mean input power calculation is presented inFig. 13. For theΓ= 4.0
geometry, the contour maps show the results for Pout alone,Pout−Pin,Pout−Pin1 andPout−Pin2. The net power output reduces as
expected with the inclusion of the input power, but the location in the parameter space of the optimal cases does not significantly shift. This is to be expected given,firstly, the third panel ofFig. 10, which plots the variation with driving frequency of thePinfor a
range of damping values. The plot shows that as the damping increases, for a given driving frequency, the variation of the input power is strongly asymptotic. Secondly,Fig. 9(b), plotting the variation ofPin,Pin1andPin2with driving frequency forΓ= 4.0, shows
that the differences between the three input power scenarios described are near invariant with driving frequency. Thus, the variations in the contour maps ofFig. 13consist largely in the contour levels, with little variation with driving frequency or damping. To relate theflows for optimal power output to the undamped flows of maximum oscillation velocity,Fig. 14plots the vorticity fields for each case of maximum power output fromFig. 11, with the cylinder in each case at maximum displacement. For all aspect ratios, the case of optimal power output exhibits the 2S mode of vortex shedding. However, thefields for aspect ratiosΓ= 2.0, 4.0 and 6.0 are showing signs of transitioning to a 2P mode, with a tendril of opposite sign vorticity trailing each single vortex, but not yet forming a distinct vortex to complete the pair of the 2P mode. Also, the more complicated vortex wakes such as the 2(P+S) and 2(P+2S) modes are not recovered; the peaks of the frequency spectra decrease monotonically on the 3rd, 5th and 7th harmonics. The optimal flows exhibit the same, or nearly the same, driving frequencies as for the undamped cases of maximum oscillation amplitude.
Generally, the damping seems to only limit the oscillation amplitude of the body. This limitation in the amplitude also restricts the wake modes observed, as the more complicated patterns are formed by theflow trying to “lock” a whole number of vortex pairs
Fig. 12. For the optimal power output cases ofFig. 11. (a) The variation with aspect ratio ofPin,Pin1andPin2and (b) the variation ofPnetcalculated using the three different mean power input formulations.
into one oscillation half cycle – lower amplitude mean less pairs, and therefore simpler vortex wakes. The flows of the optimal cases seem to be lower amplitude variants of the undamped cases. A useful comparison could be made with the undamped cases exhibiting the same amplitude oscillation amplitude, but at different frequency.
4. Conclusions
The large parameter space covering theflow past elastically mounted rotationally oscillating elliptical bluff bodies reveals a rich range offlow phenomena, such as the complex shedding and vortex roll-ups seen in the flow past undamped high-aspect ratio ellipses. As aspect ratio is increased from the circular cylinder to the ellipse, converging towards aflat plate, the amplitude and velocity of the cross-stream oscillation increases significantly. It was shown that for the class of problem investigated here, what begins as a typical vortex-shedding wake for the circular cylinder,Γ= 1.0, transitions quickly to a more complexfield at higher aspect ratio, with essentially a vertical wake aligned laterally to the oncomingflow rolling up and shedding at higher frequency than the rotation driving frequency. Also analysed was the input power for the actuation of the cylinder rotation; it was shown that the cylinder rotation requires a torque working both with and against the torque exerted by thefluid on the body at different periods of the cycle. Therefore, the efficiency of any power output from energy harvesters should be considered against the accelerating and decelerating mechanisms of the rotational actuation.
Power output was modelled as a damping on the velocity of the cross-stream oscillation, producing optimal cases of damping and driving frequency. The frequencies of the optimal cases for power output corresponded closely with the frequencies of the maximum amplitude undamped cases, theflows exhibiting similarities, except for the case of aspect ratio,Γ= 1.5.
The number of parameters available to test for a theoreticalflapping foil energy harvester is extremely large and only a small portion of the potential parameter space has been explored in the current paper. Many similar studies use a NACA aerofoil geometry, rather than the ellipses of the current study. Although the current studyfind a convergence with increasing thinness (or aspect ratio) of the cylinder, many aerofoils more naturally rotate around a pitching axis near their centre of mass, generally around a third of a chord downstream of the leading edge. The effect of pitching axis has not been examined here. Including another cylinder geometry, such as a NACA aerofoil of aspect ratio 4 or 6 would also yield interesting comparisons.
Also of interest is the extension to three dimensions. Whether the addition of oscillatory pitching and/or passive heave will make theflow less or more unstable to three-dimensional modes is not clear. While the added energy from the cylinder pitch could make theflow more unstable, there exists in the literature examples of body motion or oscillation having a stabilizing effect for three-dimensional stability of bluff-body flows, most notably Lo Jacono et al. (2010), who found that rotationally oscillating a circular cylinder in a freestream damped the three-dimensional instability modes usually observed. For the higher aspect ratio cases presented in the current work, it is possible that they are unstable to three-dimensional perturbation, although this would have to be tested. Future study could analyse the stability of the two-dimensionalflows, as well as simulate the flows in three dimensions, both with infinite spanwise cylinder length and a finite spanwise aspect ratio.
Fig. 13. For aspect ratio,Γ= 4.0, contour maps of (a) output power,Pout, (b) output power minus input power,Pout−Pin, (c) output power minus input power with
no rotational energy-harvesting,Pout−Pin1, and (d) output power minus input power with braking energy,Pout−Pin2. Axis ranges and contour scales are constant
Acknowledgements
This work wasfinancially supported by the Australian Research Council (ARC) through the Discovery Projects scheme under grant DP150103177. The computational resources used for this study include those at the National Computational Infrastructure (NCI) under project IZ4 using time allocated under the National Computational Infrastructure Merit Allocation Scheme (NCMAS) and those at Swinburne University of Technology's Centre for Astrophysics and Supercomputing.
References
Betz, A., 1966. Introduction to the Theory of Flow Machines. Pergamon, Oxford.
Chowning, J.M., 1973. The synthesis of complex audio spectra by means of frequency modulation. J. Audio Eng. Soc. 21 (7), 526–537.
Fig. 14. For each aspect ratio, the vorticityfields at the moment of maximum body displacement for the optimal cases taken fromFig. 11. The time signals of the lift force and the cylinder displacement are plotted. At right, the frequency spectra of the lift signal are plotted, with the frequency normalized by the driving frequency,
Deng, J., Teng, L., Pan, D., Shao, X., 2015. Inertial effects of the semi-passive flapping foil on its energy extraction efficiency. Phys. Fluids 27 (5), 3103.
Griffith, M.D., Leontini, J.S., Thompson, M.C., Hourigan, K., 2011. Vortex shedding and three-dimensional behaviour of flow past a cylinder confined in a channel. J. Fluids Struct. 27, 855–860.
Hoke, C.M., Young, J., Lai, J.C.S., 2015. Effects of time-varying camber deformation on flapping foil propulsion and power extraction. J. Fluids Struct. 56, 152–176.
Kinsey, T., Dumas, G., 2008. Parametric study of an oscillating airfoil in a power-extraction regime. AIAA J. 46, 1318–1330.
Leontini, J.S., Lo Jacono, D., Thompson, M.C., 2011. A numerical study of an inline oscillating cylinder in a free stream. J. Fluid Mech. 688, 551–568.
Leontini, J.S., Lo Jacono, D., Thompson, M.C., 2013. Wake states and frequency selection of a streamwise oscillating cylinder. J. Fluid Mech. 730, 162–192.
Leontini, J.S., Thompson, M.C., Hourigan, K., 2006. The beginning of branching behaviour of vortex-induced vibration during two-dimensionalflow. J. Fluids Struct. 22, 857–864.
Leontini, J.S., Thompson, M.C., Hourigan, K., 2007. Three-dimensional transition in the wake of a transversely oscillating cylinder. J. Fluid Mech. 577, 79–104.
Lo Jacono, D., Leontini, J.S., Thompson, M.C., Sheridan, J., 2010. Modification of three-dimensional transition in the wake of a rotationally oscillating cylinder. J. Fluid Mech. 643, 349–362.
Mittal, R., Dong, H., Bozkurttas, M., Najjar, F.M., Vargas, A., von Loebbecke, A., 2008. A versatile sharp interface immersed boundary method for incompressible flows with complex boundaries. J. Comput. Phys. 227, 4825–4852.
Nazarinia, M., Jacono, D.L., Thompson, M.C., Sheridan, J., 2009. Flow behind a cylinder forced by a combination of oscillatory translational and rotational motions. Phys. Fluids 21 (5), 051701.
Newmark, N.M., 1959. A method of computation for structural dynamics. J. Eng. Mech. 85 (3), 67–94.
Sheard, G.J., Fitzgerald, M.J., Ryan, K., 2009. Cylinders with square cross-section: wake instabilities with incidence angle variation. J. Fluid Mech. 630, 43–69.
Sohankar, A., Norberg, C., Davidson, L., 1999. Simulation of three-dimensionalflow around a square cylinder at moderate Reynolds numbers. Phys. Fluids 11 (2), 288–306.
Tian, F.-B., Young, J., Lai, J.C., 2014. Improving power-extraction efficiency of a flapping plate: from passive deformation to active control. J. Fluids Struct. 51, 384–392.
Williamson, C.H.K., Roshko, A., 1988. Vortex formation in the wake of an oscillating cylinder. J. Fluids Struct. 2, 355–381.
Wu, J., Shu, C., Zhao, N., Tian, F.B., 2015a. Numerical study on the power extraction performance of aflapping foil with a flexible tail. Phys. Fluids 27 (1), 3602.
Wu, J., Wu, J., Tian, F.-B., Zhao, N., Li, Y.-D., 2015b. How aflexible tail improves the power extraction efficiency of a semi-activated flapping foil system: a numerical study. J. Fluids Struct. 54, 886–899.
Xiao, Q., Zhu, Q., 2014. A review onflow energy harvesters based on flapping foils. J. Fluids Struct. 46, 174–191.
Young, J., Lai, J.C., Platzer, M.F., 2014. A review of progress and challenges inflapping foil power generation. Prog. Aerosp. Sci. 67, 2–28.