HAL Id: cea-02339076
https://hal-cea.archives-ouvertes.fr/cea-02339076
Submitted on 13 Dec 2019
HAL is a multi-disciplinary open access
archive for the deposit and dissemination of
sci-entific research documents, whether they are
pub-lished or not. The documents may come from
teaching and research institutions in France or
abroad, or from public or private research centers.
L’archive ouverte pluridisciplinaire HAL, est
destinée au dépôt et à la diffusion de documents
scientifiques de niveau recherche, publiés ou non,
émanant des établissements d’enseignement et de
recherche français ou étrangers, des laboratoires
publics ou privés.
Plutonium mass content accurate determination by
controlled potential coulometry at CETAMA
S. Picart, Y. Davrain, M. Crozet, D. Roudil
To cite this version:
S. Picart, Y. Davrain, M. Crozet, D. Roudil. Plutonium mass content accurate determination by
controlled potential coulometry at CETAMA. Plutonium Futures - The Science 2018, Sep 2018, San
Diego, United States. �cea-02339076�
Plutonium mass content accurate determination by controlled potential coulometry at CETAMA. Sébastien Picart,* Ygor Davrain*, Marielle Crozet*, Danièle Roudil*
* CEA, Nuclear Energy Division, Research Department on Mining and Fuel Recycling Processes, CETAMA, F-30207 Bagnols-sur-Cèze, [email protected]
INTRODUCTION
Controlled-potential coulometry is a method of choice for determining plutonium in solution because it is not related to chemical standards but only to physical parameters such as time and current which can be calibrated very accurately.
The method is thus called a “primary” method and is of great interest for metrology laboratories providing certified reference materials of plutonium. Indeed, it allows to attain high trueness with bias close or below 0.1% on low sample amounts, typically a few milligrams of matter.
But, coulometry of high degree of accuracy is still a difficult exercise because every step of the procedure, from sample preparation to the signal integration has to be carefully controlled and optimized.
This paper describes the key points of the method and emphasizes on uncertainty budget calculations. This approach will allow us to think over the method and adapt the procedure in order to improve trueness and repeatability for plutonium alone but also to cope with measurement of plutonium in presence of uranium.
Principle of coulometry
Coulometry is an analytical technique based on the measurement of a quantity of electricity Q involved in a electrochemical transformation (during either oxidation of reduction) and is governed by the Faraday’s law which links the quantity of electricity with the quantity of element in solution:
m=Q M/(nF)
with m, the mass of the element in g; M, the molar mass of the element (M=239,076 g/mol for our plutonium sample), n the number of electrons exchanged during transformation (n=1 in the case of the Pu(IV)/Pu(III) couple; F, the constant of Faraday (96485,34 C/mol).
The quantity of electricity is measured by the integration of the current flowing during transformation. For a selective reaction, it is necessary to control the potentials applied by the utilization of a potentiostat and a three electrodes set-up. The working electrode material and the medium are carefully chosen to minimize interferences. In the case of plutonium, a gold electrode and a 0.9 molar nitric acid electrolyte are recommended1.
Description of the protocol
The experimental protocol is inspired from the ISO 12183 norm2 and from literature1,3,4.
Samples are first weighed by an analytical scale and then fumed to dryness with sulfuric acid. The aim of this operation is to stabilize the plutonium in the form of crystals of Pu(IV) sulphate and to eliminate chloride, fluoride, nitrogen and volatile organic compounds. Above all, those salts can be redissolved easily in molar nitric acid5,6 prior to analysis.
A calibration of the analog-to-digital converter used for current integration is performed initially by a high precision current calibrator and correction is applied to the reading of integrated current.
The blank is preliminary measured and corresponds to the reduction of the 0.9 molar nitric acid supporting electrolyte (with a small quantity of sulfamic acida) followed by its oxidation. The raw quantity of electricity of the blank, Q1, is recorded during oxidation as well as the
residual current, ir1 and duration of oxidation t1. Stopping
criteria, for both reduction and oxidation steps, are a stable current of a few µA with a drift less than 1 µA in 100 s. The potentials applied are the same that the one used for the titration of plutonium.
The dried test sample is dissolved in the supporting electrolyte used for blank measurement.
The Pu(IV) in the test sample is reduced to Pu(III) at a controlled potential more negative than the formal redox potential of the Pu(IV)/Pu(III) redox pair, E°’. The shift of potential is limited at 230 mV which ensures almost complete transformation at equilibrium (close to 99.99%) and avoids reaction of interfering species.
The Pu(III) is finally oxidized in return to Pu(IV) at a potential more positive of 230 mV than the formal potential. Current is integrated during oxidation till the achievement of the stopping criteria mentioned above. The raw quantity of electricity of the sample, Q2, is recorded as well as the
residual current, ir2 and duration of oxidation t2.
The net quantities of electricity, for blank and sample noted Qb and Qs respectively, are calculated by subtraction
of the quantity of electricity due to the residual current to the raw quantity:
Qs=Q2-ir2t2 (1)
Qb=Q1-ir1t1 (2)
The mass of plutonium is then expressed from the Faraday’s law and the quantity of electricity corrected for the background and the fraction of plutonium electrolyzed, f (very close to 1):
The correction factor f takes into account the amount of Pu(IV) not reduced at first stage and that of Pu(III) not oxidized at second stage. It is dependent on potentials applied and is calculated by applying Nersnt Law and the hypothesis to have reached equilibrium:
(4) Although the value of f is very close to 1, it is indispensable to take this factor into account if a high precision is required.
RESULTS AND DISCUSSION
Measurement of Pu(IV)/Pu(III) formal redox potential
The acquisition of the E°’ value in the conditions of the coulometric titration (gold electrode, HNO3 0.9 mol/L
medium) is required for calculation of the fraction of plutonium electrolyzed. It was determined by the record of a coulogram, which corresponds to the plot of the quantity of electricity, Q, necessary to reach equilibrium (ie low current) from a totally reduced solution in function of the potential applied to the working electrode, E. The inflexion point of the curve indicates the position of E°’. An example is drawn in Figure 1 and gives E°’= (687± 5) mV/SCE which is consistent with values found in literature1,3,7 (676-677 mV/SCE).
Fig. 1.Typical coulogramm for a plutonium solution in 0.9 mol/L HNO3 solution on a gold electrode. Solid line : fitted
curve according to the Nersnt law.
Analysis of a pure plutonium nitrate solution The performance of the method was checked by plutonium standards taken from the “EQRAIN Plutonium 14” series of CETAMA. A repetition of 4 titrations was performed at room temperature (T=24°C) on the same vial and results are shown in Table I.
A bias of about -0.4% was observed which is surprising as we were expecting less than ±0.1% from previous acquisitions in equivalent conditions3. As the bias is
negative, we suspect the initial presence of Pu(VI) in the sample which would not have been reduced during the first step of electrolysis because the Pu(VI)/Pu(IV) redox pair is kinetically slow contrary to the Pu(IV)/Pu(III) quasi-reversible system7,8.
TABLE I. Net quantity of electricity determination for “Eqrain Pu 14” standard samples coulometric analysis.
Sample reference Reference Q (mC) Experimental Qs-Qb (mC) Bias (%) RSD (%) YD39 1901.7 1893.8 -0.42 0,06 YD40 1885.5 1877.6 -0.42 YD41 1892.9 1883.7 -0.48 YD42 1729.2 1723.2 -0.34
Evidence of Pu(VI) in Eqrain standard
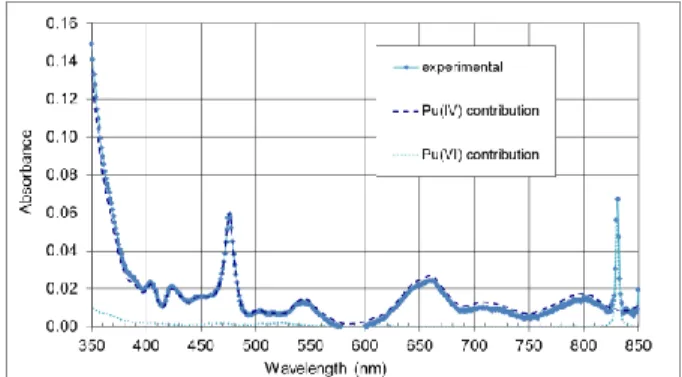
The presence of Pu(VI) in Eqrain Pu sample had already been evidenced in the past by recording UV-visible spectra of freshly prepared standard sample diluted in 1 molar HNO3 solution as is shown in Figure 2. Molar
fraction of Pu(VI) was typically about 14%.
Fig. 2.UV-visible spectra of an EQRAIN Pu standard after dilution in a molar HNO3 solution. Evidence of the presence
of Pu(VI) : .
This primary results thus highlights the importance of the chemical reduction of Pu(VI) to Pu(IV), by H2O2 for
instance, prior to coulometric assay as mentioned in ISO 12183 norm2 or ASTM C 1108 standard4 in order to avoid a defect of quantity of electricity linked to the non-quantitative reduction of Pu(VI) form at the gold electrode due to slow redox kinetics (equilibrium not achieved).
Precision evaluation for Pu mass obtained by coulometric determination
Two main methods exist to estimate the precision of measurements. The former classical method is based on variance propagation and the latter on propagation of distribution by a Monte-Carlo approach9,10. Systematic error is not taken into account in this exercise and is supposed to be null.
The expression of Pu mass is function of 4 parameters which are (Qs-Qb), F, f and M according to the following expression:
mPu=(Qs-Qb)M/(nFf) (5)
The uncertainty on mPu can be calculated from the law
of the propagation of uncertainties which gives for independent parameters (uncertainties in their relative form):
ur2(mPu) = ur2(Qs-Qb)+ ur2(M) + ur2(F) + ur2(f) (6)
Uncertainties are estimated for each variable according to its probability distribution of error and to standard deviation available in literature11 or taken from experiments.
For instance, uncertainty on M is assessed from the isotopic characterization of MP2 certified reference metal found in the certificate12 and by neglecting error on radioactive decay calculation between dates of analysis.
In the case of f, the uncertainty range is calculated by having the formal potential varied of ±5mV and measuring its impact on f value which gives a measuring span of 0.006%13 and an uncertainty of 0.06/23; ie 0.0017%.
As regards the terms (Qs-Qb), the standard deviation of Qs is considered equivalent to that of Qb and it is calculated from the standard deviation of a series of independent blank measurements which equals 0.6 mC. The relative uncertainty of (Qs-Qb) is obtained by dividing this quantity by (Qs-Qb) (value around 1850 mC) and by multiplying by
2 which gives a value of 0.043%. Results are gathered in Table II:
TABLE II. Budget of uncertainties for the determination of the Pu mass by coulometry.
Variable ur (k=1) distribution Ref.
F 9.2 10-7 % uniform 11
M 3.8 10-5 % normal 12
f 1.7 10-3% uniform 13
Qs-Qb 4.3 10-2% normal 13
Those estimations allows the determination of the global uncertainty on the Pu mass:
ur (mPu) GUM = 0.043% (k=1)
Major contribution in the uncertainty budget is the variance of the measurement of the net quantity of electricity. It stems from the difficulty to obtain a reproducible blank. A possible way to reduce its influence is to increase the mass of Pu in the sample.
Monte Carlo Method (MCM) approach
The Monte Carlo Method (MCM) for the evaluation of measurement uncertainty is based on the propagation of probability distributions10,14,15. This method is a practical alternative to the GUM classical approach and is of greater advantage when:
- the measurand mathematical model is complicated and introduces errors due to linearization and difficulties to provide the partial derivatives of the model
- the uncertainties of the input variables are not of the same magnitude
- the probability density function of the measurement result is not a Gaussian or a t distribution
This approach is actually more appropriate to estimate uncertainty of f and mPu because their expressions are
non-linear and because uncertainties of the different input variables are not of the same order (see table II).
A great number of N values of measurement are sampled at random from the distribution of the input quantities and if N is large enough (usually N = 106 as recommended in the supplement 1 of GUM10), a probability density function for the measurement result can be drawn, and the parameters (expectation and variance) estimated.
The coverage interval is directly chosen from the probability density function of the measurement result. This is one of the main advantage of MCM compared to the classical GUM approach where a normal distribution or a t-distribution assumption has to be made.
The mathematical expression of mPu used for MCM
simulation is equation (3) in which f is expressed as in equation (4) and Qs and Qb as equations(1) and (2). The
calculations are run on JMP ®13.0.0 from SAS Institute Inc. and by a random draw of 1 000 000. In table III, is illustrated the comparison between uncertainty evaluations obtained by both approaches GUM and MCM.
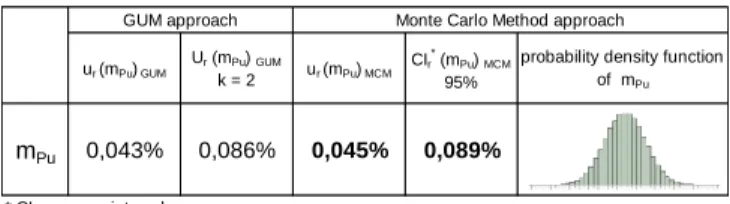
TABLE III. Comparison of uncertainty evaluations between GUM and MCM approach.
ur (mPu) GUM Ur (mPu) GUM k = 2 ur (mPu) MCM CIr * (mPu) MCM 95%
probability density function of mPu
mPu 0,043% 0,086% 0,045% 0,089% * CI coverage interval
GUM approach Monte Carlo Method approach
Uncertainty estimation results on mPu by GUM or MCM
approaches are very similar: Ur (mPu) GUM = 0.086% (k=2)
vs. CI r (mPu) MCM = 0.089% (95%).
Uncertainty evaluation of the reference mass of plutonium
The relation which allows the expression of the reference mass of plutonium is the following:
mref =maliquot Cref /( DF) (7)
where mref is the reference mass of Pu, maliquot is the
mass of the diluted standard, Cref is the reference Pu
concentration of the standard, DF is the dilution factor used to prepare the daughter solution.
As previously, the uncertainty expression is given by applying the law of propagation of uncertainties for independent parameters: ur 2 (mRef) = ur 2 (maliquot)+ ur 2 (Cref) + ur 2 (DF) (8)
As regards “EQRAIN Pu14” standard, the uncertainty on its concentration Cref is 0.06% (k=1) (normal
distribution).
Concerning the weighing of the aliquot (a mass of about 4 g), the lecture of the mass is corrected from air buoyancy and the uncertainty is estimated to be 0.020% (k=1), according to the acceptable deviation of the scale (uniform distribution).
The uncertainty of the dilution factor is calculated from the same considerations and takes into account two consecutive weighings (masses of standard an diluted solution of about 3.5 and 15 g respectively) which are also corrected from air buoyancy. The uncertainty is assessed to be 0.025%.
The uncertainty on the reference mass of Pu is then equal to :
ur (mRef) = 0.068% (k=1)
with a major contribution of the standard variance. Evaluation of the trueness of the coulometric method by calculation of the normal deviation between experimental mass and reference mass
The normal deviation allows to evaluate the coulometric method ability to have results close to the reference value within the claimed uncertainty. Its expression is given below and its values are reported Table IV for each measurement:
En = (mPu-mref)/(u2(mPu)+u2(mref)) (9)
TABLE IV. Calculation of normal deviation of results of coulometric titration of Pu mass with respect to reference mass. Exp. mRef (mg) mPu (mg) u(mRef) (mg) u(mPu) (mg) En YD39 4.7134 4.6938 0.0032 0.0020 -5.2 YD40 4.6731 4.6536 0.0032 0.0020 -5.2 YD41 4.6914 4.6686 0.0032 0.0020 -6.0 YD42 4.2855 4.2708 0.0029 0.0018 -4.3
The absolute values of En are all superior than 2 which
means that the method is not true according to claimed uncertainties and which confirms that a significant negative bias exists. Corrections must then be applied to the method which includes Pu valence control before fuming to dryness of the sample.
Conclusion
This preliminary results of controlled potential coulometry dedicated to the characterization of the concentration of plutonium in standards and its statistical analysis show that this electrochemical method can be very precise. Nevertheless, the method requires to be be carefully applied so that the results can be considered true according to the claimed uncertainty which are around 0.1% (k=2). This study emphasizes the importance of Pu valence control before sample treatment and suggests to rise the amount of
Pu aliquot in order to lower the uncertainty associated to the background corrections in the experimental procedure of the measurement of the quantity of electricity.
ENDNOTES
a
The role of sulfamic acid is to prevent the presence of nitrous acid which would chemically oxidize Pu(III). It has the advantage to be non-electroactive in the potential windows of the coulometric titration.
REFERENCES
1. M. K. HOLLAND, J. R.WEISS, and C. E. PIETRI, “A Reference Method for the Determination of Plutonium Using Controlled Potential Coulometry,” Proceedings of the 3rd ESARDA Symposium on Safeguards and Nuclear Material Management, Karlsruhe, Germany, May 6-8, 1981. 2. ISO 12183: Nuclear fuel technology – Controlled potential coulometric assay of plutonium (2018).
3. A. RUAS, N. LEGUAY, R. SUEUR, N. VEDEL, V. DALIER, Ph. MOISY, “High accuracy plutonium mass determination by controlled-potential coulometry,”
Radiochim. Acta, 102, 691 (2014)
4. ASTM C 1108-99, “Standard Test Method for Plutonium by Controlled-Potential Coulometry”, ASTM international, West Conshohocken, PA, (1999).
5. W. D. SHULTS, “Applications of controlled-potential coulometry to the determination of plutonium – A review”, Talanta, 10, 833, (1963).
6. M.S. MILYUKOVA, N. I. GUSEV, L. G. SENTYURIN, I. S. SKLYARENKO, Analytical Chemistry of Plutonium, Wiener Bindery Ltd, Jerusalem, (1967). 7. S. GEORGETTE, S. PICART, C. BOUYER, J. MAURIN, I. BISEL, S. GRANDJEAN, J. DESEURE, F. LAPICQUE, “Study of the plutonium (IV) electrochemical behavior in nitric acid at a platinum electrode. Application to the cathodic reduction of Pu(IV) in a plate electrolyzer,”
Journal of Electroanalytical Chemistry ,727, 163 (2014).
8. R. J. SILVA and H. NITSCHE, Advances in Plutonium Chemistry 1967-2000, p. 92, D. C. HOFFMAN Ed, American Nuclear Society, La Grange Park, Illinois (2002). 9. JCGM 100, Guide to the expression of uncertainty in measurement (GUM), (2008).
10. JCGM 101, Evaluation of measurement data – Supplement 1 to the “Guide to the expression of uncertainty in measurement” – Propagation of distributions using a Monte Carlo method, (2008).
11. P. J. MOHR, D. B. NEWELL and B. N. TAYLOR, , “CODATA Recommended Values of the Fundamental Physical Constants : 2014,” J. Phys. Chem Ref. Data, 45, 043102 (2016).
12. Plutonium metal “MP2” certificate, CETAMA.
13. N. LEGUAY, “Plutonium titration by controlled potential coulometry”, CEA-R-6264 Report, (2011). 14. M. COX, P. HARRIS, B.R.L. SIEBERT, “Evaluation of measurement uncertainty on the propagation of distributions using Monte Carlo simulation,” Meas Tech 46, 824 (2003)
15. M. COX, , B.R.L. SIEBERT, “The use of Monte Carlo method for evaluating uncertainty and expanded uncertainty,” Metrologia 43, S178 (2006)