Context-Aware Activity Recognition using TAN
Classifiers
by
Neil C. Chungfat
Submitted to the Department of Electrical Engineering and Computer Science
in partial fulfillment of the requirements for the degree of
Master of Engineering in Electrical Engineering and Computer Science at the
MASSACHUSETTS INSTITUTE OF TECHNOLOGY May 2002
@ Neil C. Chungfat, MMII. All rights reserved.
The author hereby grants to MIT permission to reproduce and distribute publicly paper and electronic copies of this thesis and to
grant others the right to do so.
Author ....
.
.
.
.
Department of Electrical Engineering and Computer Science May 24, 2002
Certified by...
Stephen S. Intille Thesis Supervisor Accepted by...Arthur C. Smith
Chairman, Department Committee on Graduate Theses
MASSACHUSETTS INSTITUTE OF TECHNOLOGY
JUL 3 1 2002
Context-Aware Activity Recognition using TAN Classifiers
by
Neil C. Chungfat
Submitted to the Department of Electrical Engineering and Computer Science on May 24, 2002, in partial fulfillment of the
requirements for the degree of
Master of Engineering in Electrical Engineering and Computer Science
Abstract
This thesis reviews the components necessary for designing and implementing a real-time activity recognition system for mobile computing devices. In particular, a system utilizing GPS location data and tree augmented naive Bayes (TAN) classifiers is described and evaluated. The system can successfully recognize activities such as shopping, going to work, returning home, and going to a restaurant. Several different sets of features are tested using both the TAN algorithm and a test bed of other competitive classifiers. Experimental results show that the system can recognize about 85% of activities correctly using a multinet version of the TAN algorithm. Although efforts were made to design a general-purpose system, findings indicate that the nature of the position data and many relevant features are person-specific. The results from this research provide a foundation upon which future activity aware
applications can be built.
Thesis Supervisor: Stephen S. Intille Title: Research Scientist
Acknowledgments
My heartfelt thanks to the many people who supported me during the last five years
at MIT. In particular: my parents who have always stood behind me; my advisor, Stephen Intille who offered his guidance and experience throughout this project and refused to let me feel lost during the course of this year; my friends who have made the last five years of hardwork and sleepless nights all worth it.
Thanks also to the National Science Foundation for funding this project and my research this past year.
Contents
1 Introduction 15 1.1 M otivation . . . . 16 1.2 T he Task . . . . 18 1.3 O utline . . . . 18 2 Related Work 21 2.1 Mobile Context-Aware Computing . . . . 212.2 Activity Recognition . . . . 23
3 Choosing and Qualifying Actions 25 3.1 Data Sources . . . . 25
3.1.1 Location Data . . . . 25
3.1.2 Personal Information Management (PIM) Data . . . . 27
3.1.3 Maps and Landmarks . . . . 28
3.1.4 Lexical and Knowledge Databases . . . . 29
3.1.5 Other Sensor Data . . . . 30
3.2 Identifying Activities . . . . 30
3.3 Features . . . . 31
3.3.1 Where - Geographic References . . . . 31
3.3.2 When - Temporal References . . . . 32
3.3.3 Why - PIM data . . . . 32
3.3.4 How - Speed . . . . 32
4 Recognizing Activities 35
4.1 Goals ... ... 35
4.2 Approach . . . . 36
4.2.1 Bayesian Networks . . . . 37
4.2.2 Naive Bayesian Classifiers . . . . 37
4.3 TAN Classifiers . . . . 38
4.3.1 Structure Determination . . . . 39
4.3.2 Training . . . . 40
4.3.3 TAN Multinets . . . . 41
5 Results and Analysis 43 5.1 Data Acquisition . . . . 43
5.2 Features . . . . 44
5.2.1 Single Point Distance . . . . 44
5.2.2 Changing Distances . . . . 44
5.2.3 Trajectory . . . . 45
5.3 Classification Results and Analysis . . . . 46
5.3.1 Algorithm Results . . . . 46
5.3.2 Extensions . . . . 49
6 Discussion 51 6.1 Feasibility of an Activity Recognition System . . . . 51
6.2 Extensions and Improvements . . . . 52
6.2.1 Other Activities . . . . 52 6.2.2 Low-Level Data . . . . 53 6.2.3 High-Level Knowledge . . . . 53 6.2.4 Applications . . . . 54 7 Conclusion 55 A System Overview 57 A.1 Hardware . . . . 57
A.2 Software . . . .
A.2.1 GPSRecorder .... A.2.2 GPSTracker . . . . .
A.2.3 TAN . . . .
A.2.4 Experience Sampling
B Activity and Landmark B.1 Selecting Activities
B.2 Online Resources . B.3 Labeled Map Areas
Data
C Tests
C.1 Training and Testing with Different Users . . . . C.2 Wordnet Trials . . . . C.2.1 TAN Structure Determination . . . . C.2.2 Naive Bayes Training . . . .
. . . . . . . . . . . . . . . . . . . . . . . . . . . . . . . . 57 58 59 59 61 63 63 65 66 69 69 70 70 70
List of Figures
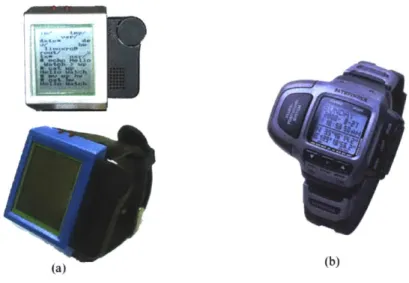
2-1 The IBM Linux watch (a) and Casio watch equipped with GPS receiver
(b) ... ... 22
3-1 iPAQ device with GPS receiver . . . . 26 3-2 A map of the area near the MIT campus with different colors
repre-senting the various kinds of areas used in this work. . . . . 28
4-1 A naive Bayes network . . . . 38
4-2 A TAN network for the Adist(prev) dataset. . . . . 39 5-1 A graph depicting the predicted classifier accuracy of each classifier for
each dataset. . . . . 48
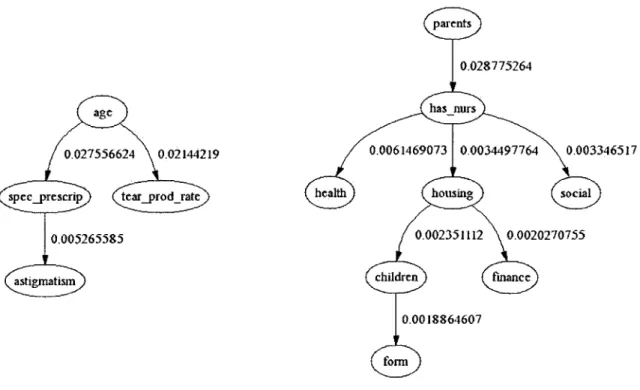
A-1 The maximum spanning trees with associated IPx values for the
con-tacts (left) and nursery (right) datasets. . . . . 60
List of Tables
5.1 Summary of classifier results per feature set (mean ± variance). . . . 5.2 Confusion matrix for ADiff(prev) . . . .
46 49 B.1 Complete activity list with incidence count . . . . 64 C.1 Confusion matrix for data gathered by a second user and evaluated
Chapter 1
Introduction
Mobile computing devices such as cellular phones and personal digital assistants (PDAs) have become more prevalent in recent years with handheld device use ex-pected to increase 19% in 2002 to 14.75 million units [37]. In conjunction with their widespread use, these devices continue to become both more powerful and more portable. To evolve beyond more than simple replacements for paper organizers, applications must intelligently take advantage of a user's location and intentions to provide useful services.
Context-aware computing aims to create applications that leverage information about the user's environment to improve his experience by making more natural and intuitive interfaces [16]. This thesis outlines the high-level design goals for an activity recognition system and describes the knowledge sources that are available to build such a system. In particular, a system was designed and implemented that uses a simple training process and allows for the automatic recognition of some activities without complex knowledge engineering. The recognition system deals with noisy sensor data, and infers personalized activity recognition models without explicitly providing the system with hard-coded rules. While past systems simply match a user's location to one particular action, this research attempts to go beyond these models by considering more complex situations where a single location may be related to more than one action and for which context is not determined by location alone. The results from this system are discussed and used to speculate on the possibilities
for future work.
1.1
Motivation
A variety of context-aware applications could take advantage of the capabilities of
an accurate activity recognition system. Applications that are aware of the user's environment become more personally relevant by presenting information that applies to the situation at hand, thereby improving the user experience. A key benefit of the system described here is that it relies on location data that is relatively easy to obtain and does not require deploying and calibrating cameras or other more expensive sensory devices. The availability of location data makes this recognition system useful for a variety of applications.
* Preventative Medicine. This research grew from a larger effort focused on
designing new interfaces and technologies that address preventative health care. Recognizing the activities of an individual both inside and outside of the home provides important data that can be used to infer patterns of behavior. Vision-based systems have been implemented that can recognize motions such as sitting up, falling backwards, squatting, and walking [29] as well as interactions between different people [34]. While it is possible to detect more detailed actions inside a controlled or enclosed environment, such as the home, it is far more difficult to apply the same vision-based systems in the outside world. To obtain equally useful observations outside of the home, an activity recognition system could be used to measure the frequency and types of exercise the user engages in and the frequency of other daily routines. Healthy living could also be influenced by providing advice on nutrition when, for example, it recognizes the user is going out to lunch. Accumulating observations on behavior combined with offering advice at the right time and place can help alert the individual to recognize and remedy potential health risks [38]. It is therefore important that a preventative healthcare system readily distinguish how actions are being executed (i.e. a walk is considered exercise but taking a drive is not) and be sufficiently accurate in
its detection process for medical applications.
* Response Adaptive Applications. Integrated with other applications and systems, a location-aware system could perform a variety of useful tasks. Many of these are based on the application's ability to provide the right information at the right time. Knowing what the user is doing or is about to do is therefore essential for such applications to avoid presenting untimely and inappropriate information. Memory aid applications could remind the user to buy milk when they sense the user going to the supermarket or to pick up dry-cleaning on the way home from work. Planning applications that anticipate a user's most frequently taken routes could alert the user to hazards such as construction or blocked roads and suggest alternative routes or make reservations for a restau-rant the user is heading towards. Social applications could notify friends and family when the user is coming by for a visit or allow someone to ask their neighbor to run an errand if he is already enroute to some destination. An ideal system will therefore be able to run in real-time, recognizing activities quickly to allow for relevant information to be presented to the user before the action is completed.
e Games. Both educational and recreational games could make use of this
ac-tivity recognition system. Electronic Arts recently released the innovative Ma-jestic game [43] that attempted to create a unique and personalized gaming experience by contacting users through phone calls, faxes, e-mails, and Internet messaging. An additional depth to this type of gaming experience could be achieved by incorporating a user's real world actions into the game's storyline. One can imagine a game that adapts itself to the user's routines, thereby per-sonalizing the experience on a per-player basis. The activity recognition will therefore have to be trained to the user's personal habits and routines relatively painlessly, without requiring a great deal of effort from the user.
1.2
The Task
To design a system that accommodates the aforementioned applications, a few issues must be addressed. First, what kind of data is available that will be useful for this task? This in-turn influences the resolution of activities that can be recognized by the system as well as the types of algorithms that can be used to actually perform the recognition. The research described here attempts to investigate these questions.
A system to detect several routine actions including going to work, going home,
and going shopping is described as well as how it was designed, implemented, and tested. This system utilizes a combination of GPS and zoning-type map data (i.e. parks, residential neighborhoods, businesses, and restaurants) to represent a user's movements and activities. As the location the system perceives is merely a point on the globe, the class of actions it was designed to recognize were not as fine-grained as other systems that utilize computer vision to obtain data (i.e. [29, 11]). Instead, the focus of this work is on understanding the potential of machine-learning classifiers to recognize activities primarily defined by the type of area where they occur - for
example shopping, going to work, and returning home.
To be truly useful, an activity recognition system should be able to adapt itself to the habits of the user. However, since each person has his own habits, some supervision on the part of the user is necessary. Ideally, this training process should be as simple as possible and not require complex knowledge engineering. The algorithm should not use features that are overly user-specific and that require hard-coding information into the system.
1.3
Outline
The remainder of this paper is structured as follows. Related work on other context-aware and activity-based systems is discussed next in Chapter 2. Chapter 3 covers the types of data that are available for use in activity recognition and how these translate into useful features. A discussion of the approach taken to recognize activities is
contained in Chapter 4 followed by a review of the results in Chapter 5. Chapter 6 contains a discussion of lessons learned from this experience as well as possibilities for future work. We then summarize and conclude in Chapter 7.
Chapter 2
Related Work
2.1
Mobile Context-Aware Computing
Within the next few years, portable technology will become more prevalent and more useful for everyday activities. Current PDAs accommodate cameras, GPS receivers, barcode scanners, as well as a multitude of other peripherals. As a result, we antic-ipate that an integrated "all-in-one" device will be possible within a few years that is both more powerful and more portable than current devices. With this in mind, the activity recognition system described here may one day be able to work using a
PDA with a wristwatch form factor. In fact, IBM researchers have already
proto-typed a "smart-watch" that runs Linux [32] (see Figure 2-1(a)), and watches are on
the market with GPS capability (Figure 2-1(b)).
While some context-aware studies have focused on improving user-interaction with desktop computers, our research focuses on providing useful information and services
to users as they go about their daily lives. Location-aware handheld computers have been used to create intelligent tour guides (see [1, 10, 41, 13]) that present text, audio, and video information to users as they walk around a pre-determined area.
Informa-tion pertaining to the locaInforma-tion such as a restaurant review or historical background are provided when the user reaches a particular location that triggers the response. For these applications, a simple "are they near this location?" is sufficient to serve as the context since an assumption is made that the user is interested in the information
(b) (a)
Figure 2-1: The IBM Linux watch (a) and Casio watch equipped with GPS receiver (b)
that will be provided. These applications therefore only assume one context for a particular location. In other words, the applications present, at most, one type of information per place and do not take into account the possibility that the user is interested in something else or is engaged in multiple simultaneous activities. Other similar applications have been developed to help shoppers locate items in a supermar-ket and provide nutritional or discount information related to each shopper's location and past history [10, 4]. The addition of a shopper's buying habits can provide enough information to personalize the experience by reminding a user that he last bought milk a week ago or informing him that his favorite kind of cereal is currently on-sale. For an action recognition system, more information than the current location of the user is needed to make an accurate prediction. The implications of user pref-erence for particular routes also influences how the system must function, whereas, for example, the tour guide applications need not be concerned with these details. For them, it does not matter how the user arrived at the location, merely that he is there. The requirement that the system be adaptable on a per-user basis requires more sophisticated testing procedures than a system that functions the same way for all users.
2.2
Activity Recognition
The computer vision community has devoted much research into motion recognition. One technique, known as background subtraction, can distinguish moving people and objects within a room. Over time, the camera learns a statistical model of the image representing the static environment (objects that remain still). When a person enters the room, it compares the new image to its version of the background and highlights the differences, assuming that these "blobs" are people moving about [19]. Beyond tracking people themselves, extensions of this technique can be used to track gestures, including arm or hand motions such as those used in sign language [42] and even automobiles to study traffic patterns [26]. Vision systems have also used probabilistic models to perform action recognition. Pentland et al. have used hidden Markov models (HMMs) and features extracted from video data to recognize patterns of human interaction [34], Tai Chi hand movements [7], and the behavior of people driving automobiles [33].
The data for these vision-based systems was gathered in controlled environments with mounted cameras. The benefit of GPS technology is that it is already om-nipresent and therefore any service that makes use of it can be deployed without requiring the placement and calibration of sensors in the environment. The set of actions that a vision-based system is designed to recognize are dependent on camera placement, lighting conditions, and many other environmental factors. This makes it difficult for these systems to adapt to new places or to be extended to recognize different kinds of actions.
Another important difference is that the vision systems are trained to recognize complete actions such as the gesture of standing up. The action recognition system that we envision, on the other hand, must attempt to make a prediction of the action that is currently taking place (and may take a long time to complete) to be of the most use. Once the action has taken place, it may be too late to present useful information to the user. As a result, some of the models used for recognition by the vision-based systems do not apply for our system. HMMs can be used to model
actions in vision systems because they model a discrete state of the system. The data we are concerned with is not as detailed, which makes it hard to specify the specific states and transitions in our system. A HMM could potentially be layered on top of our system to model user habits, though this requires a robust underlying system that can accurately predict what a user is doing. For this system, we consider the class of machine-learning classification algorithms. This is fitting because our data is well represented by distinct features that we wish to cluster into categories. In particular, we examine the tree augmented naive (TAN) version of the Bayes classifier because of its combination of training simplicity and competitive performance [23].
Chapter 3
Choosing and Qualifying Actions
An important goal in designing this system was to minimize the number of hard-coded rules required by the system. While we could have used rules explicitly connecting places with actions (i.e. supermarkets with grocery shopping) as in prior work [1], our goal was for the system to learn these associations through training data. We wish to do this so that the system can adapt to a user's personal habits. For example, a shopping mall that contains restaurants could be frequented by one user to shop, another to work, and yet another for meals. To make this learning process possible, both sources of high-level knowledge and methods of making this knowledge available to the system are required.
3.1
Data Sources
There are several potential sources of data for an activity-recognition system. In addi-tion to locaaddi-tion data, the applicaaddi-tions of the PDA device as well as several geographic tools are available as resources.
3.1.1
Location Data
The Global Positioning System (GPS)was developed by the United States Department of Defense and released for civilian use in 1990. The system consists of 24 satellites and
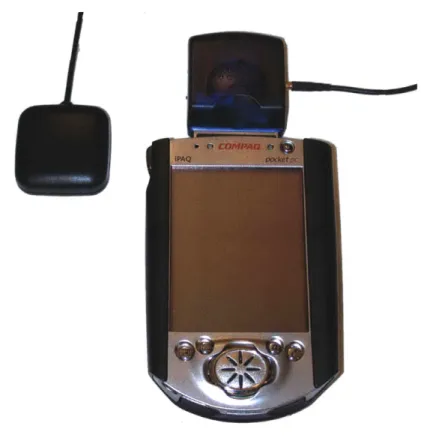
Figure 3-1: iPAQ device with GPS receiver
several ground stations around the world, which are used to determine the precise position, velocity, and altitude of a properly equipped receiver. A receiver within range of these signals measures the distance based on the travel time between the receiver and a minimum of three satellites and uses these to triangulate its position. With selective availability (an intentional degradation of the GPS signal) turned off since May 2000, accuracy is possible within 10 m of the actual position
[18,
25].The most severe limitation of GPS technology is that it must operate within line-of-sight of the orbiting satellites as the weak signals cannot penetrate buildings or dense foliage [15, 18]. As a result, positions cannot be taken if the receiver is inside or close to buildings or other obstructions. Using a receiver in urban areas is further complicated by multipath error, which results from signals being reflected by buildings or other surfaces near the receiver. This can introduce additional error of up to half a meter [15].
Acquiring a good signal lock from a GPS receiver requires on the order of tens of seconds, depending on the availability and accuracy of the last known position. From a cold start (lacking memory of the last recorded position), obtaining a reliable position lock requires about 40 seconds in an unobstructed location. This can improve significantly to under 20 seconds if the receiver contains memory of the last position and that position is relatively close to the receiver's new location.
For this work, a PDA device equipped with a GPS receiver (see Figure 3-1) and custom software was used to acquire GPS data. The device could either be run continuously or scheduled to gather data at regular intervals (i.e. every 15 minutes). In addition, whenever the user powered on the device, the software would run in the background and attempt to get a position fix. Position error was noticeable in the data we gathered with the position being skewed up to 125 m when the receiver was in an enclosed area. The effects of noise on the results of our system are noted in
Section 5.2.
3.1.2 Personal Information Management (PIM) Data
The applications that come pre-installed on PDAs store valuable personal information
management (PIM) data entered directly by the user. This data provides a snapshot of some of the activities that the user believes are important and can therefore help the recognition algorithms to infer activity. If the user has some appointment scheduled, it is likely that some action is taking place that coincides with the appointment. The algorithm can then attempt to use this data to make a more accurate prediction. An up-to-date appointment book is a strong indicator for some action - i.e. a lunch appointment or a meeting at work.
The PIM data is easy to obtain and can be very precise. However, because it requires user entry, appointment text can be misspelled or abbreviated and the ap-pointments themselves may simply be out of date. As a result, clustering this noisy data is a problem in its own right that must be overcome before incorporating it into
a recognition scheme.
Central square
(business area) / J Zi
Cambridge Galleria
Public Library (shopping)
residential
areas Legal Seafoods
church (restaurant) University, Park Hotel / 4 -MIT Star Market ( (supermarket) (nvriy 4, Esplanade school (recreational) Bak Bay (residential area) Briggs field (recreational area)
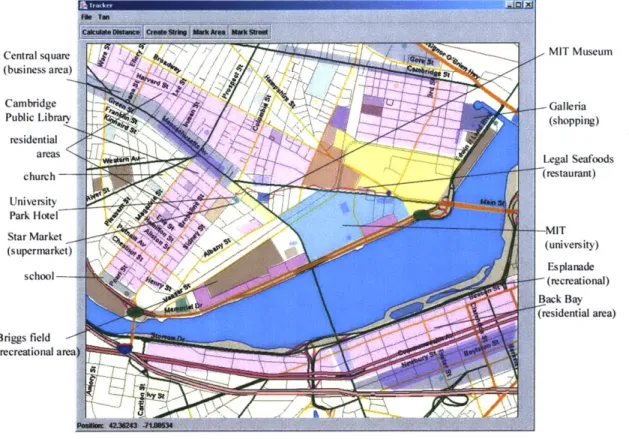
Figure 3-2: A map of the area near the MIT campus with different colors representing the various kinds of areas used in this work.
3.1.3
Maps and Landmarks
Longitude and latitude positions returned by the GPS receiver are only useful in combination with map data such as the residential and commercial zones of a city or specific names and locations of restaurants and businesses. To obtain this informa-tion, which is not currently publicly available in convenient formats, a graphical user interface (GUI) was developed that allows for quick and detailed labeling of specific areas. This was used to identify specific areas of Cambridge, MA in the locale of the MIT campus. Specifically, we identified business, recreational, residential, shopping, and university areas as well as specific locations including banks, churches, hotels, libraries, museums, post offices, restaurants, schools, and supermarkets (see Figure
3-2 or Appendix B.3 for a complete list of places).
In all, 103 areas and places were labeled for our experiments. Very specific
-formation, such as street-name data and the locations of a particular user's home or workplace were avoided to prevent making the system too user-specific. Along the same lines, individual places of the same type are not distinguished. For example, restaurants and businesses do not carry a label and are categorized simply as "busi-ness" or "restaurant." For our experiments, the closest distance to each of the area types is calculated and used as a feature, thus ignoring any more specific detail about the place other than its position and type.
There are many geographic resources such as Geographic Information System (GIS) databases and mapping references that are available on-line (see Appendix B.2 for more detail). As mentioned above, finding a suitable source of city-level informa-tion for parks and monuments could be useful. While reverse-geocoding (translating a coordinate to an address) services could be applicable, they do not currently provide the detail (i.e. the category of the establishment at the address) that was required for this application.
3.1.4
Lexical and Knowledge Databases
Existing databases, such as encyclopedias and lexical references contain a great deal of high-level knowledge that could be useful for activity recognition algorithms. For example, WordNet is a lexical database based on psycholinguistic principles. From a high level, it can be thought of as a dictionary ordered by synonym sets (synsets) or syntactic categorization [20]. A convenient API makes it possible to easily search the database for synsets as well as definitions and words associated with a particular term.
Lexical freenet' (lexfn) is a system that utilizes the synonym relations of WordNet but also organizes names and places based on relationships between words. Terms such as "Kmart" and "shopping" are linked due to their close-proximity in multiple documents found in a corpus of news broadcasts [5]. This feature is less useful for our purposes than using more traditional semantic relationships, which lexfn can
use to find connections between words. These relationships include synonymous,
generalizes, specializes, comprises, and part of allowing for the development of a metric
to determine the relevance between pairs of words. A system might then be able to use this information as part of its training process to learn what features are more relevant for particular activities. For example, a park might be classified more closely as a recreation area than a grocery store, therefore leading to the conclusion that someone is more likely to go for a walk in a park. Unfortunately, the database itself is not perfect, sometimes returning semantic relationships that do not seem to make sense or returning a shorter series of relations for two words that do not seem to be related. This makes it hard to anticipate if a system trained on the basis of these links would truly reflect reality. The choice of words to describe the features also becomes much more important since it determines the quality of the relationships that will be returned by the database.
3.1.5
Other Sensor Data
Data from sensors such as barcode scanners and light meters can also provide con-textual information about the user. A barcode scanner in use may indicate the user is grocery shopping, while a light meter can provide information about the weather or determine if a user is outdoors. Other technologies such as Bluetooth can provide information about available resources and how far the user is from these locations. Although our system does not currently make use of sensor data other than GPS locations, it can be extended to accommodate data from these other sensors.
3.2
Identifying Activities
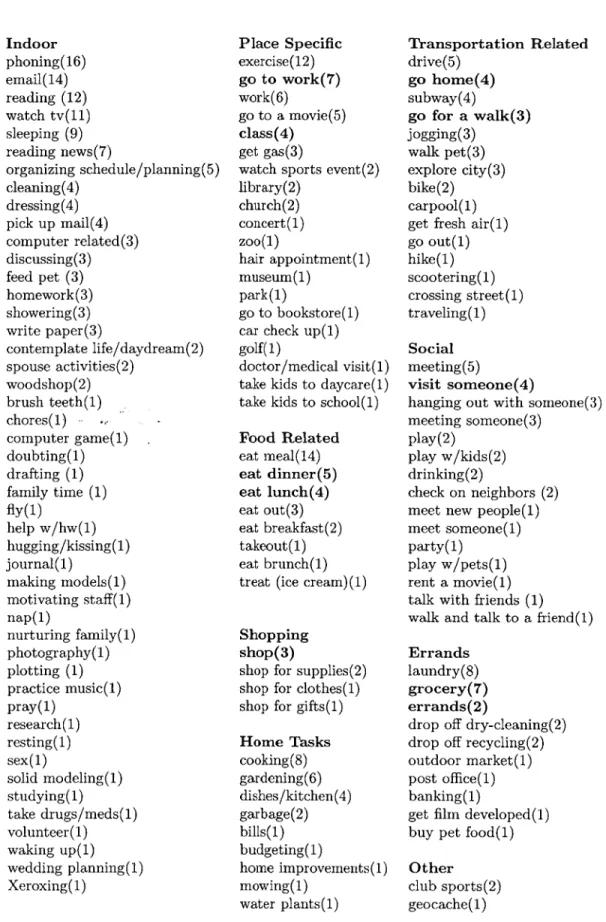
One goal of this work was to identify the sorts of activities that the system should and could recognize. "Typical" daily activities were solicited from research affiliates
by asking them for a "list of high-level actions" that they normally do in a week. Of
the twenty-six responses, these included activities such as "grocery shopping," "going to work," "going to class," "laundry," "watching television," "checking e-mail," and
"reading" (Appendix B.1 contains a complete list of the responses). A subset of these were chosen for this study by first grouping the activities by hand, selecting those activities that occur outdoors (due to the limitations of GPS) and then picking those that were most appropriate for a university setting and that were frequently listed. The final set included the following ten activities: going to work, going home, going to class, grocery shopping, going for a walk, shopping (i.e. at a mall), going to visit someone, going to eat lunch, going to eat dinner, and running errands. Some popular responses that were omitted included gardening (few gardens in the area), phoning, and cooking (both generally indoor activities).
3.3
Features
The features that were considered fall into the four broad categories of "where" (geographic data), "when" (temporal data), "why" (PIM data), and "how" (travel
method) with the final category - "what" - being what the system is supposed to
determine.
3.3.1 Where - Geographic References
For our system, the locations served as reference points, which were compared to locations and areas identified within the neighborhood where the user was located. Using this data, several first-order features (those that can be derived directly from low-level data) can be observed. Points can be organized by their distance from each other or from the labeled areas and landmarks. Higher level features can take into account the starting and ending points of the trip as well as landmarks that are passed while the activity takes place. As our system primarily uses location data, several different sets of derived features of varying complexity were used. These are described in greater detail in Section 5.2.
3.3.2 When - Temporal References
First-order features include the time of day and the day of the week when the ac-tion occurred. Higher order features take into account past events and patterns of behavior. An example could be recording the last landmark passed by the user or the last time the user performed the action of concern (i.e. the last time a user went to the grocery store). Our system incorporates many first-order temporal features but does not consider some of the more complex second-order features. While these could be useful for our system, our experiments omit these features to measure the base effectiveness of the algorithms using a more general set of attributes. We, how-ever, suggest that future work should investigate using these higher order temporal features. These features encode illustrative patterns of user behavior and would be useful for applications that are built on top of this system.
3.3.3
Why - PIM data
The personal information management (PIM) data can provide a clue as to why the user is engaging in a certain action. For example, is there a meeting in an hour, hence the trip to work? The "why" can provide valuable information, especially when a user deviates from more common patterns of behavior, such as going to school at night for a special seminar or concert. Due to the complications involved in clustering PDA data, our recognition system does not make use of these features though it would be a reasonable extension to include in the near future.
3.3.4 How - Speed
How a person performs the activity can be a useful feature. Two different activities may be differentiated if the user drives for one, but is walking for another. Recogniz-ing exercise habits rely on accurately recognizRecogniz-ing these differences. The recognition system described here makes use of the average speed the user travels from some start location. More complex features are difficult to measure due to the limitations of the
3.3.5
Maintaining Generality
Choosing a general set of features is a fairly difficult problem. By nature, humans are creatures of habit and routine. There might be several ways to go from A to B, but everyone has their preferred route that they are predisposed to choose. The location data that we record as a user moves from place to place therefore contains an intrinsic personal character. Despite this hurdle, attempts were made to keep the system from becoming too specific. Features that are dependent on user-specific data (i.e. home and work) were intentionally avoided. In addition, tracking the specific streets traversed on a route was avoided to prevent biasing the system to particular routes. Including these features, however, might make it possible to create a more powerful system that caters to a single user but can recognize some of the more complex actions. This is discussed further in Section 6.1.
Chapter 4
Recognizing Activities
4.1
Goals
The task of classifying an instance as one of a set of pre-defined categories is a classic problem in machine learning. As a result, there are a variety of well-known methods varying both in complexity and effectiveness. Selecting the best algorithmic approach required careful evaluation of several design goals.
" Training the system should be simple without requiring complex or expert
knowledge engineering.
" The data input into the system should be easy to obtain requiring minimal
input from the user.
" The algorithm should be able to take advantage of data mined from the PDA
device and be extensible to accommodate data from other sources.
" The activities recognized should be useful for some application and should be
predicted with some certainty estimate by the algorithm that can be used to create interfaces that degrade gracefully.
" The algorithm should have a reasonably high level of accuracy (>80%) and be
4.2
Approach
The goals, stated above, constrain the algorithms that could be considered. Rule-based systems, while powerful, often require complex knowledge engineering that is difficult and time consuming. In addition, they do not easily provide a means of relating uncertainty with a given decision [39]. Neural nets, while known for their strong performance are slow to train, requiring many passes over the training data. In addition, the network structure is a black box; the decision model is hidden within the network structure, making it difficult to understand how the system decided upon a result [40, 39]. Decision trees are also well-known as being competitive classifiers and our results confirm that they perform well on our datasets. However, determining the structure of a decision tree can be quite complex, requiring heuristics to determine when to stop building the tree and how to prune unnecessary branches. As a result, if the heuristics are not chosen carefully, the system may overfit the training data.
[39].
The requirement to present an estimate of the certainty for a given decision sug-gests the use of a probabilistic classifier. Among the most well-known of these is the Bayesian network. In a Bayesian network, attributes that describe the problem being modeled are represented by nodes, while dependencies between these attributes are symbolized by arcs connecting the nodes. A complicated system will therefore be represented by a complex graph [35]. The tree augmented naive Bayesian (TAN) classifier is one variant of this type of classifier that places limits on the complexity of the network, thereby reducing the overhead of automatic structure determination from a training set and helping to prevent overfitting [23, 12]. Training the network requires a dataset that contains enough examples to provide a realistic view of the sit-uation that is being modeled. These examples are then used to calculate probabilities that will later be referred to during the classification of new instances. Because these probabilities are pre-calculated, Bayesian methods, as a whole, classify new instances relatively quickly. The TAN algorithm is therefore relatively simple, yet still performs competitively against other more complex algorithms despite its lack of dependency
encodings [23]. In general, Bayesian methods provide a powerful and (depending on the network structure) computationally efficient and intuitive method of modeling the uncertainty in complex situations [40].
4.2.1
Bayesian Networks
The set of classifying techniques based on Bayes rule are known as Bayesian net-works (also called belief netnet-works [27]). Given n attributes, A1, A2, ..., An, with
val-ues a,, a2, ..., an Bayes rule states that we predict the probability that these attributes
represent some class value, c, in C as follows [44]:
P(ai, a2, ... , an|C= c)P(C =c)(41
P(C = clai, a2, ..., an) = (4.1)
P(ai, a2, ...,I an)
If the network is provided with a dataset that contains a full-range of possible
examples, the probabilities for each value of c can thus be calculated and the highest selected as the most probable class for the represented instance.
Formally, a Bayesian network can be described as a pair B = (G, 0) with G
repre-senting a directed acyclic graph that encodes a joint probability distribution over a set
of random variables, U = {X1, ..., Xn}. Nodes in G represent the attributes, while
arcs represent dependencies between the attributes. Each node can be considered independent of its children, given its parents in G. The set
E
contains the quantita-tive parameters that define the probability distribution of the network. A parameter0
Xi rJ, = PB(xi|Hx) is defined for each pair of xi and Ix, where Hx, represents the set of parents of Xi. The joint probability distribution over U is thus given by
n n
PB (X1, .. , Xn) = 17 P (Xi I x) = f Oxi inX, (4.2)
i=1 i=1
4.2.2
Naive Bayesian Classifiers
Naive Bayes is perhaps the simplest form of a Bayes network. The model assumes that the attributes used for classification are all conditionally independent - a rarely
clas
ftme day University SUPenn 'et Recreationial Shoppinigmall Schoot Business
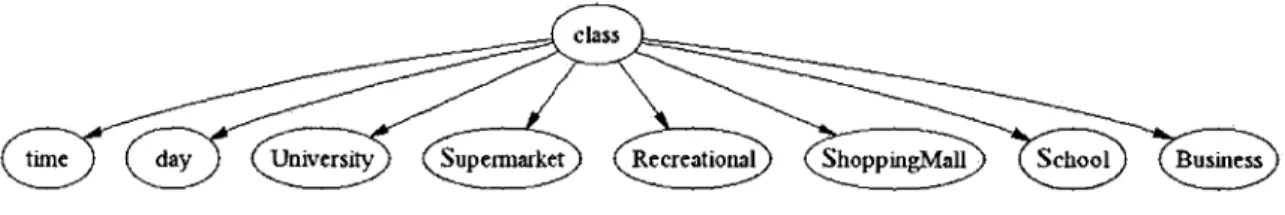
Figure 4-1: A naive Bayes network
true and "naive" assumption. As a consequence of this assumption, a naive Bayes network can be represented as a tree with the class node as the root and each of the attributes as a leaf (see Figure 4-1). Despite its simplicity and the strong indepen-dence assumption, naive Bayes has been shown to be competitive with other more complex classifiers. The success of these models may be due to low variance in the model in combination with high bias resulting from the independence assumption
[22]. Effectively, the low variance cancels out the effect of the bias, making accu-rate classification possible. The independence assumption simplifies the calculation in (4.1) [44]:
P(ai, a2, ..., an) = P(a|c)P(a2c)...P(anIc) (4.3)
Therefore, a naive Bayesian network is trained by simply computing the probability of each attribute given the class using the instances contained in the training set. Alternatively, the priors can be explicitly specified if no training set is available or if enough detail is known about the system.
4.3
TAN Classifiers
Tree augmented naive Bayes (TAN) classifiers relax the strong independence assump-tion inherent in naive Bayesian networks by allowing at most one addiassump-tional arc be-tween attributes. Compared with other, more complex forms of Bayesian networks, determining the structure of these graphs is not an intractable problem since the total number of arcs in the graph is limited, thereby reducing the possible search space. TAN networks are therefore a good compromise between the simplicity of
class
tunn
day
speed University
Library
ShoppingMall Recreational School
Hotel Residential Laboratory
Museum Business
Church Restaurant
Supennarket
Figure 4-2: A TAN network for the Adist(prev) dataset.
naive Bayesian networks and a more realistic representation of the situation being modeled. In addition, they perform as well, if not better than naive Bayesian net-works and other more complex classifiers on standard test sets [23].
4.3.1
Structure Determination
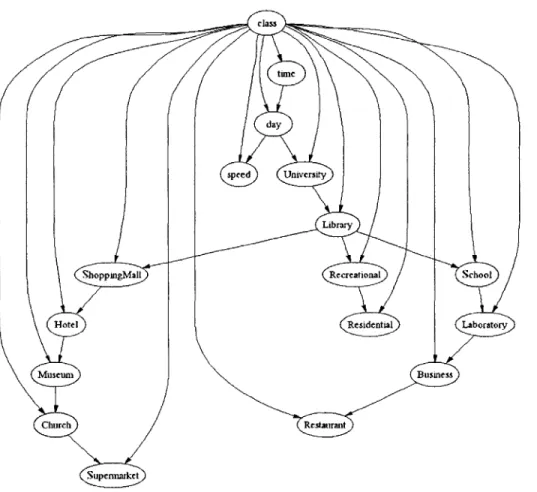
The structure of a TAN network is the same as that of a naive Bayesian network save for the possibility of at most one additional incoming arc for each attribute node (see Figure 4-2). The graph reflects some of the dependencies found in the training data. For example, the connection of "Business" with "Restaurant" indicates that the influence of the proximity of a business is closely tied to that of restaurant areas for the actions contained in this set of data. Determining the structure of a TAN graph
reduces to determining which attributes influence each other most strongly and then connecting the nodes that represent these two attributes with an arc. When using purely discrete attributes, Friedman et al. [23] utilize conditional mutual information as a metric for measuring this influence. This function is as follows:
I (A1; AjIC) = E P(ai, aj, c) log P (ai, Pa c) (4.4) a1 ,aj ,c Paj)~jc
Thus over the set of class variables, C, we calculate Ip(Ai, A
IC)
for all i =j.
We then use these values to determine which arcs should be present in the final graph. This amounts to calculating the maximum spanning tree in a complete undirected graph with the weight on the arc connecting nodes i andj
equal to I, (Ai, A3IC).
Determining the structure is polynomial, with a time complexity of O(n2N), where
N is the number of training instances [23].
4.3.2 Training
Training a TAN network amounts to calculating the prior probabilities of each at-tribute, given the class based on the occurrences of the attributes in a training set. The only difference between a TAN network and a naive Bayesian network is that in
TAN networks, connected attributes must be accounted for in the prior-probability
calculations. To provide for missing attribute values in the training set, a smoothing function is applied that effectively assumes that there is at least one of each possible value for each attribute in the training set. Referred to as the LaPlace estimator [40, 30], Cerquides [9] derives the functions appropriate for building a TAN network from a multinomial sampling approach, where CountD(Xi) is the number of instances in the training set that contain where Xi = xi and #Val(X) is the number of values of attribute or class X.
CountD(Xi, fxi) + A gtaes (P)
Oi nx= CountD(Hx)+ A#Val(Xi)SC(Xi) (4.5)
acaj -ContD ca) + #Val(C)#Va(Aj)#Va(Aj) (4.6) CountD(c, aj) + #Val(C)#VaI(A,)
CountD(ai, c) + #VaI(C)#Val(A) (
Oaic - COflD(C) (4.7)
CountD(C) +#Val(C)
CountD(C) #+ lC
0C ~ltN + #Val(C) (4.8)
This smoothing function insures that no instances arise that are classified with an absolute probability of 0 or 1. The last three equations are special cases of (4.5); (4.6) refers to the formula used when an attribute has another attribute as its parent in addition to the class, (4.7) is used when only the class node is the parent, and (4.8) is used for the probability of the occurrence of the class itself. From (4.1) we now have the necessary numbers to compute the probability for a given set of attributes. Missing attribute values are simply omitted from the calculation. This does not pose a problem since the value is omitted for all class values. This makes the algorithm more robust and resilient to noisy datasets.
4.3.3
TAN Multinets
Instead of creating a single TAN network structure for all classes, we can generate a different classifier for each class. This can produce better results if the relationships between the attributes and classes vary widely [23]. There is no added complexity since each training instance is only used a single time to build the model for the class it belongs to. As a result, the complexity for building a multinet with a training set of size N remains O(nr2N). The datasets we generated were run on both a single
TAN and a multinet approach since the different activities being recognized should be
influenced quite differently by the area-type attributes. Performance should therefore show an improvement using the multinet approach [14].
Chapter 5
Results and Analysis
5.1
Data Acquisition
Data was gathered using a consumer-grade GPS receiver attached to a PDA device.
GPS locations were recorded to a file as a user walked around the vicinity of the MIT
campus. After completing an action (i.e. arriving at work), the user would log the current time and the action that was just completed on paper. Although software was developed to allow the device to record data both continuously and at periodic intervals, only the continuous mode was used to gather the maximum amount of data over a short period of time. In this fashion, a week's worth of typical activity was gathered by a single user walking around with the outfitted PDA. This training set of 3307 instances was then transferred to a desktop computer and converted into attribute vectors using several methods described below. The trained system was also used to test data collected from other users to determine the effectiveness of the system in dealing with other user's routes.
A long term goal of this project is to be able to create a stand-alone system that
would require an initial training phase. To facilitate this, an experience sampling tool was developed to electronically log the actions of a user throughout the day at forty-five minute intervals, independent of GPS location data. We anticipate that the data gathered by this software could be helpful in training the system to a user's everyday habits when combined with location data. In addition to the current activity, the
program asks the user to note his present location to serve as a rough indicator of position. An program to solicit this data has many advantages over our previous paper system since we can control the frequency at which we request data from the user. Appendix A.2.4 contains additional details.
5.2
Features
All feature vectors incorporated the day of the week, the average speed traveled from
what was speculated to be the starting position, and the time of day as discretized attributes. Time was categorized as morning (6 am - 12 pm), afternoon (12pm -6pm), evening (6pm - 9pm), and night (9pm - 6am). When using discrete versions
of the data, the average speed was discretized into walking speed (less than 4 mph), running speed (less than 8 mph), biking (less than 15 mph), and motorized (anything greater than 15 mph). As the features are determined from the raw GPS data offline, additional features can be added later and tested on the various classifiers.
5.2.1
Single Point Distance
The first experiment evaluated each valid point recorded by the receiver by calculating the minimum distance to each of the 18 area types. This created a vector with 21 attributes. As each point is examined individually, no knowledge of the starting point or path is considered.
5.2.2
Changing Distances
The next set of experiments attempted to model how the distances change as a user approaches his destination. The training data was first separated into sets, each representing one trip from start to destination point (i.e. going to work begins at home and ends at the work place). The starting point that is referenced can be chosen as the first location that is recorded after a long period when the GPS is unable to receive a position. This indicates the user was inside or out of range of
the positioning satellites. Because we were explicitly training the system, the start position was noted by the user as indicated by when they recorded the action they were performing.
The first experiment (ADist(start)) took the starting position as a reference point and then calculated the minimum distances from this point to each of the 10 area types. For every other point in that trip, another set of minimum distances was taken, and the difference between this set and the reference set was calculated. For the discretized tests, a positive difference indicated that the subject was getting closer to an area, while a negative distance denoted the user was getting farther away. This metric is not entirely correct; for example, if the closest park to the start is now not the same park being referenced by the new location, the user may appear to be moving closer to a park area when this is not the case. As an alternate way of approaching this problem, we took the same difference but calculated the change in distance based on the most recently recorded point instead of the start point (ADist(prev)). Unfortunately, this method also has its oversights in that for two points taken very close in time, the change in distance may not vary by much and will be more sensitive to position error.
5.2.3
Trajectory
To take into consideration the path someone would take when traveling from source to destination, we applied a similar difference in distance for each place type but this time only account for those locations that lie ahead of the user's position. In other words, we look at the trajectory the user is taking in reference to some point about 30 seconds prior and then prune out any areas that are behind this point (Traj (w/pruning)). To do this, areas that completely lie behind the line perpendicular to a ray connecting the reference point and the current position that intersects the reference point are elided. The subset of areas considered was continuously pruned with each data point such that any area that ever lay behind the user was not considered. Unfortunately, noise in the data could eliminate areas that would be important for consideration. As a result, a second trial was run that did not consider any past events (Traj(no
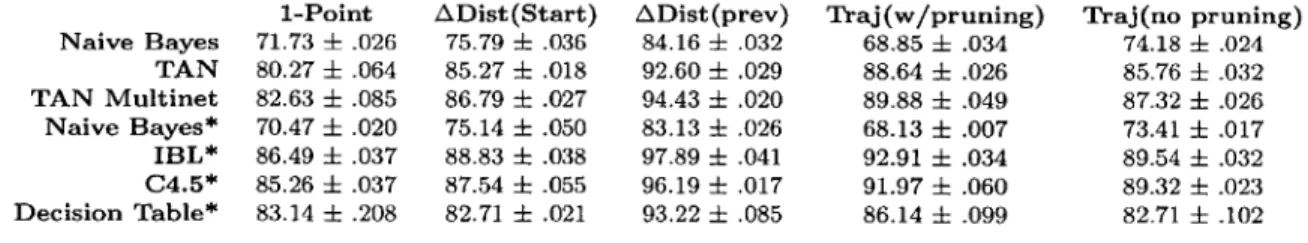
1-Point ADist(Start) ADist(prev) Traj(w/pruning) Traj(no pruning) Naive Bayes 71.73 .026 75.79 + .036 84.16 + .032 68.85 A: .034 74.18 i .024 TAN 80.27 ± .064 85.27 ± .018 92.60 ± .029 88.64 ± .026 85.76 ± .032 TAN Multinet 82.63 ± .085 86.79 ± .027 94.43 ± .020 89.88 ± .049 87.32 ± .026 Naive Bayes* 70.47 ± .020 75.14 ± .050 83.13 ± .026 68.13 ± .007 73.41 ± .017 IBL* 86.49 ± .037 88.83 ± .038 97.89 ± .041 92.91 ± .034 89.54 ± .032 C4.5* 85.26 ± .037 87.54 i .055 96.19 ± .017 91.97 ± .060 89.32 ± .023 Decision Table* 83.14 A .208 82.71 ± .021 93.22 ± .085 86.14 i .099 82.71 ± .102
Table 5.1: Summary of classifier results per feature set (mean t variance).
pruning)) - it considers only those areas in front of the user's trajectory but does not attempt to continuously refine this set.
5.3
Classification Results and Analysis
Experiments were run using both the TAN algorithm (single and multinet), a naive Bayes implementation that utilized the multinomial distribution, and several other competitive classifiers found in the Weka Machine Learning Algorithms Toolkit (see [40]). These include a naive Bayes implementations [17, 28], the decision table clas-sifier [31], instance-based learning (nearest-neighbor) clasclas-sifier [21, 2], and the C4.5 classifier [36]. Ten 10-fold cross-validations were performed using the Weka Toolkit to insure that the training set was partitioned equivalently for each algorithm test. Table 5.1 reflects the mean and variance for these ten trials.
5.3.1
Algorithm Results
The distance-change metric produces the highest classification results for all of the classifiers, with a predicted accuracy of 92% and 94% for the TAN and multinet
approaches, respectively. For each of the tests, the TAN algorithm performs between three to six percent behind the top classifier - instance based learning (IBL)- with the TAN multinet approach consistently performing one to two percent better than the single TAN implementation. This results from the attributes having varying relationships, depending on the class of concern. The TAN classifier outperforms both naive Bayes approaches by eight to ten percent for all experiments.
The single-point distance metric performs surprisingly well, suggesting that merely the distances from the different area types carries a reasonable amount of relevant information. Although locations are not uniquely labeled in that each instance rep-resents only a discretized distance from each of the area types, the classifiers are
capably able to identify the action intended by the user. It is important to note that the data reflects the habits of one particular person, which may explain why this simple metric works so well. The tendencies of people to follow the same route from source to destination is probably responsible for these results.
The instance-based learner (IBL) classifier relies on an n-dimensional distance
metric to classify new instances. The distance is calculated between the unknown instance and each of the training instances, predicting the class of the closest instance
as the class of the unknown [40]. The high performance of the IBL classifier over all experiments indicates that the data seems to cluster well over the vector space. The drawback of using the IBL approach in a real-time recognition algorithm arises when the training set becomes larger as each new instance must be compared to each
instance of the training set during the classification process. A Bayesian or decision-tree approach, such as the C4.5 classifier, may be preferable in that these algorithms invest more computation in the training process to allow for faster classification of new instances [40].
The C4.5 classifier also performs well, especially when continuous values are used for the features. This classifier belongs to the decision tree family of classifiers that creates a tree down which a path is traversed during the classification process. Gener-ating this tree requires calculGener-ating the optimum splits to cluster the training instances most effectively [40]. The inherent downsides of the algorithm result from the com-plexity involved in generating the decision tree. Heuristics are necessary to direct the
process to avoid overfitting the data. Dealing with missing values can also be prob-lematic resulting in some guesswork on the direction to follow down the decision tree [40]. The constraint on the number of dependencies in a TAN network places an ex-plicit limitation on the network structure. This helps to prevent overfitting the data, provided the training examples are well distributed [12]. In addition, missing values
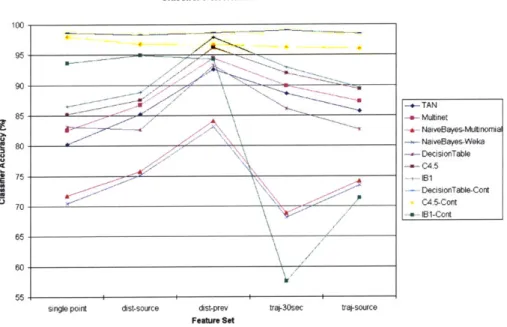
Classifer Performance on Feature Sets 100 90 % - er -e-TAN A -e-- Multinet -*- NaiveBayes-Multnomia: NaiveBayes-Weka DecisionTable C4.5 * 75 --+- 11 DecisionTable-Cont U 70 -- C4.5-Cont / -+-61-Cont 65 60 55
single point dist-source dist-prev traj-30sec traj-source Feature Set
Figure 5-1: A graph depicting the predicted classifier accuracy of each classifier for each dataset.
are simply omitted from the classification calculations - a simple and deterministic way of dealing with noisy data [40].
Although our version of the TAN classifier utilizes only discrete attributes, a version that handles continuous attributes exists and has shown to out-perform the discrete version [24]. To gauge the effectiveness of using continuous attributes, the Weka classifiers were tested on continuous versions of the datasets. As seen in Figure
5-1, the C4.5 and decision table classifiers perform very well on these tasks. This
is most likely because the partitions created when forming the structure of both the decision table/tree are more easily done with a range of values as opposed to two or three discrete values. For the same reason, this makes it harder for the IBL classifier because the instances do not cluster as tightly in the continuous case.
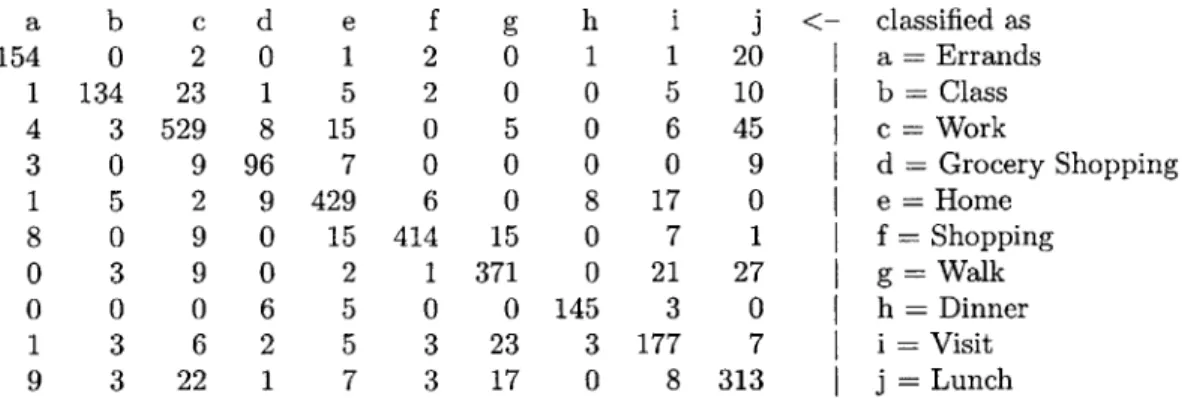
As would be expected, misclassified activities are often those that occur in the same general areas and are performed at around the same time of day (see table 5.2). As an example, an area with businesses commonly contain restaurants so someone could easily be going there to run errands or to eat lunch, both during the same time