Broad ion energy distributions in
helicon wave-coupled helium plasma
The MIT Faculty has made this article openly available.
Please share
how this access benefits you. Your story matters.
Citation
Woller, K. B. et al. “Broad Ion Energy Distributions in Helicon
Wave-Coupled Helium Plasma.” Physics of Plasmas 24, 5 (May 2017):
053513 © 2017 Author(s)
As Published
http://dx.doi.org/10.1063/1.4983315
Publisher
American Institute of Physics (AIP)
Version
Author's final manuscript
Citable link
http://hdl.handle.net/1721.1/117126
Terms of Use
Creative Commons Attribution-Noncommercial-Share Alike
Detailed Terms
http://creativecommons.org/licenses/by-nc-sa/4.0/
January, 2017
Plasma Science and Fusion Center
Massachusetts Institute of Technology
Cambridge MA 02139 USA
This work is supported by US DOE awards DE-SC00-02060 and DE-FC02-99ER54512.
Reproduction, translation, publication, use and disposal, in whole or in part, by or for the
United States government is permitted.
PSFC/JA-17-12
Broad ion energy distributions in helicon wave-coupled
helium plasma
1
Broad ion energy distributions in helicon wave-coupled helium
plasma
K. B. Woller,
1,a)D. G. Whyte,
1and G. M. Wright
11
Plasma Science and Fusion Center, MIT, 175 Albany St., Cambridge, Massachusetts, 02139, USA
Helium ion energy distributions were measured in the helicon wave-coupled plasma of the DIONISOS experiment with a retarding field energy analyzer. The shape of the energy distribution is double-peaked, characteristic of RF plasma potential modulation. The broad distribution is located within a radius of 0.8 cm while the quartz tube of the plasma source has an inner radius of 2.2 cm. The ion energy distribution rapidly changes from double-peaked to a single peak in the radius range of 0.7 to 0.9 cm. The average ion energy is approximately uniform across the plasma column including the double-peaked and single peak regions. The widths of the broad distribution, , in the wave-coupled mode are large compared to the time-averaged ion energy, . On axis (r = 0), / ≲ 3.4, and at a radius near the edge of the plasma column (r = 2.2 cm), / ~1.2. The discharge parameter space is scanned to investigate the effects of magnetic field, input power, and chamber fill pressure on the wave-coupled mode that exhibits sharp radial variation in the ion energy distribution.
I. INTRODUCTION
Helium ash is the ubiquitous by-product of fusion energy concepts, and tungsten is the leading candidate
material for plasma-facing components (PFCs) in the exhaust regions of fusion energy device designs.1 For the past
decade, the interaction between tungsten surfaces at elevated temperatures and helium plasma that results in
nanostructuring of the surface, called tungsten “fuzz”, has been studied to forecast the probability of developing
tungsten fuzz in future fusion experiments and reactors.2–4 For our contributions to the study of tungsten fuzz, we
have used a helicon plasma source. The capability of helicon plasma devices to reach high plasma density with low
electron temperature make them suitable for studying plasma-material interactions, such as the development of
tungsten fuzz, because they produce reactor-relevant particle fluxes with controllable ion energy. While using the
helicon wave-coupled (W) mode in the Dynamics of ION Implantation and Sputtering Of Surfaces (DIONISOS)5
linear plasma experiment to study tungsten fuzz, we observed that the surface response varied significantly with
radius on the target.6 The W mode used in these experiments has a peaked flux density profile and a fairly uniform
electron temperature across the radius, as is seen by others using helicon plasma sources.7 The layer thickness of
a)
2
tungsten fuzz on samples exposed to a flux density gradient has been shown elsewhere to be proportional to the flux
density through the resulting exposure fluence gradient.8,9 For samples exposed to the W mode of the DIONISOS
plasma, the thickest layer of tungsten fuzz would therefore be expected at the center of the sample where the flux
density is highest. Instead, the opposite occurred, with the surface remaining predominantly smooth, with only
sparse microscopic bundles of tungsten fuzz out to a certain radius of approximately 0.5 cm. Outside of this radius,
typical tungsten fuzz is present at layer thicknesses predictable from empirical growth models that are based on the
exposure fluence and sample temperature. The drastic change in the surface morphology on a single sample
motivated this study of the ion energy distribution in the plasma.
A uniform electron temperature across the radius of the plasma implies the plasma source is suitable for studies
that require uniform incident ion energy across the targets. However, the plasma potential can oscillate due to
radiofrequency (RF) excitation. From previous studies on helicon devices, the amplitude of plasma potential
oscillations is large in the capacitively-coupled (E) mode, with the peak-to-peak potential double the average
potential.10–13 With increasing the magnetic field or antenna power, the average potential and modulation amplitude
decrease when the plasma source transitions to the inductively-couple (H) mode. The plasma potential modulation
amplitude in the H mode is comparable to the average plasma potential.11 Increasing the magnetic field or input
power further increases the plasma density such that the dispersion relation for helicon wave propagation is satisfied,
and the plasma transitions to the W mode. The plasma potential decreases subtly through the H to W mode
transition.14 However, the plasma potential modulations in the W mode have not been discussed in the literature. In
this study, we show that the peak-to-peak plasma potential exceeds the average plasma potential by a factor of 2-4 in
the W mode under the conditions we have studied so far. We have shown elsewhere that the modulation in the
incident ion energy when using the W mode plasma was the cause of the differences in nanostructure growth.15 With
ion irradiation energies at or below the sputtering threshold for a given target, the modulation of the incident ion
energy provide new parameters to explore in plasma-surface interactions, modulated ion-induced adatom
production, modulated low energy sputtering yields, and, in general, the effect of RF sheaths on plasma-material
interactions which continues to be a topic of interest in fusion.
In this paper, we will give an overview of the diagnostics used to measure the plasma parameters in a
mid-power H mode and higher-mid-power W mode in the DIONISOS helicon plasma chamber. We will then show how the
3
function in the W mode, and discuss the nature of the suspected plasma potential modulation in context with theories
of helicon plasma discharge physics.
II. EXPERIMENT
A. DIONISOS plasma chamber
The DIONISOS plasma chamber is shown schematically in Fig. 1. A Nagoya Type III antenna, which has a
radius of 3 cm and a length of 11 cm, is supplied with radio-frequency (RF) power at fRF = 13.56 MHz and
surrounds a quartz tube into which the helium (He) gas is fed. Reflected power to the RF power supply is minimized
by tuning the capacitors in the impedance matching network and is typically 1% of the output power of the supply.
Four magnetic field coils immerse the plasma source and target chamber in a DC axial magnetic field that does not
vary by more than 1.5% per cm on the chamber axis, and not by more than 0.5% per cm across the diameter at the
axial location of the measurements made in this study. The device uses active cooling for the magnetic field coils
and RF circuit so that the plasma source can be operated continuously. Once the plasma reaches equilibrium
conditions, measurements are made at multiple radial locations. The plasma from the source region (x < -25 cm)
enters the target chamber, which has a radial bore radius of 10 cm. The axial magnetic field maintains the plasma
with a radius ~2.5 cm in the target chamber where plasma diagnostics and material targets can be placed. A target of
interest is usually mounted on a sample holder that extends into the plasma at an axial position 38 cm from the end
of the antenna. At this axial position, measurements of the plasma density (ne) and electron temperature (Te) are
made with a Double Langmuir Probe (DLP) and of the Ion Energy Distribution Function (IEDF) with a Retarding
Field Energy Analyzer (RFEA).
The measurements from these diagnostics were taken sequentially under reproducible discharge conditions. The
probe measurements were taken with a grounded target in place. Due to the size of the RFEA, the target holder was
removed during IED measurements. With the target holder removed, the plasma terminates partially on the
grounded housing of the RFEA probe and partially on the grounded vacuum chamber wall. The differences in the
4
FIG. 1. Schematic of the DIONISOS helicon plasma chamber showing the axial location of the Nagoya type III antenna with respect to the location of the target holder, Langmuir probes, and retarding field energy analyzer.
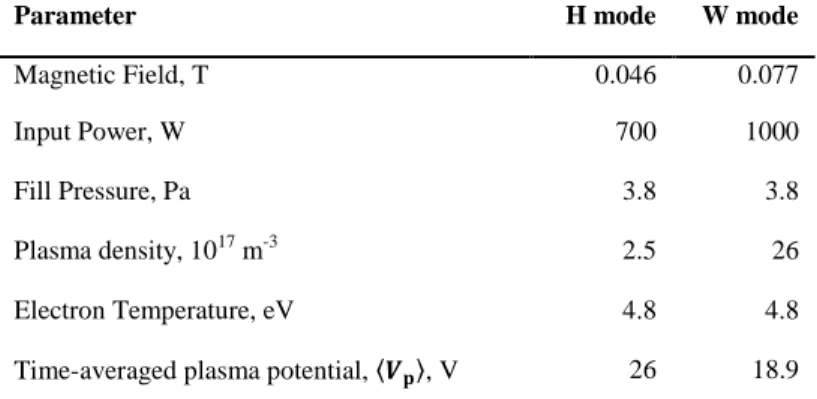
Both the H and the W mode used as baseline cases in this study were created with background neutral He gas
fill pressures of 3.8 Pa. The baseline H mode used 700 W of RF input power with a background magnetic field of
0.046 T, while the baseline W mode used 1000 W of the RF power with a larger magnetic field of 0.077 T. A
summary of the discharge conditions along with the measured values of the plasma parameters on the chamber axis
for these baseline H and W modes is given in Table I. The W mode is identified by the peaked ion flux density
radial profile and the bright emission of light at the axis to a radius of approximately 0.5 cm. Additionally, the
“double-peaked” IEDF within the bright axis region is shown to be characteristic of the high power, high magnetic field W mode. The H mode has an ion flux density gradient much lower than the W mode and uniform light
emission across the radius of the plasma column.
TABLE I. Summary of the conditions for the baseline plasma discharge cases used in this study.
Parameter H mode W mode
Magnetic Field, T 0.046 0.077
Input Power, W 700 1000
Fill Pressure, Pa 3.8 3.8
Plasma density, 1017 m-3 2.5 26
Electron Temperature, eV 4.8 4.8
5
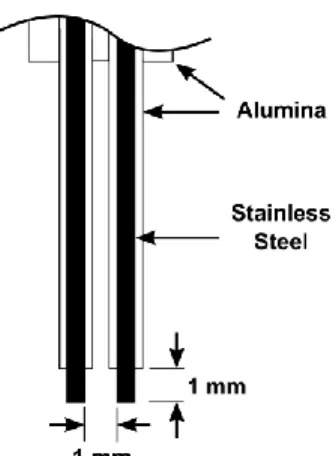
B. Double Langmuir ProbeThe DLP was made with 0.0508 cm diameter soft stainless steel rods. The tips extended 0.1 cm away from
individual alumina tubes and were separated by 0.1 cm, as shown schematically in Fig. 2. The DLP configuration
was used to measure the plasma density and temperature to avoid misinterpreting the current-voltage (I-V)
characteristic of an uncompensated single Langmuir probe in RF plasma. Although, RF rectification can lead to
errors in DLP interpretation in low density RF plasma, high density plasma with large ratio of probe radius to Debye
length are only weakly affected in the presence of RF sheaths.16 DLP characteristics were evaluated using the
equivalent resistance method.17,18 For the equivalent resistance method, if the probe is operating in a thin sheath
limit, which is valid when the Debye length,
, (1)
is small compared to the probe radius, rp, where is the permittivity of free space, is Boltzmann’s constant, and
e is the charge of an electron, the ideal current between the probe tips, I, is related to the voltage between the probes, V, by the function,
, (2)
where Ap is the surface area of one of the probe tips and mi is the mass of the ion. Eqn. (2) is valid under the
assumption that the ion gyro-radius is larger than the probe radius, which is satisfied here. By taking the first
derivative of this function with respect to V and evaluating at V = 0,
, (3)
where is the ion saturation current,
, (4)
showing the electron temperature is equal to half of the voltage obtained when the linear fit of the DLP I-V
6
FIG. 2. Double Langmuir probe configuration used to measure the plasma density and electron temperature under the various plasma discharge conditions.
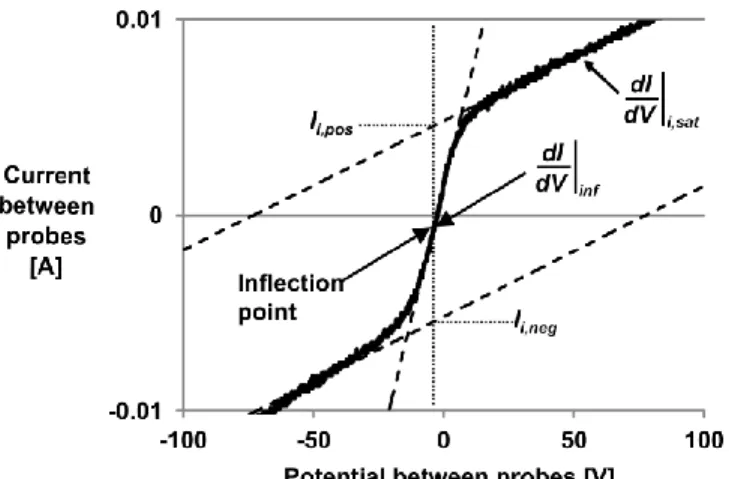
Experimental measurements often feature non-ideal DLP characteristics, so modifications to the equivalent
resistance method go further to account for offsets in the inflection point of the characteristic and also for ion
saturation currents that are proportional to the probe potential due to sheath expansion. The modified equivalent
resistance method of Chang and Laframboise18 gives the electron temperature as
, (5)
where is the current intercept of the linear fit to the positive ion saturation region at the inflection point
potential, is the current intercept of the linear fit to the negative ion saturation region at the inflection point
potential,
is the slope of the linear fit at the inflection point, and
is the slope of the linear fit to the ion
saturation region. A detailed diagram of an example DLP characteristic and linear fits is shown in Fig. 3. Once the
electron temperature is determined with Eqn. (5), the plasma density is calculated with Eqn. (4), with
.
With the plasma density and electron temperature determined from the DLP characteristic, the Debye length
was calculated and compared to the probe radius. For the measurements made in this study, the smallest ratio of the
probe radius to the Debye length, rP/D, was the order of 1 for the E mode where the plasma density was typically
1016 m-3 or lower. For the H and W modes of interest in this paper, the ratio was of the order of 10. Thus, the
assumption that the DLP was operating in the thin sheath limit is valid for the investigation of the H and W mode
7
FIG. 3. An example diagram of the double Langmuir probe I-V data along with the linear fits to the ion saturation regions and to the inflection point region. The values of the slopes and the current intercepts of the ion saturation fits at the inflection point potential are used to calculate the plasma density and electron temperature using Eqns. (4) and (5), respectively.
C. Retarding Field Energy Analyzer
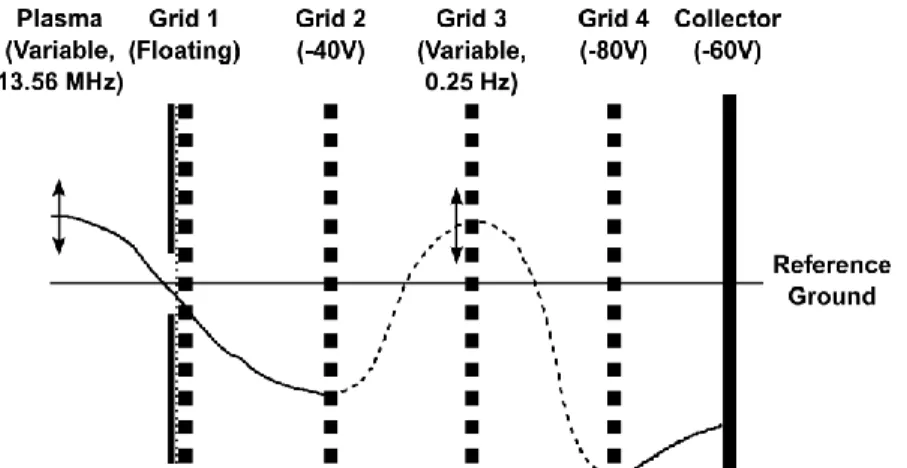
A conventional four-grid RFEA19 was used to measure the IEDF at separate radial positions at the same axial
position as the target holder. A diagram of the RFEA grid bias settings is shown in Fig. 4. The biasing scheme of the
RFEA was chosen to minimize various artifacts that arise in RFEA I-V traces due to stray electrons20. The grid
facing the plasma, grid 1, was at the floating potential of the plasma so that the RFEA was analyzing neutral plasma.
Then, the RFEA was used for ion collection by biasing grid 2 negative with respect to the floating potential to shield
out the plasma electrons energetic enough to overcome the potential barrier between the plasma potential and the
floating potential. A voltage ramp was applied to grid 3 to selectively repel the ions in the analyzer entering the
RFEA. Grid 4 was biased negatively to repel secondary electrons generated at grid 3 and at the collector plate from
affecting the ion current measured on the collector. Finally, the collector was biased negatively to collect the ions
transiting the RFEA. The current measured on the collector as the retarding potential of grid 3 is varied gives the
amount of plasma ion flux that possesses an energy equal to or greater than the potential difference between the
plasma and grid 3.
The grid aperture size of the stainless steel grids of the RFEA was 152 μm. The smallest calculated Debye
length in the plasmas examined was approximately 10 μm. Typically, the aperture size should be no bigger than
twice the sheath thickness, so that the plasma is properly screened out of the analyzer. The thickness of the sheath
can be approximated from the Child-Langmuir space-charge limited current density,
8
FIG. 4. Potential diagram in the RFEA for this study. The grid aperture size is 152 μm and the space between the grids is 635 μm. The grids and collector plate are made from 127 μm thick stainless steel foil. Grid 1 was covered with a tungsten mesh with aperture size of 40 μm. Since the grid transmission coefficient is 0.26 and the entrance slit was limited to 500 μm, the grids were aligned during assembly to maximize the collector current signal.
where is the space-charge limited current density supplied by the plasma, is the potential difference in
the sheath, and is the sheath thickness. Taking the current density as that satisfied by the Bohm criterion,
, (7)
where cs is the ion sound speed
. (8)
Setting and solving for leads to an expression that gives the approximate sheath thickness in terms of the Debye length,
. (9)
So, the sheath thickness with no external bias applied to grid 1 is about 2 to 3 times larger than the Debye length.
Then, the aperture diameter should be no larger than 4 to 6 times the Debye length to fully shield out the plasma
from the RFEA. However, this criterion is not met by the floating grid for the highest density plasmas used in this
study. The situation is alleviated in two ways by sheath expansion that occurs between grid 1 and grid 2. First, the
grids have a transmission coefficient of 0.26, so the plasma density in the space between grid 1 and grid 2 is
decreased by a factor of 4, assuming the plasma beamlets expand in the space between grid 1 and 2. Decreasing the
plasma density by a factor of 4 increases the Debye length by a factor of 2, doubling the sheath thickness. Second,
the potential difference between grid 1 and grid 2 is approximately 40 V, which increases the sheath by another
factor of 20 to 30 (see Eqn. (9)), depending on the electron temperature. Therefore, the plasma should be adequately
9
25 μm thick tungsten mesh was 40 μm, meeting the requirement for adequate shielding of the plasma from the
RFEA. The stainless steel mesh then acted as a scaffold for the tungsten mesh. A slit with dimensions of 0.05 cm in
the radial direction and 0.1 cm in the azimuthal direction with respect to the plasma device coordinate system was
cut in molybdenum foil and placed over the tungsten mesh to hold it in place and to serve as the entrance slit to the
RFEA.
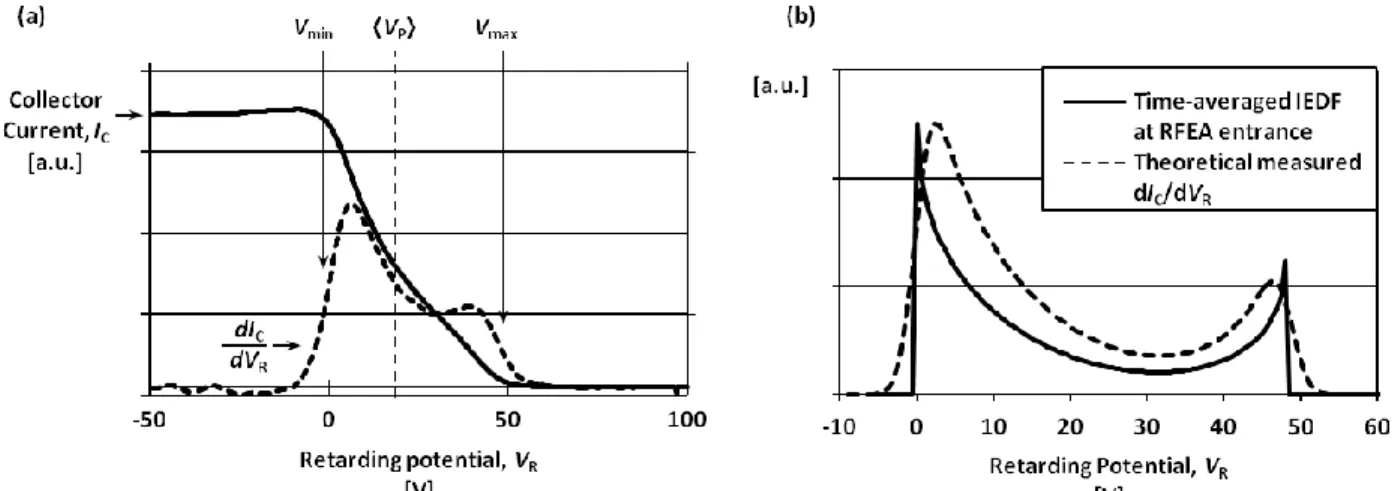
The ion current collected by the RFEA at r = 0 for the W mode versus the retarding potential of grid 3 is shown
in Fig. 5(a). The IEDF represented by the first derivative of the RFEA I-V characteristic is also shown as the dashed
line in Fig. 5(a). The ramp rate of the potential on grid 3 was 0.25 Hz, which is much slower than fluctuations in the
plasma potential. Periodic oscillations in the plasma potential result in a broadened and double-peaked IEDF, since
the potential spends more time in the vicinity of its maximum and minimum. The peak separation is proportional to
the peak-to-peak value of the plasma potential, if the oscillations are sinusoidal. As can be seen in Fig. 5(a), the
magnitudes of the peaks in the distribution are uneven, indicating the plasma potential waveform is not perfectly
sinusoidal, and may be closer to a half-wave.21 Also, the width of the rise on either side of the collector current
derivative from zero to the peak is on the order of 5 V, which would indicate that the ion temperature would be on
the order of 2.5 eV, which is unlikely for helicon plasma sources, which typically have ion temperatures less than
0.1 eV.22 It is more likely that the resolution of the RFEA is on the order of 2.5 V. The IEDF is the convolution of
the RFEA transfer function, which would be similar to a normal distribution with a full-width half-maximum of 2.5
V, and the time-averaged IEDF entering the RFEA from the plasma. The convolution elongates the minimum and
maximum edges of the true IEDF, and decreases the separation of the peaks. This is shown as an example in Fig.
5(b). Thus, we take the minimum and maximum energies of the IEDF from the measurement as the half-widths of
the minimum and maximum slopes, as annotated in Fig. 5(a).
The IEDF measured with the RFEA might not represent the local plasma potential and its oscillations due to
several possible effects which we now examine. One possible mechanism that would give rise to lower energy peaks
in the IEDF would be from collisions in the RFEA that would decrease the energy of ions entering the analyzer.
However, the mean-free-path for charge exchange collisions between ions and neutral gas atoms is approximately
10-2 m for the neutral He gas pressure of 3.8 Pa, assuming the gas is at room temperature. The spacing between the
grids of the RFEA is 6.35 x 10⁻⁴ m, so charge exchange collisions in the analyzer have a very low probability of
10
FIG. 5. (a) Plots of the I-V characteristic measured on the collector of the RFEA positioned on the axis of the W mode (solid line) and its first derivative (dashed line), showing the IEDF at this location. (b) Plot of a theoretical time-averaged IEDF characteristic of a half-wave plasma potential modulation before entering the RFEA (solid line) and as measured on the RFEA collector (dashed line). The broadening due to the RFEA instrument was modeled as a normal function with a variance of 2.5 V.
Another mechanism could be that ions lose parallel momentum and be lost when they collide with the structure
of the RFEA. The loss of directivity of the ions would affect the magnitude of the upper potential peak, but would
not necessarily give rise to a population of lower energy ions at a common energy, which is what is shown in the
IEDF data. Even so, we have considered the ion collision time for the H and W mode discharges. The ion collision
time is inversely proportional to the energy of the ion, so the shortest ion collision time would be for the least
energetic ions. The shortest ion collision time for 5 eV ions is on the order of 10-4 s. The average ion transit time
through the sheath is given by Charles13 as
. (10)
The longest ion transit time would occur for the highest potential difference across the sheath over grid 1, since the
sheath thickness expands as the potential increases, as in Eqn. (9). For a test ion at 50 eV, with the electron
temperature at 5 eV, the ion transit time across the sheath is 10-9 s. Therefore, the probability of momentum
exchange collisions between ions is negligible.
Yet another possible mechanism that would distort RFEA results is that electron impact ionization could also
occur in the vicinity of the RFEA entrance and also inside the RFEA from secondary electrons released from the
grids or the collector. This would generate ions at various locations inside the RFEA with varying energies upon
collection. The first ionization energy for He atoms is approximately 25 eV, which could be possible if the ion
11
pressure of 3.8 Pa, and taking the ionization cross section as 10-20 m2, the ionization mean-free-path is 0.1 m, which
is much larger than the RFEA.
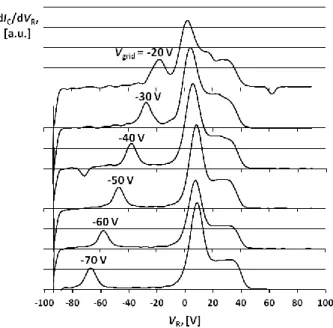
An experimental validation of the RFEA in the W mode was conducted to ensure the reliability of the IEDF
measurement. Grids 2-4 were removed so that there is only grid 1 and the collector operating in the RFEA. In this
configuration, a DC bias is applied to grid 1to screen out the plasma electrons while the potential on the collector is
swept. The secondary electrons generated in the RFEA are expelled out from grid 1 when the collector potential
becomes more negative than the potential on grid 1. A plot of dIC/dVR for current measured in the W mode on the
collector for various DC potentials applied to grid 1 is shown in Fig. 6 at r = 0.4 cm. The shape of the broad IEDF
hardly changes as the grid 1 potential is varied. An additional peak in the IEDF at the grid 1 potential is due to the
secondary electrons that are lost from the RFEA as the collector potential sweeps more negative than the grid 1
potential. The peak is of the same sign as the ion current because the current of the secondary electrons leaving the
RFEA are of the same sign as the current of ions entering the RFEA. As the potential on grid 1 is made more
negative, the ions from the plasma are entering the RFEA with much higher energy. This would have an effect on
the measured IEDF if collisions or ionization were present at non-negligibile levels. As can be seen from Fig. 6, the
IEDF remains mostly the same at each grid 1 setting.
FIG. 6. Plots of dIC/dVR versus VR for the grid-collector configuration of the RFEA where grids 2-4 are removed. Different DC
potentials are applied to grid 1 and the current to the collector is measured as the potential on the collector is swept. The ion contribution of the current measured on the collector does not change, while the secondary electron contribution changes with the grid 1 potential setting.
12
We conclude that the mechanisms that could “distort” the RFEA measurements are negligible. Therefore, we can safely assume that the broad IEDFs, represented by the derivative of the collector current as illustrated in Fig. 5, are
representative of the real plasma potential oscillations. If the ion transit time through the sheath is longer than the RF
period, the ion experiences an average potential that is dependent on the phase when the ion enters the sheath.13
Averaging over the oscillating potential changes the IEDF by decreasing the separation of the two peaks in the
distribution. As the ion transit time becomes much longer than the RF period, the ion would attain an energy more of
on the order of the time-averaged plasma potential once it enters the RFEA. Therefore, to estimate the true extent of
the plasma potential swing, the ion inertia effects in the RF sheath have to be addressed. The average ion transit time
from Eqn. (1) multiplied by the frequency of the plasma potential oscillations, , is a metric of the influence of
the averaging effects from ion inertia. We assume the plasma potential oscillation frequency to be the same as the
source antenna frequency, 13.56 MHz. If the oscillations in the plasma potential are sinusoidal, the ratio of the
separation in potential of the peaks in the IEDF, , to the energy equivalent of the peak-to-peak RF
plasma potential is given13 as
. (11)
The values of RF·av in the W modes studied here range from 0.86 to 0.99 and in the H modes, 0.92 to 0.98.
Thus, if there were sinusoidal plasma potential oscillations, they would be shown in the IEDF measurement.
Therefore, the potential difference between the peaks, or edges, in the IEDF, ΔE, is indicative of the presence and
magnitude of plasma potential oscillations in the various modes of operation in the DIONISOS helicon plasma
13
III. RESULTS AND DISCUSSIONA. Inductively- and wave-coupled mode profiles
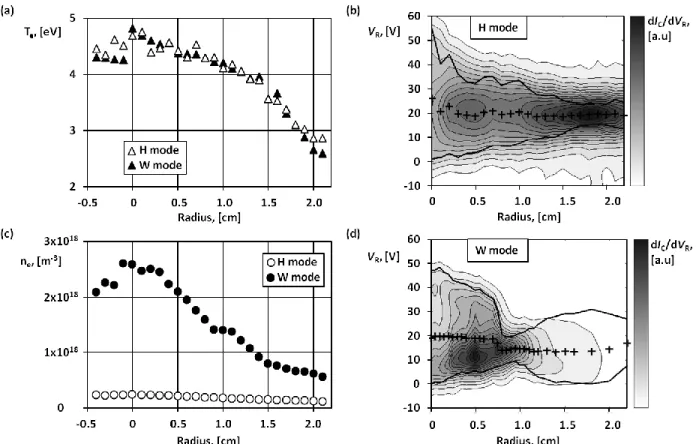
The radial profiles of the electron temperature and plasma density measured from the DLP are shown in Fig. 7(a)
and 7(c), respectively, for the baseline H and W mode. The electron temperature for both discharges is very similar
and is approximately 5 eV at r = 0 with a gradual taper to 3 eV at the edge of the plasma, r = 2.2 cm. The main
difference between the H and W mode that is shown through the DLP is through the magnitude of the density. The
density in the W mode is a factor of 10 larger than in the H mode. Also, the density gradient is an order of
magnitude larger in the W mode than in the H mode. The highly peaked density profile is a signature of the W mode
in helicon devices.7
The changes in the IEDF with respect to radius for the H and W modes are shown in Fig. 7(b) and 7(d),
respectively. The contour plot depicts the derivative of the collector current, dIC/dVR, which is proportional to the
IEDF, versus the retarding potential, VR, which is equivalent to the ion energy for singly charge ions, and radius.
The magnitude of the derivative of the current for Fig. 7(b) is a factor of 10 lower than for Fig. 7(d). The plot of
dIC/dVR for each radius was analyzed for the three values of Vmin, Vmax, and Vp , as illustrated in Fig. 5(a). The
minimum and maximum potentials at each radius are shown by solid lines, while the average potential is shown as a
cross for each radius. Unlike the density and electron temperature, the IEDF with respect to radius has vastly
different behavior between the H and W modes. The IEDF for the W mode is double-peaked at the center, with a
minimum and maximum potential difference of 47 V at r = 0. The double-peaked character of the IEDF continues
out to a radius r = 0.8 cm, where the distribution suddenly shifts to a single peak. The width of the single peak is 6
V, which is close to the resolution of the RFEA, as discussed in section IIC. For r > 0.8 cm, the width of the single
peak increases until it becomes 30 V at r = 1.8 cm. The IEDF at each radius in the H mode has only one distinct
peak. However, the width of the “peak” at r = 0 is very broad at 50 V. The width gradually decreases with increasing radius, until the width is 8.5 V at r = 2.0 cm.
A broad IEDF has been observed by Kim and Chang10 in similar H mode discharges, in which they interpreted
the IEDF as a single broad peak. We believe the IEDF is still representative of large peak-to-peak plasma potential
swings that are periodic in time, but the peaks are not distinguishable. The new observation we are focused on here
is that in the W mode discharge with He, the IEDF is clearly double-peaked, with peak-to-peak potentials up to a
14
the plasma. The restriction of the location of the double-peaked IEDF to r < 0.8 cm coincides with the higher
density, where the helicon dispersion relation can be satisfied for good wave coupling, and the maximum in the
density gradient, which may set up a potential well to trap the helicon wave and enhance coupling, as for the radially
localized helicon (RLH) mode.23
FIG. 7. (a) Electron temperature and (c) plasma density profiles measured with a double Langmuir probe across the radius of the H and W mode in helium with discharge conditions given in Table I. (b) and (d) Contour plots of dIC/dVR with respect to
retarding potential and radius in the H and W mode, respectively. The solid lines mark the minimum and maximum edges of the dIC/dVR curves and the average plasma potential is shown as the cross points. The measurements were taken at an axial location
38 cm from the end of the helicon antenna. The radius of a typical target and the helicon source quartz tube are 1.27 cm and 2.2 cm, respectively.
15
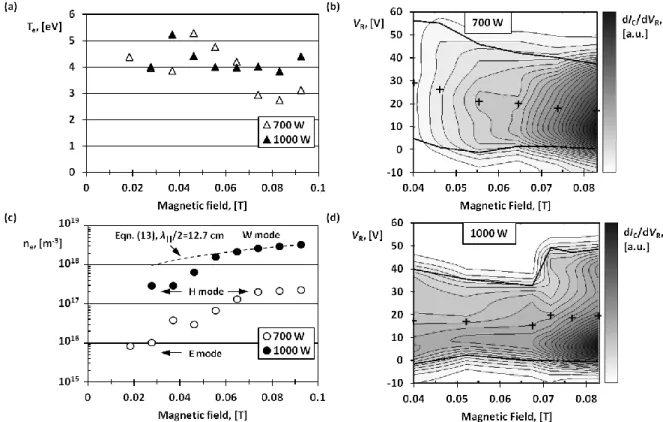
B. Mode transitions with respect to magnetic fieldIt is well-known empirically that the presence of H or W mode is affected in helicon devices by the axial
magnetic field strength. The measurements made as the magnetic field is varied are shown in Fig. 8 for two values
of input power, 700 W and 1000 W, and for the chamber fill pressure of 3.8 Pa. The electron temperature, shown in
Fig. 8(a), as well as the density, shown in Fig. 8(c), have larger relative changes when the plasma is transitioning
between modes. The transitions are accompanied by varied changes in the IEDF measurements, as well, shown in
Fig. 8(b) and 8(d) for the 700 W and 1000 W case, respectively. The electron temperature decreases and the density
increases the fastest for magnetic fields between 0.04 T and 0.06 T for both input powers. The width of the
distributions, ΔE = Vmax - Vmin, also decrease in this magnetic field interval. As is annotated in Fig. 8(c), for magnetic
fields lower than 0.04 T at 700 W, the plasma is in the low density E mode. In this mode, the plasma is tenuous
enough for the fields of the antenna to penetrate the plasma. This is because the skin depth, δ, is large compared to
the radius of the plasma, a. The skin depth, for ωRF ≪ ωpe, is approximated14 as
(12)
for a collisionless plasma, where c is the speed of light in vacuum, ωpe is the electron plasma frequency, me is the
electron mass, and μ0 is the permeability of free space. As the magnetic field increases, so does the density, which
means the skin depth decreases. Once the density reaches a value of approximately 2 x 10¹⁷ m-3, the density no
longer increases with increasing magnetic field. The skin depth, using Eqn. (12), corresponding to this plasma
density is approximately 1.2 cm, while the plasma radius is 2.2 cm. This in agreement with the result of Kaeppelin et
al. which showed that once the skin depth becomes about half of the plasma radius, the plasma mode has
transitioned from a capacitively-coupled E mode to the inductively-coupled H mode.14
The plasma density of the H mode at 700 W is identical to the density of the H mode at 1000 W, but the H mode
exists at a much lower magnetic field for the higher input power case, shown in Fig. 8(c). The electron temperature
is slightly higher in the H mode for the higher input power case. As the magnetic field is increased with the input
power at 1000 W, the electron temperature decreases, which is similar to the behavior shown for the E to H mode
transition at 700 W. At 1000 W, when the magnetic field is greater than 0.07 T, the plasma transitions fully to the W
mode. The new mode is clearly shown in Fig. 8(d) by the change in the IEDF to the double-peaked distribution
discussed in section IIC. The value of the density at the H to W mode transition is indicative of a transition to
16
variation in the cold plasma whistler wave dispersion, and subsequently verified with experiments,25,26 satisfies the
relation,
, (13)
where k|| is the wave number parallel to the background magnetic field and ωce is the electron cyclotron frequency.
The frequency of the wave is approximately equal to the driving frequency of the antenna 13.56 MHz, and the
parallel wave number is dependent on the length of the antenna and the distance between the conducting boundaries.
Thus, the dispersion relation for the RLH wave, Eqn. (13), couples the magnetic field, from ωce, to the density,
through ωpe. For parallel wave number k|| = π/la, and the magnetic field 0.07 T, the plasma density that satisfies Eqn.
(13) is 3.3 x 10¹⁸ m-3, which is very close to the value measured with the DLP, 2.7 x 10¹⁸ m-3. A fit to Eqn. (13)
using the top four points of the experimental data of the density in the W mode in Fig. 8(c) results in a parallel
wavelength of 12.7 cm, while the antenna length is roughly 11 cm. Also, as can be seen in Fig. 8(c), the trend ne ∝ B
holds very well for these.
FIG. 8. (a) The electron temperature and (c) plasma density measured at different magnitude fields with an input power of 700 W (open triangle, open circle) and 1000 W (solid triangle, solid circle). A fit to Eqn. (13) using the top four W mode data points is shown as the dashed line. Also shown are contour plots of dIC/dVR with respect to retarding potential and magnetic field for input
powers of (b) 700 W and (d) 1000 W. The solid lines mark the minimum and maximum edges of the dIC/dVR curves and the
17
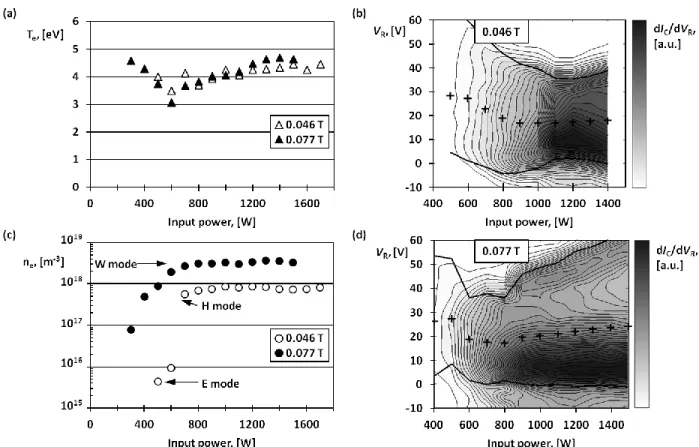
C. Mode characteristics with respect to input powerThe measurements made as the input power is varied are shown in Fig. 9 for two values of magnetic field, 0.046
T and 0.077 T, and for the chamber fill pressure of 3.8 Pa. The mode transitions from E to H mode at 0.046 T and H
to W mode at 0.077 T as the input power is increased are clear, shown by the electron temperature and plasma
density in Fig. 9(a) and 9(c), respectively. Again, during the mode transitions, the electron temperature decreases,
and the density increases sharply. At 0.046 T, the E mode is characterized by low plasma density and large ΔE,
shown in Fig. 9(b). The wide IEDF at low input power is a characteristic of the capactively-coupled E mode in
helicon plasma devices.11 While the plasma is in the H mode, as the input power is increased, the density continues
to increase and the potentials decrease.
At 0.077 T, the plasma transitions from H to W mode near the an input power of 900 W, shown in the IEDF
measurements in Fig. 9(d). The potential difference between the two well-defined peaks in the IEDF for the W mode
increases as the input power increases, without very much change in the density. The electron temperature also
increases with increasing input power along with the increasing potentials. The increase in ΔE is much greater than
the increase in electron temperature and Vp . The density does not increase by very much in the W mode and the
device geometry and magnetic field are fixed, so the density profile (i.e. the density gradient) does not change very
much either. Upon measuring the radial variation in the W mode at 1200 W and 1400 W, it was found that the radius
at which the distribution transitions from double-peaked to a single peak was almost identical to the W mode at 1000
W, shown in Fig. 7(d). Thus, once the plasma is in this W mode, with density more or less fixed by the dispersion
relation Eqn. (13), the extra power that is absorbed increases the plasma potential. This indicates that it may be
crucial to measure the IEDF in helicon plasma devices to fully understand the possible interactions the plasma will
18
FIG. 9. (a) The electron temperature and (c) plasma density measured at different values of input power with a magnetic field of 0.046 T (open triangle, open circle) and 0.077 T (solid triangle, solid circle). Also shown are contour plots of dIC/dVR with
respect to retarding potential and input power for magnetic fields of (b) 0.046 T and (d) 0.077 T. The solid lines mark the minimum and maximum edges of the dIC/dVR curves and the average plasma potential is shown as the cross points. The chamber
fill pressure was 3.8 Pa for all measurements in these plots.
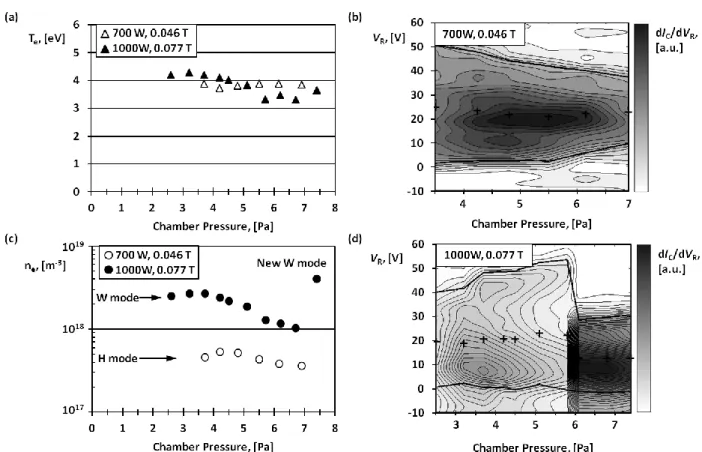
D. Mode characteristics with respect to chamber pressure
Measurements made as the chamber pressure is varied are shown in Fig. 10 for the two combinations of
magnetic field and input power used for the H and W modes listed in Table 1 and discussed in section IIIA. As the
chamber pressure increases, or, similarly, as the collision frequency increases, the two modes have similar behavior
in terms of electron temperature and density, shown in Fig. 10(a) and 10(c), respectively. The electron-neutral
collision frequency, νen, in He with a pressure of 3.8 Pa is approximately 60 MHz for an electron temperature of 4
eV,27 while the electron-ion collision frequency, νei, is approximately 2 MHz and 11 MHz for plasma densities of 0.5
x 1018 m-3 and 2.5 x 10¹⁸ m-3, respectively, and a Coulomb logarithm of lnΛ = 12, assuming a Maxwellian electron
distribution.28 Power loss due to radiation from the excitation of neutral gas is proportional to the neutral gas
pressure, resulting in lower power absorption in the plasma for fixed input power.24 This might account for the
19
FIG. 10. (a) The electron temperature and (c) plasma density measured at different values of chamber fill pressures with a combination of input power and magnetic field of 700 W, 0.046 T (open triangle, open circle) and 1000 W, 0.077 T (solid triangle, solid circle). Also shown are contour plots of dIC/dVR with respect to retarding potential and chamber fill pressure for
input power and magnetic field combinations of (b) 700 W, 0.046 T and (d) 1000W, 0.077 T. The solid lines mark the minimum and maximum edges of the dIC/dVR curves and the average plasma potential is shown as the cross points.
For the W mode, Coulomb collisions are more frequent due to higher density, enabling wave coupling to the
plasma. Although Coulomb collisions have been shown to dominate wave coupling,29,30 the wave absorption is
competing against the radiative power loss. Also, even though the ionization rate is a small portion of the overall
electron collision rate, it drops off precipitously as the electron temperature decreases.27 The small decline in
electron temperature seen in Fig. 10(a) means the ionization rate decreases, as well, which results in a lower plasma
density. Also, as the chamber pressure increases, ΔE increases, shown in Fig. 10(d). The increase in ΔE is a
consequence of the decrease in plasma density, since the power to the ions is proportional to the product of the
plasma density and the plasma potential.14,27 The modest increase in plasma potential, even for a factor of 2 decrease
in the plasma density, may be due to the shared power balance among the electrons, ions, and neutrals.
For chamber pressure greater than 6 Pa, the plasma transitions to a higher density W mode. This particular W
mode is characterized by an IEDF that is narrow and appears to have one peak, shown in Fig. 10(d). For resonant
20
frequency, νe = νen + νei. The collision frequency increases with increasing chamber pressure, even though the plasma
density decreases, because the neutral collisions dominate over Coulomb collisions. The higher density W mode,
may be due to more favorable coupling to a higher mode number wave for shorter damping lengths. For higher
order modes, with shorter damping lengths, the wave number would be higher, and, according to Eqn. (13), the
plasma density would be higher, for a fixed magnetic field. Though this is a qualitative explanation for the plasma
behavior, a more detailed investigation of the power balance in the resonant W modes that exhibit the double-peaked
and “monoenergetic” IEDF is left for future work.
IV. SUMMARY
The resonant helicon wave-coupled W mode of the DIONISOS plasma source when using helium exhibits
plasma potential oscillations, shown by measurements made with a retarding field energy analyzer. The plasma
potential oscillations vary radially in the plasma, with larger oscillation amplitudes on axis. The double-peaked
IEDF transitions to a “monoenergetic” IEDF at a radius r = 0.8 cm, while the inner radius of the quartz tube of the
source is r = 2.2 cm. Discharge parameters were varied to study the behavior of the double-peaked IEDF in the W
mode. Radial variations in both the ion energy distribution and the ion flux density make the W mode of the helicon
source challenging to work with for plasma-surface interaction research. However, once these properties are
understood, the radial variation can provide a means to study multiple irradiation conditions in a single exposure, if
the surface analysis diagnostic used can achieve spatial resolution that is much less than the characteristic change in
the plasma behavior. Therefore, this work provides key new insights to understand plasma-material interactions in
helicon-source linear plasma devices. Since most fusion reactor designs use RF heating soruces that couple through
the boundary plasma, this also points to the need to understand RF-driven modifications to ion energy distributions
in confinement devices.
ACKNOWLEDGMENTS
This work is supported by US DOE awards DE-SC00-02060 and DE-FC02-99ER54512.
REFERENCES
1 J. Knaster, A. Moeslang, and T. Muroga, Nat. Phys. 5, 424 (2016).
2 S. Takamura, N. Ohno, D. Nishijima, and S. Kajita, Plasma Fusion Res. 1, 51 (2006).
3 S. Kajita, W. Sakaguchi, N. Ohno, N. Yoshida, and T. Saeki, Nucl. Fusion 49, 95005 (2009).
21
Nucl. Fusion 52, 42003 (2012).
5 G.M. Wright, H.S. Barnard, L.A. Kesler, E.E. Peterson, P.W. Stahle, R.M. Sullivan, D.G. Whyte, and K.B. Woller,
Rev. Sci. Instrum. 85, 23503 (2014).
6 K. Woller, D. Whyte, and G. Wright, in 2015 IEEE 26th Symp. Fusion Eng. (IEEE, 2015), pp. 1–6.
7 F.F. Chen, Plasma Sources Sci. Technol. 24, 14001 (2015).
8
G. De Temmerman, K. Bystrov, J.J. Zielinski, M. Balden, G. Matern, C. Arnas, and L. Marot, J. Vac. Sci. Technol.
A Vacuum, Surfaces, Film. 30, 41306 (2012).
9 S. Takamura and Y. Uesugi, Appl. Surf. Sci. 356, 888 (2015).
10 J.-H. Kim and H.-Y. Chang, Phys. Plasmas 3, 1462 (1996).
11 A. Perry, G. Conway, R. Boswell, and H. Persing, Phys. Plasmas 9, 3171 (2002).
12 M. Wiebold, Y.T. Sung, and J.E. Scharer, Phys. Plasmas 19, 1 (2012).
13 C. Charles, A.W. Degeling, T.E. Sheridan, J.H. Harris, M.A. Lieberman, and R.W. Boswell, Phys. Plasmas 7,
5232 (2000).
14
V. Kaeppelin, M. Carrère, and J.B. Faure, Rev. Sci. Instrum. 72, 4377 (2001).
15 K.B. Woller, D.G. Whyte, and G.M. Wright, in 22nd Int. Conf. Plasma Surf. Interact. Control. Fusion Devices
(PSI 22) (Rome, Italy, 2016).
16 J.F. Caneses and B. Blackwell, Plasma Sources Sci. Technol. 24, 35024 (2015).
17 E.O. Johnson and L. Malter, Phys. Rev. 80, 58 (1950).
18 J.-S. Chang and J.G. Laframboise, J. Phys. D. Appl. Phys. 9, 1699 (1976).
19 E.V. Heubel and L.F. Velasquez-Garcia, J. Microelectromechanical Syst. 24, 1355 (2015).
20 C. Böhm and J. Perrin, Rev. Sci. Instrum. 64, 31 (1993).
21 E.Y. Wang, N. Hershkowitz, T. Intrator, and C. Forest, Rev. Sci. Instrum. 57, 2425 (1986).
22 C.M. Franck, O. Grulke, A. Stark, T. Klinger, E.E. Scime, and G. Bonhomme, Plasma Sources Sci. Technol. 14,
226 (2005).
23 B.N. Breizman and A. V. Arefiev, Phys. Rev. Lett. 84, 3863 (2000).
24 A. V. Arefiev and B.N. Breizman, Phys. Plasmas 11, 2942 (2004).
25 G. Chen, A. V. Arefiev, R.D. Bengtson, B.N. Breizman, C.A. Lee, and L.L. Raja, Phys. Plasmas 13, 123507
22
26 C.A. Lee, G. Chen, A. V. Arefiev, R.D. Bengtson, and B.N. Breizman, Phys. Plasmas 18, 13501 (2011).
27 M.A. Lieberman and A.J. Lichtenberg, Principles of Plasma Discharges and Materials Processing (John Wiley &
Sons, Inc., Hoboken, NJ, USA, 2005).
28 J.D. Huba, NRL Plasma Formulary (Washington, DC, 2004).
29 F.F. Chen, I.D. Sudit, and M. Light, Plasma Sources Sci. Technol. 6, 173 (1996).
30