A Costing Model to Assess Customer Profitability within Li & Fung
by
David Semko
B.S. Biomedical Engineering and Electrical Engineering, Duke University, 2006
M.S. Electrical Engineering, Naval Postgraduate School, 2007
Submitted to the MIT Sloan School of Management and the Engineering Systems Division in Partial Fulfillment of the Requirements for the Degrees of
Master of Business Administration and
Master of Science in Engineering Systems
In conjunction with the Leaders for Global Operations Program at the Massachusetts Institute of Technology
June 2016
2016 David Semko. All rights reserved.
MASSACHUSETTS INSTITUTE
OF TECHNOLOGY
JUN 0
8
2016
LIBRARIES
ARGIIVE.8
The author hereby grants to MIT permission to reproduce and to distribute publicly paper and electronic copies of this thesis document in whole or in part in any medium now known or hereafter created.
Signature redacted
Signature of Author Certified by Certified by Accepted by Accepted byMIT Sloan School of Management, MIT Engineering Systems Division May 6, 2016
Signature redacted
f V David Simchi-Levi, Thesis Supervisor
Professor, Civil and Environmenta()gineering and Engineering Systems Division
Signature redacted
Charles Fine, Thesis Supervisor Chrysler Leaders for Global Operations Professor of Management
Signature redacted_____
John Tsitsiklis Clarence J. Lebel Professor of Electrical Engineering IDSS Graduate Officer
Signature redacted
This page intentionally left blank.
A Costing Model to Assess Customer Profitability within Li & Fung by
David Semko
Submitted to the MIT Sloan School of Management and the Engineering Systems Division on May 6, 2016 in Partial Fulfillment of the Requirements for the Degrees of Master of Business
Administration and Master of Science in Engineering Systems.
Abstract
As the leading consumer goods design, development, sourcing and logistics company, Li & Fung Limited (Li & Fung) supplies high-volume, time-sensitive consumer goods for global retailers and brands. One of Li & Fung's strengths is its diverse operational network; the company
sources from over 15,000 suppliers and operates in over 40 global economies. However, Li & Fung is also faced with unique challenges in a constantly evolving business environment. Many
of these challenges are linked to the ever-increasing demands of customers (and end consumers) in a consumer-centric industry that has seen margins fall significantly.
A dynamic costing model is developed to better understand profitability at the customer level
within Li and Fung. Historically, gross margins have been a sufficient measure of customer profitability. With a variety of factors causing margins to decrease throughout the fashion
industry combining with an increase in variation in the level of service required by customers, gross margins are no longer a reliable means of assessing customer profitability.
The research examines the current process for managing customer orders within a product group with a principal-based business model via a series of interviews with employees in various functional roles.
The cost-modeling proceeded by creating a cost allocation model that allocates product
development and operating costs to customers on the basis of their utilization of resources. The model provides both individualized income statements for each customer as well as an
aggregated view of customer profitability for the entire product group. The model is demonstrated with one medium-sized product group using data from calendar year 2014. Recommendations and opportunities for follow-on research and extensions are discussed.
Thesis Supervisor: David Simchi-Levi
Title: Professor of Engineering Systems and Civil and Environmental Engineering
Thesis Supervisor: Charles Fine
This page intentionally left blank.
Acknowledgements
The author wishes to acknowledge the
Leaders for Global Operations Programfor its support of this work Additional thanks go to:
Professor Charlie Fine, and Professor David Simchi-Levi whose insight into and support of this project was invaluable.
Pamela Mar, who throughout my time at Li & Fung played the roles of coach, mentor, and facilitator, and without whom this project would not have been successful.
My colleagues in the Fung Academy who brought richness to my personal and
professional life in Hong Kong, especially, Trevor, Lisa, Jeffie, Geoffrey, Tony, Killian, Wayne, Yan Ki, and Aram.
Those throughout Li & Fung who selflessly volunteered their time and efforts in support of this project, especially, Roger, and Simon.
My fellow LGO interns at Li & Fung, John Prout, Emily Koepsell, and Michael Heath who served as a sounding board, and provided endless comedic relief
This page intentionally left blank.
Table of Contents
A bstract ... 3
A cknow ledgm ents ... 5
Table of C ontents ... 4.0*.* ... I ... 9-4.99 ... 00 ... ... o ... .... **..o .... *to**** ... 00.0 7 List of Figures ... 11
List of T ables ... 13
1 Introduction ... 15
1.1 Project M otivation ... 15
1.2 Problem Statem ent and Hypothesis ... 16
1.3 Project A pproach: Business Unit Selection ... 18
1.4 Thesis Overview ... 18
1.5 Sum m ary ... 19
2 Background ... 21
2.1 Li & Fung H istory ... 21
2.2 Li & Fung O rganizational Structure ... 23
2.3 O perating G roup Specifics ... 25
2.4 Li & Fung Accounting Standards ... 25
2.5 Sum m ary ... 26
3 Literature R eview ... 29
3.1 Previous M aster's Theses ... 29
3.2 M anagerial and Cost Accounting ... 29
3.3 Sum m ary ... 31
4 M ethodology ... 33
4.1 Overview of Sourcing ... 33
4.2.1 Fabric Sourcing ... 37
4.2.2 Product D evelopm ent...37
4.2.3 M erchandising ... 38
4.3 Data A cquisition ... 38
4.3.1 Financial Data ... 40
4.3.2 Operational Data ... 40
4.4 Sum m ary ... 40
5 M odel Im plem entation and R esults ... 41
5.1 Cost A llocation...41
5.1.1 Exam ple Cost A llocation ... 42
5.2 Discussion of Results ... 43
5.3 A dditional A pplication...45
5.4 M odel V alidation ... 48
5.5 Sum m ary ... 48
6 R ecom m endations and C onclusions... 51
6.1 Recom m endations ... 51
6.1.1 Im prove D ata Capture Processes ... 51
6.1.2 Investigate Ways to Expand the Use of Managerial Accounting ... 51
6.1.3 Utilize Custom er Profitability Analysis to Im prove Perform ance ... 52
6.1.4 Standardize Processes w ith an Eye for Standardized Data... 52
6.1.5 Continue to Focus on Cultivating a Culture of Sharing Best Practices ... 52
6.2 Change M anagem ent ... 53
6.2.1 Establish a Sense of Urgency... 53
6.2.2 Create a Guiding Coalition ... 54
6.2.3 Plan for and Create Short-Term W ins... 54
6.3 Conclusion ... 54
This page intentionally left blank.
List of Figures
Figure 1: Apparel Price Index Between 1974 and 2014 ... 16
Figure 2: Li & Fung's Global Network ... 23
Figure 3 Organizational Structure of Li & Fung ... 24
Figure 4: Organizational Structure of Subject Product Group... 35
Figure 5: Customer Profitability Curve for Subject Product Group ... 44
This page intentionally left blank.
List of Tables
Table 1: Income Statement in LF Format ... 26
Table 2 Overall Sourcing Process... 34
Table 3: Example Time Study for Sourcing ... 35
Table 4: Summary of Cost Allocation Methods for Various Cost Pools... 41
This page intentionally left blank.
1 Introduction
In this chapter, the project motivation will be described including a brief summary of Li & Fung and its role in the garment industry. The problem statement and associated hypothesis will be presented. Additionally, the approach utilized in the project will be summarized. Finally, the structure of the remainder of the thesis will be outlined in an overview section.
1.1 Project Motivation
As the leading consumer goods design, development, sourcing and logistics company, Li & Fung Limited (Li & Fung) supplies high-volume, time-sensitive consumer goods for global retailers and brands. One of Li & Fung's strengths is its diverse operational network; the company sources from over 15,000 suppliers and operates in over 40 global economies. However, Li & Fung is also faced with unique challenges in a constantly evolving business environment. Many of these challenges are linked to the ever-increasing demands of customers (and end consumers) in a consumer-centric industry that has seen margins fall significantly.
The traditional supply chain in the garment industry originated from the supplier; as the world has become more inter-connected, the supply chain has evolved to one that is organized around the customer. In its century-long history, Li & Fung has transformed from a supply-centric model to a customer-centric model [1]. For customers, the value that Li & Fung provides is the convenience of a one-stop shop for product design, raw material sourcing, factory selection, production management, and logistics administration. Customer expectations in these areas have continued to rise; the end consumer demand for increased variety has driven the industry to a state of hyper-competition with the number of garment collections increasing almost every year. The demand for this level of variety places obvious pressure on Li & Fung to continuously provide value for its customers through in-house product development, sample production, and order management. Concurrently, prices for finished goods have remained essentially constant when adjusted for inflation (see Figure 1 [2].)
Apparel Price index Adjusted for Inflation 1974-2014
FigUre 1 Apparel Price Index Between 1974 and 2014
Compounding the challenges of increased customer expectations and relatively stagnant prices for finished goods, raw material and labor prices have increased significantly, further shrinking net margins. Sui [3] and others have discussed in detail the challenges associated with a Chinese government policy raising workers' minimum wage by 13-14% annually and a concurrent appreciation of the Chinese Renminbi (RMB) currency. While various business units within Li & Fung have looked outside China to diversify their factory base, this strategy has inherent risks in
a relationship-based industry such as garment sourcing. As a result, the diversification of the sourcing base company-wide has been uneven.
1.2 Problem Statement and Hypothesis
While the challenges of shrinking net margins are somewhat ubiquitous in the garment sourcing industry, they manifest themselves differently depending on the particular business model utilized. Of particular concern is the "principal" business model employed by many of the
business units within Li & Fung. This business model will be explained in more detail in Chapter 2; in essence, contracts are negotiated at the gross margin level with business units accruing increased financial risk to ensure their overhead costs do not exceed their negotiated margins.
16
As a practice, minimum acceptable margins for contracts are generally calculated at the
aggregate level across the many customers served by a business unit. When gross margins serve as a good approximation for net margins (i.e. when costs are low and overhead is small in relation to gross sales), this practice generates tenable results for the entirety of the customer portfolio. However, when the market is subject to pressures as described in Section 1.1, this practice is more problematic.
One executive within the operating group investigated summed up the challenge facing the business units under his purview:
Each business unit has its own cost structure subject to complexity and intensity of the handling processes. By and large, we don't have a scientific system pricing the handling processes into our margin for customers demanding for different level of services. What I want to do is to develop a structured cost template according to manpower consumption of the customer.
These problems are further exacerbated as the heterogeneity amongst customer demands increases. The resulting effects are twofold. Firstly, visibility on how manpower and other resources are being allocated to customers (which is of utmost importance with heterogeneity in increased expectations from customers) is decreased when minimum acceptable margins are calculated in aggregate. Secondly when resources are misallocated, those customers to whom Li
& Fung allocates fewer resources tend to subsidize the accounts of customers that are allocated
the most resources; in the long-term misallocating resources in this way makes it all the more challenging to maintain profitable relationships with the entirety of the customer portfolio. In summary, the growing demand for continuous product development cycles has caused overhead to increase and resulted in ever-shrinking net margins. Further, the practice of
calculating minimum acceptable gross margins at the aggregate level across customer groups has led to decreased visibility on the level at which customers are utilizing resources in the business unit. The project hypothesizes that allocating costs to customers based on their utilization of associated resources will improve visibility on individual customer profitability. Further, it will allow assessment of resource allocation within the business unit.
1.3 Project Approach: Business Unit Selection
A medium-sized product group within Li & Fung was investigated as part of this study. Financial
and operations data for Fiscal Year 2014 was made available for analysis. This particular product group was chosen for several reasons.
First, and perhaps most important, there was significant support at the management level for participation in this project. The implications of this support should not be understated; having
support at the highest levels of management when attempting to gather and synthesize data from various functional groups within the business unit is essential to providing valuable results.
Second, while the group supported a wide array of customers, it produced garments of generally the same type (outerwear). In practice this allowed for simplified analysis of the gathered data. Had customers been sourcing garments of dramatically different complexity, the task of isolating customer profitability from product profitability would have been substantially more
challenging.
Third, this particular product group had recently initiated efforts to reorganize its organizational structure based in part upon the empirically perceived usage of resources by customers in the portfolio. This was desirable because it indicated both a realization by management of the challenges described in Section 1.2 and it provided an opportunity to analyze the efficacy of this reallocation of resources.
The project aims to build a cost allocation model which provides an aggregated view of customer profitability for the entire product group. Additionally, the model aims to produce individualized
income statements (to the contribution level) for each customer within the product group
allowing line-item comparisons between customers. The intent is for the model to serve as a tool for management to assess customer contracts and resource allocation and use these results to drive future decisions regarding customer-specific business strategies.
1.4 Thesis Overview
The remainder of the thesis is organized in five chapters. Chapter 2 provides background on Li & Fung, and some of the unique accounting terminology utilized within the company. Chapter 3 provides a relevant literature review. Chapter 4 provides a detailed look at the project approach
and methodology. Chapter 5 provides a description of the costing model that was developed for analysis. and the results derived therein. Finally, Chapter 6 provides recommendations for further work and conclusions.
1.5 Summary
This chapter presented the motivation for the project in the context of the shrinking margins of the garment sourcing industry. The project approach was introduced as a hypothesized solution for obtaining more visibility of customer profitability to improve processes and resource
allocation. The rationale behind the selection of the particular product group chosen for investigation was explained. Finally, chapter contents for the remainder of the thesis were enumerated.
This page intentionally left blank
2 Background
In this chapter, the history of Li & Fung will be described as it relates to the context for the project. The organizational structure of Li & Fung is outlined and background information on the operating group in which the project was performed, is provided. Additionally, specific
accounting terminology utilized by Li & Fung is provided to establish a common language by which the specifics of the project will be discussed.
2.1 Li & Fung History
Li & Fung was founded in 1906 in the port city of Guangzhou, China by co-founders Fung Pak-Liu and Li To-Ming. [4] While the organization and its strategy have changed throughout its 110-year history, Li & Fung is regarded as one of the pioneers of the global supply chain
network orchestration model and its role as a global trader and exporter remains at the core of its business.
At the time of its founding, Li & Fung served mainly as an exporter of porcelain wares, antiques and handicrafts. In order to keep pace with ever-changing business and political conditions, the company has evolved significantly and expanded its service offerings. In part to escape Japan's invasion of China in 1937, the company was moved to Hong Kong and formally established as Li & Fung Limited. Following World War II, the company began to experiment with importing as well as exporting, achieving a resurgence due in part to being the first company to sell ball pens in Hong Kong.
The growth of Li & Fung accelerated in the early 1970s when third-generation brothers Victor and William Fung returned from studies abroad and entered management with the company. The brothers oversaw the public listing of Li & Fung in 1973 and were instrumental in expanding the company's offerings to American retailers. The brothers summed up their strategy, which
remains an essential part of the business today, as follows [4]:
We decided to seek out new opportunities and to offer new kinds of value-added services to major US retailers, identifying the best production bases in Asia and assisting with their overall Asian sourcing activities.
Li & Fung did not remain public for long, however; political and economic shockwaves
(including the October 1987 crash of the US Stock market and its effects on worldwide markets) catalyzed a decision to privatize the company through a leveraged buyout which was completed in early 1989. The Fung brothers utilized the privatization to refocus the company's energies, selling off non-core businesses (such as warehousing) to pay off debt and streamlining the core competencies of export trading and retail. This involved a significant expansion of services in the trading business to include offering product design and production plans, sourcing raw materials, and providing market and technical information to manufacturers and buyers.
The period of privatization also allowed for management restructuring, the results of which characterize much of the organizational structure found in Li & Fung today as described in Section 2.2. In short, the export business was divided into product groups (e.g. textiles, fashion accessories, etc.) with each group consisting of a number of divisions. The major duties
associated with export trading (e.g. purchasing, merchandizing, shipping and quality control) were delegated to the management of the divisions. The managers of each of these individual profit centers are sometimes internally referred to as "Little John Waynes," [1] a nod to the independence and autonomy they possess.
With refocus and restructure complete, the Fung brothers eyed a relisting of the company. This relisting was completed in 1992 with stock in Li & Fung being traded again on the Hong Kong Stock Exchange. For nearly two decades, Li & Fung achieved significant revenue growth, with annual rates over 20%. Concurrently, Li & Fung made over 70 acquisitions in an effort to expand their capabilities and the value they provided their customers.
One such acquisition was that of Camberley Enterprises Limited (Camberley). Touted by the William Fung as significantly broadening Li & Fung's customer base in its key markets of the United States and Europe, this acquisition was also significant for the specific capabilities that Camberley presented. Designing and sourcing high-end apparel, ladies' sportswear, fashion wear, and household goods, Camberley was somewhat unique in its role as a so-called virtual manufacturer. In this role it used its own facility to design prototypes for customers, and then purchased raw materials to be used by factories to which it would outsource the production of bulk orders. This model of virtual manufacturing is common to many of the product groups within Li & Fung.
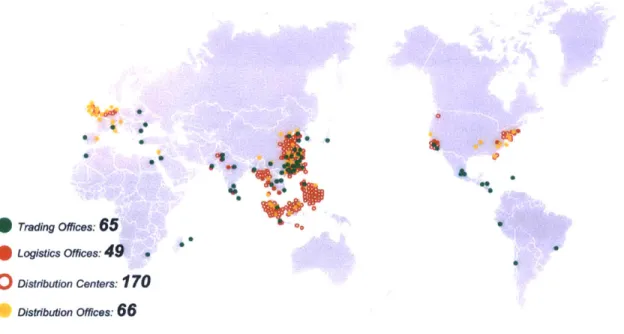
Today, Li &Fung operates in over 40 economies world-wide with offices on five continents (see Figure 2). Sourcing goods from over 15,000 factories, Li & Fung provides services in every step of the consumer goods value chain and is widely regarded as a global leader for management of the production of a diverse range of time-sensitive consumer products.
'a* * 0 Ot so 0 *0 Trading Offices: 65 Logistics Offices: 49 Distribution Centers: 170 Distribution Offices: 66 6
Figure 2: Li & Fung's Global Network
2.2 Li & Fung Organizational Structure
Li & Fung Limited exists today as a member of the holding company, The Fung Group. The Fung Group employs roughly 46,000 people in total, the majority of which work for Li & Fung Limited (hereafter Li & Fung and the company). Figure 3 shows the current organizational structure of Li & Fung. William Fung remains active as the group chairman. Spencer Fung, the eldest son of Victor Fung, currently serves as the Group CEO.
The company is split into its two main businesses, trading and logistics. Within the trading network, operating groups are further segmented by the business model utilized. Of specific
interest is the difference between the agency business model utilized by LF Sourcing, and the principal business model utilized by LF Fashion, LF Products, and LF Beauty.
Organization Structure
Global Retail Customers
William Fung Group Chairman
Spencer Fung Group CEO
LF wi n;1 LF i t
LF ;muBGiNG LFrponuis. LF iObN LFi , r y LFASiA LF Private Label LF LitoSTiCS
Von, Campegnon Hoey Chan yal Ping &aut GOMMn Rarnooc Gan %vfNn Slephpn Lola' josph PiN
OSG
Vendor Support Services
Figure 3 Organizational Structure of Li & Fung
In the agency model, Li & Fung serves (as the name suggests) as an agent for customers. Prices are negotiated with factories for bulk orders on behalf of the customers. Additionally, Li & Fung negotiates a commission percentage with the customers such that the compensation is a function of the cost of goods sold.
In the principal model, the price at which goods are sold to the customer is negotiated separately from the cost of goods sourced from suppliers. In this role, Li & Fung assumes more
responsibility (and financial risk) than the agency model in exchange for the opportunity to capture more of the margin embedded in the end-to-end supply chain. Further, since
compensation is a function of the difference between cost of goods sold and the negotiated price with customers, it is beholden upon the company to ensure that operating costs do not exceed this negotiated difference in order to post a profit. Whereas compensation in the agency model
increases with an increased cost of goods sold (assuming a constant commission percentage), the dynamics described in Section 1.1 serve to decrease the available margin in the principal model.
2.3 Operating Group Specifics
The operating group investigated is Li & Fung's principal apparel and fashion accessories business. It consists of a number of different product groups which specialize in providing specific types of mid- to high-end fashion garments and/or accessories, each for a portfolio of global customers.
While some of the product groups within the operating group have developed organically, the operating group is characterized by a large percentage of product groups which were obtained through acquisition. Many of these product groups were acquired similarly to Camberley, as described in Section 2.1. These product groups (Camberley included), often retain much of their staff, organizational processes, and customer bases, upon acquisition. In this way, the operating group investigated is somewhat of a microcosm of the organizational structure described in Section 2.1, with each product group existing as a virtually independent profit center. 2.4 Li & Fung Accounting Standards
The accounting terminology used throughout Li & Fung differs somewhat from that traditionally used in Western companies. Additionally, to aid in the performance of the project, some
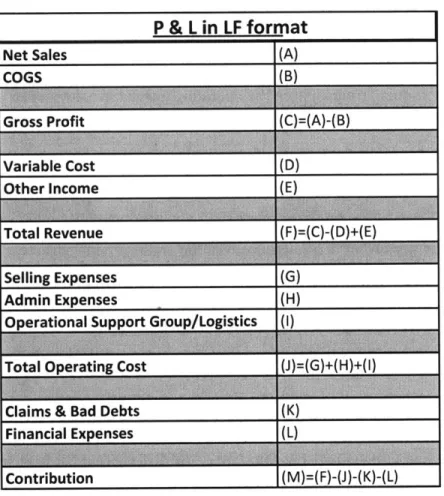
simplifications were made for analysis. Table 1 provides the major headings of a typical Income Statement in the format utilized by Li & Fung. Specific differences will be discussed in the following paragraphs.
Potentially misleading to someone unfamiliar to Li & Fung's Income Statement is what the company refers to as Total Revenue. (See (F) in Table 1.) Whereas the term Total Revenue seems to imply "top-line" revenue, in this case it refers to Gross Profit (Net Sales' less COGS), less
Variable Cost, plus Other Income. That'is, in practice, Total Revenue is similar to what is sometimes referred to as Gross Income, and is a corollary of Gross Profit that includes income and costs from areas that are not directly related to Li & Fung's operations in trading. For the customers of the product group investigated in this study, Variable Cost and Other Income were
non-existent or small in relation to Gross Profit and thus Gross Profit was roughly equivalent to Total Revenue.
Table 1: Income Statement in LF Format
P & L in LF format
Net Sales (A)
COGS (B)
Gross Profit (C)=(A)-(B)
Variable Cost (D)
Other Income (E)
Total Revenue (F) (C) -(D)+(E)
Selling Expenses (G)
Admin Expenses (H)
Operational Support Group/Logistics (I)
Total Operating Cost (J)=(G)+(H)+(1)
Claims & Bad Debts (K)
Financial Expenses (L)
Contribution (M)=(F)-(J)-(K)-(L)
Finally, Claims & Bad Debts and Financial Expenses were relatively small and not known at the customer level. As such, Contribution (See (M) in Table 1) was approximated as Total Revenue
less Total Operating Cost.
2.5 Summary
This chapter introduced the rich history of Li & Fung characterized both by constant evolution of services in response to changing political and economic pressures and a simultaneous steadfast commitment to the company's roots as a trader uniting the East and the West. The organizational structure of Li & Fung, characterized by its immense size and geographic reach with
segmentation by business model, was described. The operating group on which this study was focused was introduced as a microcosm of the larger Li & Fung with each of its product groups
(many incorporated through acquisition) enjoying significant autonomy as independent profit centers. Finally, specific accounting terminology that differs within Li & Fung was introduced to establish a common language for discussion of the project.
This page intentionally left blank
3 Literature Review
In this chapter, a brief description of literature that informed the project will be presented. First, the findings of previous theses conducted at Li & Fung will be summarized. Second, a survey of
methods used for cost accounting in various industries will be presented.
3.1 Previous Master's Theses
In its short history as an MIT Leaders for Global Operations partner company, Li and Fung has hosted two graduate fellows whose projects were intended to support the company's ongoing efforts to modernize their approach to data with regards to the 15,000 factories from which they source.
One project sought to evaluate supplier network performance through creation of a total cost of sourcing model that incorporated the risk profiles of various factories in the factory selection decision process [3]. Another project sought to use data analytics to investigate leading indicators of long-term factory success via current factory performance metrics [2].
This project will differ from previous theses in its focus on the other end of the supply chain. Namely, the project aims to identify differences in customer behavior throughout the sourcing process and attach financial costs based on customer utilization of resources. In doing so, the project relies on the fields of managerial and cost accounting; a survey of research in these areas will be presented in Section 3.2.
3.2 Managerial and Cost Accounting
In a recent article [5], Gary Cokins stresses the need for cost accounting in firms such that managers can truly understand what is driving their profitability. He asserts that even if
production costs are low, firms can fail to produce profits due to inadequate control of overhead costs such as selling and administration.
The field of cost accounting is not novel; it stretches back almost a century. As early as 1922, Castenholz and Rayson described the need to accurately understand selling and administration costs of a product in a manufacturing environment [6]. Indeed, much of the early work in cost accounting was inspired by the needs of the manufacturing industry.
One of the most significant advances in cost accounting was the development of Activity Based Costing (ABC). The roots of ABC can be traced to the 1970s and 1980s, with George Staubus often cited as one of the forefathers of the discipline [7]. Robert Kaplan is generally credited with formally defining the field; he sought to appropriately allocate indirect costs in the
manufacturing industry as a response to the growing prevalence of automation which served to reduce direct costs (e.g. labor) but increase indirect costs (e.g. depreciation of assets) [8]. Since its introduction, ABC has been used in a variety of industries. Financial institutions have seen considerable success in applying the principles of ABC [9]. In addition, ABC has been successfully implemented in the contexts of the postal service industry [10], healthcare [11], and marketing services[12], to provide a few examples.
Difficulties in the implementation and maintenance of ABC in various firms drove Kaplan to amend his work, and along with Steven Anderson he developed the concept of Time- (or
sometimes Resource-) Driven Activity Based Costing (TDABC) [13], [14]. TDABC differs from
ABC in that managers directly estimate the resource demands (often time demands) imposed by
each transaction, product, or customer and utilize this to derive cost-driver rates. TDABC has seen success in a variety of applications [15], [16], and [17]. Additional research has focused on utilizing the concept of fuzzy logic to overcome some of the limitations of TDABC [18].
In general, robust cost accounting in the modern era of business requires the use of sophisticated software to capture all of the cost drivers associated with various cost pools. Without this
software, even if the challenges of organizational inertia can be overcome, implementation and maintenance costs can outweigh the benefits of a cost accounting system.
The goal of any cost accounting system is to more adequately appropriate costs to customers or transactions based on the rate at which the resources associated with those costs are utilized by the customer, or during the transaction. Despite the challenges of implementation, the research indicates that even modest efforts at appropriate cost allocation can result in increased visibility on profitability and improved business intelligence.
3.3 Summary
The existing literature provides extensive context for the benefit of managerial accounting in various industries to improve business intelligence. The project seeks to apply the lessons learned in these applications to analyze customer profitability and improve business intelligence in an environment that is much less data rich.
This page intentionally left blank.
4 Methodology
In this chapter an overview of the sourcing process will be described, specifically as it relates to the challenges of the product group investigated. Additionally, summarized results of interviews conducted with various employees in the product group will be presented. Finally, a description of the financial and operating data gathered for the model and the methods by which they were obtained will be explained.
4.1 Overview of Sourcing
The process of garment sourcing for retailers in general starts 9 to 18 months before products are made available for sale to the end consumer. Traditionally, retailers have produced two distinct seasons of garments a year, Fall-Winter and Spring-Summer. With the trend towards fast-fashion the lines between these seasons have been blurred considerably. Continuous product
development throughout the production cycle has become more prevalent, adding to the operational load on virtual manufacturers such as the product group investigated.
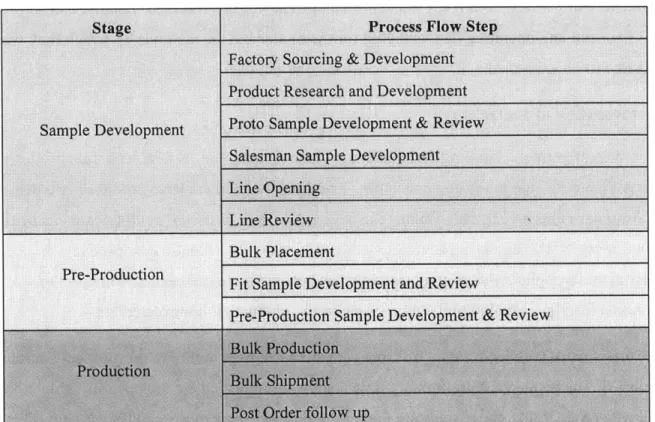
In her thesis work with Li & Fung, Sui spent considerable time outlining the garment sourcing process [3]. The results of a preliminary time study she conducted are included in Table 2. While for a given product line, these steps are fairly well defined, there exists significant variability in adherence to this process flow across customers, and even across different styles created for the same customer. For reasons that include desired time-to-market, complexity and size of orders, etc., customers will start this process at different times throughout the calendar year.
Additionally, the amount of time spent in each of these process steps varies significantly from style to style.
Finally hit-rate (i.e. number of styles proceeding to bulk production and shipment out of the number of styles which start the sample development stage) is significantly lower than 100%. Exact hit rate varies with style, season, customer, product group and other variables and is in many cases difficult to quantify due in part to similar samples being provided to multiple customers in the hopes that one will adopt the sample for bulk production. As the offeror, Li & Fung bears the costs of developing styles. While hit-rates have been falling (in many cases to single digits) in the past few decades, there has not been a corresponding increase in price to
garment styling have lowered the costs of this investment, but the benefits of these advances are not sufficient to counter the effect of reduced hit-rate.
Table 2 Overall Sourcing PIocess
Factory Sourcing & Development Product Research and Development Sample Development Proto Sample Development & Review
Salesman Sample Development Line Opening
Line Review Bulk Placement
Pre-Production Fit Sample Development and Review
Pre-Production Sample Development & Review Bulk Production
Productioni Bulk Shipment Post Order follow up
In summary, while the process flow in Table 2 appears linear, in practice it is much less defined. The pressures of increased customer expectations cause significant churn and rework especially in the Sample Development and Pre-Production stages. At any given time, merchandisers might be managing orders in each of the stages of the sourcing process.
Of specific concern for this project is the variability amongst customers in the demands they
place upon Li & Fung in the Sample Development and Pre-Production processes. While exact timing varies, a typical example of time allocated for each stage is presented in Table 3 [3]. With over 70% of employee time being allocated to the first two stages, understanding how customers vary in their usage of these resources is an essential focus of this project.
34
I
Process Flow Step
Table 3: Example Time Study for Sourcing
Total Time Spent per Style (min)
Sample Development 2537
Pre-Production 668
Production 1136
4.2 Interview Findings
In order to understand the challenges facing the particular product group investigated in this study, interviews were conducted with employees performing various functions. A schematic of the organizational structure is shown in Figure 4. The product group consists of two divisions2
which are further divided into customer facing teams. Each of these teams is responsible for managing orders for one or more of the product group's 37 customers. These customer teams are exclusive in that a given customer is only serviced by one customer team. In addition, the
division has an integrated multi-functional support team that provides services for the entire product group in the areas of fabric sourcing and product development. Interviews were conducted with members of each division and customer team, as well as members of the fabric sourcing and product development support teams.
1141L
In summary, the interviews added empirical evidence to the hypothesis that customers were utilizing resources at varying rates. Specifically, there was almost unanimous consensus about the value that the product group provided its customers was centered around the work performed prior to bulk order. According to employees in all functions, customers returned to the product group season after season for the individualized attention that they received on cultivating their garment collections in the Sample Development and the Pre-Production phases of Table 2. One Assistant Merchandising Manager summed up the value proposition as follows:
The value [of the product group] is in our product development. We make sure every sample is in good condition and ensure good workmanship before it gets to the customer. We solve the customers' problems before they realize they exist.
In their descriptions of providing this value to customers, employees expressed an undercurrent of frustration about the extent to which customers differed in their usage of product group resources. Specifically, some customers were cited as being organized and systematic in their approach to sourcing from the product group; often these customers had their own fabric
sourcing and product development teams and primarily relied on the product group to manage the production process. Other customers were much more demanding. These customers relied on the product group throughout the sourcing process to provide fabric options, develop samples
and provide advice on industry trends. Additionally, many of these customers were cited as making many changes throughout the pre-production stage and often being vague in the changes that they requested.
By and large, employees indicated that while attempts had been made to reorganize3 the product
group around customer behavior, there was little ability to quantify the effects of customer behavior on profitability. This is unsurprising given a customer-centric organization with the history of Li & Fung. Cokins [5] describes the tendency of companies shifting from a
product-3 The management of the product group had recently restructured the product group around types
of customers served. The management had developed a description of more demanding customers (full-service) and less demanding customers (lean-service). In addition, customers which didn't seem to fit either extreme were described by the hybrid term, full-lean.
centric organization to a customer-centric organization to view all customer relationships as profitable. With sales forces incentivized by revenues, and without managerial accounting processes in place to differentiate customers at a level below top-line revenue, he asserts that companies often have no choice but to measure customers based on Net Sales. In this way, it follows that all customers appear profitable. This fallacy exists, despite intuition by those in the organization that profitability of customers varies significantly from highly profitable to highly unprofitable. In the following sub-sections, descriptions of this intuition from employees in each of the various functions (fabric sourcing, product development, and merchandising) will be described.
4.2.1 Fabric Sourcing
Interviews with members of the fabric sourcing team indicated that there was significant variability in customer demands for fabric sourcing. Some customers provided their own fabric sources and thus required little input from the fabric sourcing team. Of the customers which required the product group to source fabric for them, there was variability in the specificity of their requests. Some customers were very specific about fabric details (color, composition, patterns, etc.) while other customers only provided vague descriptions and often would only provide approval on a fabric type after several iterations of fabric review. Additionally, variations in the level of approval required and the order size added to the operational complexity of dealing with different customers.
4.2.2 Product Development
Interviews with the product development team again revealed significant differences in customer demands. Some customers provided their own tech packs4. Other customers relied heavily on the product development team to create tech packs that were often based on vague descriptions of the desired product from the customer. Additionally, customers varied significantly in the amount of samples that were produced for a given product. This variation was both in the
4 Tech pack is the term used for an informative sheet that designers use to communicate with manufacturers all of the necessary components required to produce a garment (e.g.
number of styles for which samples were created (many of which never made it to the production phase) and the number of units for a given style. For example, while one customer might not require any salesman samples another customer might require several hundred salesman samples to be produced with no guarantee that these would result in bulk orders.
4.2.3 Merchandising
Interview findings from the merchandising team echoed the customer variability conclusions derived from conversations with the fabric sourcing product development teams. Sample workload, in conjunction with the deadlines of providing these samples to customers, was highlighted as a significant driving factor in the variability of the customer handling process. Further, differences among customers in the level of approval required for different changes added to order handling complexity. A follow-on effect of frequent changes in the order process that was identified was the time required to translate changes from the customer (in English) to a language which was understood by the factory (typically Mandarin Chinese). Some employees estimated that due to the tedious nature of this task, and the frequency at which it was required, they spent upwards of 30% of their time on translating design requirement changes from the customer to the factory. Additionally, many of the merchandisers echoed the thoughts of the executive in Section 1.2 that there was no way to incorporate these differences into the margins negotiated with the customers.
4.3 Data Acquisition
Data acquisition was a significant challenge throughout this project. In his thesis work with Li & Fung, Chan described some of the challenges with the databases in use at the company [2]. Despite large amounts of data available for analysis, the integrity and consistency of this data varies significantly from business unit to business unit. Moreover, much of this data is
concentrated on capturing metrics associated with the Production Stage of Table 2. This data is of obvious importance to customers, as they have generally committed financial investments to an order at this stage of the sourcing process. Earlier in the sourcing process, however, customers are generally not financially obligated to Li & Fung. As such, the habit of maintaining useful and accurate databases of key performance indicators of pre-production processes relies on pressure from internal management vice external customers.
The role of each product group as an independent profit center as discussed in Sections 2.1 and
Error! Reference source not found. complicates the task of obtaining this kind of
pre-production data. First, as the industry has developed, each product group has generally developed its own internal processes for handling customer orders. In the hundred-year history of Li &
Fung, these processes have developed in somewhat of an ad-hoc manner as customer handling complexity has increased; the result can be characterized as divergent evolution of processes, to borrow an analogy from the life sciences. Further, since historically gross margins were a sufficient measure of customer profitability, analysis of the metrics associated with the handling of customers was generally not viewed as a valuable endeavor.
As an example, consider the number of changes made to a style throughout the sourcing process. Interviews with members of the product group investigated (as outlined in Section 0) as well as preliminary discussions with members of other product groups identified this as a major driver in the complexity of the customer handling process. Despite this consensus, there was no
systematic way to historically review a style that made it to bulk production and infer the number of changes that were required in the design prior to production. Most product groups only
maintained a record of the final specifications of a product; when a change was made to specifications the previous specification was simply overwritten such that only the final configuration was retrievable. For those product groups that did maintain some record of
changes, the way in which this record was kept was inconsistent (even amongst employees in the same product group.) Some kept record of some changes in a spreadsheet associated with the style; others relied inconsistently on e-mails and/or text messages as a record of changes. Needless to say, without a unifying database for managing these metrics (such as an enterprise resource planning system) detailed analysis was problematic.
Acknowledging the limitations of data integrity and availability, data was sought to form the basis of the model that was either already available or attainable within the six-month timeline of the project. In this light, the project intended to provide a first approximation of customer
profitability within the confines of available data. The project hypothesized that this
approximation would both substantially improve visibility on customer utilization of resources and highlight the need for more robust data collection in the pre-production phases such that the
4.3.1 Financial Data
Financial data was obtained primarily from the product group's income statement. Net Sales and Cost of Goods Sold were already available at the customer level. In general, Operating Costs were only available at the product group level. Operating Costs were divided into cost pools in order to facilitate cost allocation via identified cost drivers. In some cases, (e.g. Manpower Costs) these cost pools could further be subdivided to the Customer Team level. In other cases, cost pools were only available at the aggregate Product Group level.
4.3.2 Operational Data
Operational data was obtained from two main sources. Detailed information on number of orders, value of orders, and number of styles was already available in company databases. Number and type of samples was not immediately available, however based on interview results this information was identified as crucial to implementation of the model. While this data was not immediately available in company databases, a manual log located at the product group's in-house sample factory and invoices from sample production that was outsourced captured the quantity and type of samples produced. This information was painstakingly converted to digital form over a several-week period so that it could be included in the model.
4.4 Summary
This chapter outlined the methodology of the project. An overview of the sourcing process, and the specific challenges facing the product group that was investigated were described. The summarized results of interviews with employees in the product group were presented as empirical support for the hypothesized difference in customer utilization of resources. In
summary, the investigation into the sourcing process identified significant differences in
customer behavior and corresponding allocation of resources by Li & Fung that are not reflected in the margins negotiated with customers. Finally, the challenges associated with data acquisition were described, concluding with an outline of the specific sources of data used to formulate the costing model.
5 Model Implementation and Results
In this chapter the development of the cost allocation model will be described; a description of the proxy statistics used to allocate costs from various cost pools will be provided. The results of the aggregated customer portfolio will be presented with specific focus on their implications for the business model. Additionally, a follow-on tool which allows comparison of any two
customers at the line item level will be discussed.
5.1 Cost Allocation
In practice, cost allocation was not being performed by the product group for much of the
indirect costs associated with sourcing. In the cases where it was being performed, sales data was somewhat arbitrarily being used as a means to allocate costs. The project sought to allocate as many costs as possible and to do so in a way that best captured the usage of resources associated with that cost within the confines of data that was available for the project. Table 4 summarizes the cost allocation methods utilized.
Tabhe 4: SummiiarvOf(Cost A/iocaiion Aethods for Various (ost Pools
Product Development Fabric, Trims, Courier, Misc Outsourced Sample BS Sample Room Bulk Sample
Fabric, Trims, Labtest, Courier, Misc
Outourcing Staff
Sample Room
Merchandising, Purchasing, Technical Total Operating Costs
Selling Expenses
Overseas Travelling
Other Selling Expenses
Admin Expenses and OSG Internal Charges MPC
OSG
Rent and Depreciation Trading Internal Charges
Customer Split Sales Split Order Split
Other Admin Expenses
$ 757 $ 321 $ 80 $ 355 $ 1,235 $ 798 $ 437 $ 135 $ 301 $ 5,770 $ 582 $ 368 $ 214 $ 5,115 $ 3,486 $ 144 $ 478 $ 814 $ 14 $ 527 $ 273 $ 193
Customer Team Sales I Orders I Samples I
I
I'I
Any allocation of costs utilizing proxy statistics is an inexact science relying on knowledge of the business to choose appropriate cost drivers, and limited by the availability of data which capture those cost drivers. In general, this process consisted of two steps, utilizing knowledge of those employees most familiar with the business throughout.
First, cost pools were reduced to the most granular level at which it was thought a summary statistic could be used as a proxy for cost allocation. If possible, cost pools were segmented by customer team to aid in appropriate cost allocation. Those cost pools that could be segmented in this way are indicated by a black-shaded cell in the "Customer Team" column of Table 4. Second, a proxy statistic was chosen that best represented customer usage of this resource. In general, based on the operational data available as described in Section 4.3.2, three different types of pro-rata allocation were possible: sales, orders, and samples5. The particular type of proxy statistic used for each cost pool is indicated by a black-shaded cell under the respective title in Table 4.
Choosing to allocate costs in this way, although admittedly inexact, is an improvement upon simply using sales to allocate costs. The methods chosen resulted in over 75% of the costs being allocated by some means other than sales. In addition, of the remaining 25% of costs that utilized sales for allocation, a majority of these cost pools were first divided by customer team. This resulted in just over 10% of total costs being allocated by sales at the product group level which was deemed a significant improvement over previous methods.
5.1.1 Example Cost Allocation
While an exhaustive review of the allocation of all cost pools would be repetitive, an example of how a particular cost pool was allocated to customers in the portfolio to aid in understanding.
Consider the BS Sample Room line item that appears under the Product Development
subheading in Table 4. This cost pool of $355,000 had previously been allocated to all customers
5 These proxy statistics were further segmented (e.g. by specific type of sample created, etc.)
While this level of segmentation was important to the development of the model, the higher-level description of cost driver is sufficient to convey the method employed in the project.
based on the value of their net sales. As described earlier in this section, limiting the number of cost pools that were allocated in this way was a primary objective of this project.
The costs associated with this line-item are associated with the operating costs of an in-house sample room which produces sample garments for a variety of customers. Some of the customers in the portfolio used this sample room almost exclusively for their garment sample production. Due to relationships with other factories and/or contractual differences, other customers used this facility sparingly, if at all.
Prior to this project, extensive records of samples provided for customers were only being maintained in a hard-copy log book at the sample room. As discussed in Section 4.3, this data was identified as essential to the model because it captured the number of samples produced for each customer at this facility during the time period examined. Since the facility was generally producing garments of the same type and complexity, utilizing the customer-specific ratio of samples produced at this facility was deemed satisfactory for allocating this cost pool. Using this method, costs were allocated to each customer via a proxy statistic that roughly represented their usage of the resources associated with the cost pool. Other cost pools were allocated to
customers in a similar manner.
5.2 Discussion of Results
While the limitations of available data made true activity-based costing impossible within the confines of the project, an attempt was made to use the available customer-specific operational data as cost drivers for the various cost pools as discussed in Section 5.1. The results of
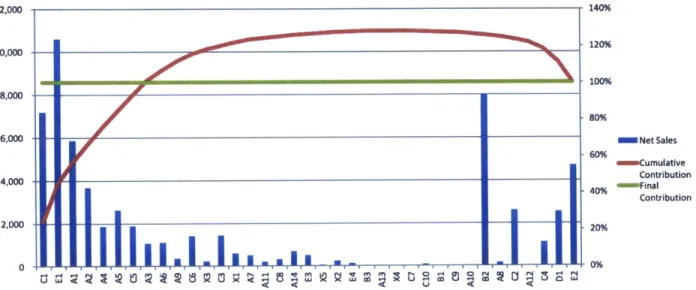
allocating costs in this way are summarized in Figure 5. The whale curve is widely regarded as one of the best means to assess customer (or product) profitability in the field of managerial accounting [13]. In general, this curve is created by arranging customers from left to right in order of decreasing profitability. Superimposing Net Sales on this chart allows comparison of top-line revenue with bottom line contribution.
12,000 140% 120% 10,000 10 -100% 8,000 --- 1-80% 6,000 Net Sales 60% % mm Cumulative ______ _ ___ _ __ ____ _ _ ___- _ IContribution 4,000 - --- - -- - 40% Final Contribution 2,000l- - - - -20%
Figure 5: Customer Profitability Curve for Subject Product Group
Analysis of Figure 5 yields several important results. First, the eight most profitable customers of the 37 in the portfolio (~22%) account for 100% of the cumulative contribution. This is a typical
result of analysis of this kind. While Pareto's famous 20:80 thumb rule implies that 2 0% of an organization's customers generate 80% of its sales, the whale curve illustrates a slightly different phenomenon. In general, the top 20-30% of customers yield greater than 100% of the
organization's profits whereas the bottom 10-20% of customers lose this excess profit. Those customers in the middle 50-70% tend to contribute little (positive or negative) to the
organizations cumulative profit.
Secondly, the amount of contribution lost by unprofitable customers can be quantified, albeit as a first estimate. Given the final contribution of approximately $1.6M USD across the product
group, the peak of the cumulative contribution curve at 125% indicates that approximately $400K USD in contribution was lost to unprofitable customers.
It is important to note here that this number does not imply that removal of these customers from the portfolio will result in an automatic increase in product group contribution of the
corresponding amount. By the nature of the way in which costs were allocated to these
customers, simply removing them from the portfolio would only redistribute much of the costs to other customers in the portfolio. More accurately, the magnitude of the difference between final contribution and peak cumulative contribution is an indicator of available opportunity for
improvement of customer relationship management. Specific strategies for improving customer relationship management will be discussed in Section 6.1.3.
Thirdly, unprofitable customers account for roughly 31% of Net Sales for the product group. Again, this result is not surprising for analysis of this kind. Typically, customers with large sales volumes exist either on the left or right side of the customer profitability curve. In order for a customer to be largely unprofitable, it in general has to do large amounts of business with an organization. That said, in a company such as Li & Fung where incentives are often based on top-line revenue, this has an important implication. Whereas customers with large sales volumes are often targeted to increase revenue to meet financial targets, if these high volume customers are in actuality unprofitable, this targeting can serve to decrease the organization's bottom-line. As a final note, it is important to address the implications of the most profitable customers. In sharing these results with management, there was a tendency to think that devoting more
resources to the profitable customers would result in higher contributions for the product group. While this approach seems intuitive, it is problematic. A customer's existence on the profitable (left-hand) side of the whale curve is indicative that the current allocation of resources results in a profitable relationship with that customer. Devoting more resources to that customer without a corresponding return on that investment would only serve to make that customer less profitable. In this light, a customer's profitability is an indication of internal processes and resource
allocation being well suited to that customer's behavior; a lack of profitability indicates a mismatch in pricing and/or resource allocation such that the organization is not equipped to profit given the customer's behavior.
5.3 Additional Application
After seeing the increased visibility obtained from the aggregate view of customer profitability in Figure 5, management expressed a desire to see a comparison of customers at the line-item level. Given costs had already been allocated at this level as outlined in Section 5.1, this tool simply needed to capture those costs in a form that was meaningful for management. A combination of data validation and indexing tools in Microsoft Excel were utilized to create a dynamic tool that could display income statements for any two customers and allow comparison across line items.