A novel statistical approach shows evidence for multi-system physiological dysregulation during aging
34
0
0
Texte intégral
(2)
(5)
(6)
(7)
(8)
(9)
(11)
(12)
(13)
(14)
(15)
(16)
(17)
(18)
(19)
(20)
(21)
(22)
(23)
(25)
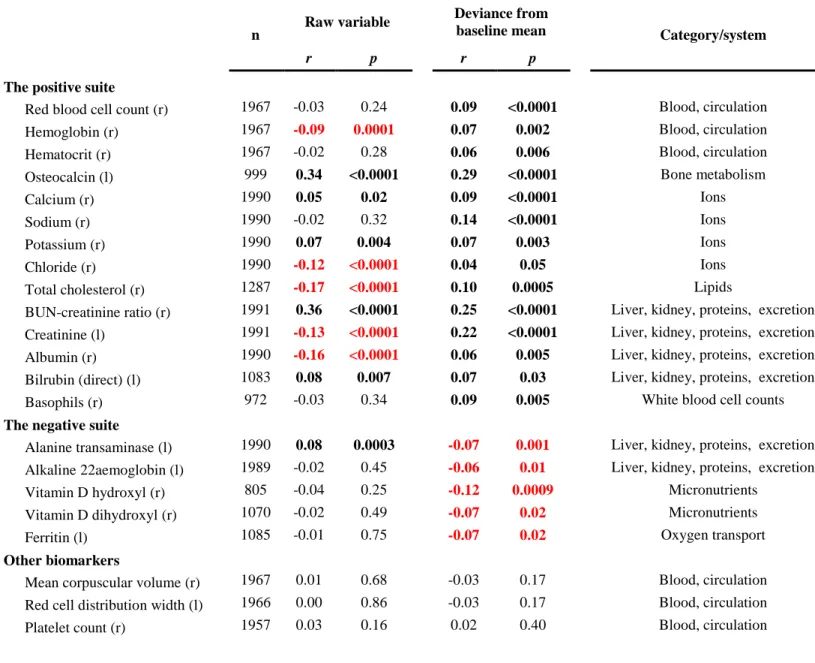
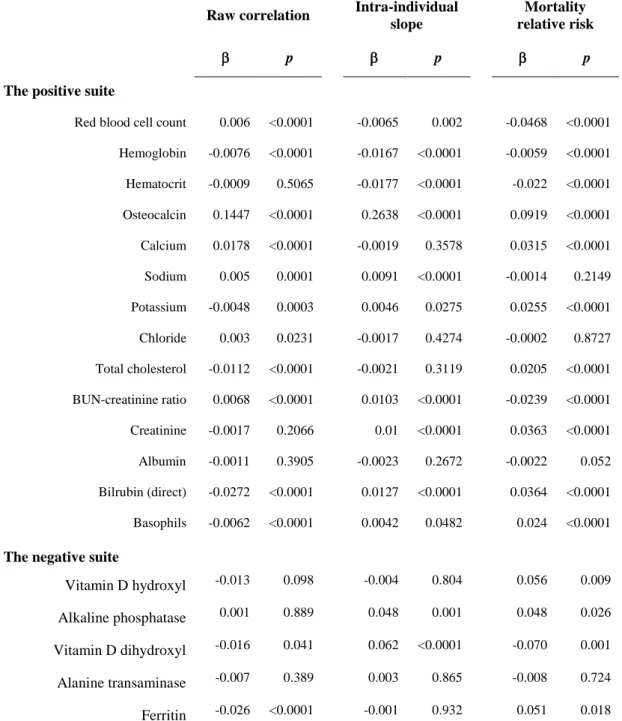
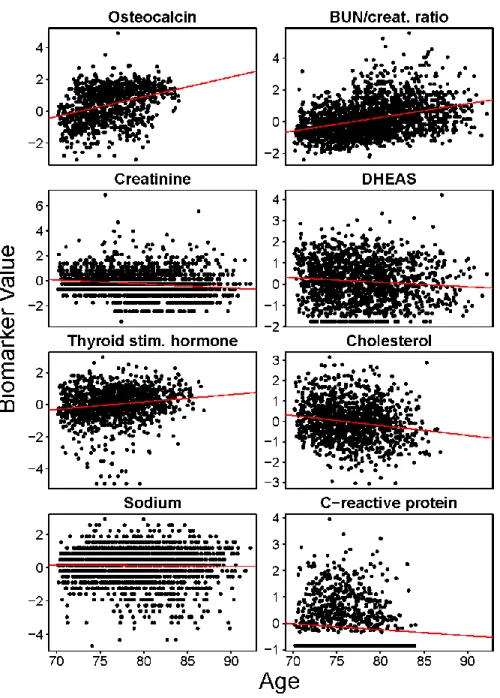
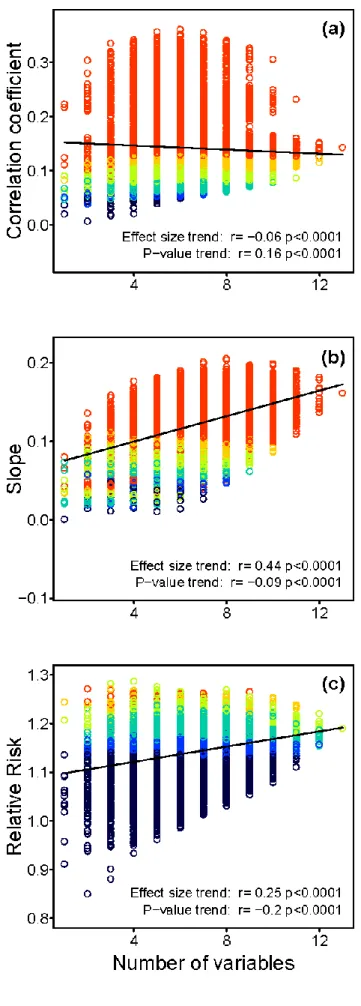
Figure
Documents relatifs