HAL Id: inserm-00813081
https://www.hal.inserm.fr/inserm-00813081
Submitted on 15 Apr 2013
HAL is a multi-disciplinary open access
archive for the deposit and dissemination of sci-entific research documents, whether they are pub-lished or not. The documents may come from teaching and research institutions in France or abroad, or from public or private research centers.
L’archive ouverte pluridisciplinaire HAL, est destinée au dépôt et à la diffusion de documents scientifiques de niveau recherche, publiés ou non, émanant des établissements d’enseignement et de recherche français ou étrangers, des laboratoires publics ou privés.
Gene network analysis leads to functional validation of
pathways linked to cancer cell growth and survival.
Emmanuelle Berger, Nathalie Vega, Hubert Vidal, Alain Geloen
To cite this version:
Emmanuelle Berger, Nathalie Vega, Hubert Vidal, Alain Geloen. Gene network analysis leads to functional validation of pathways linked to cancer cell growth and survival.. Biotechnology Journal, Wiley-VCH Verlag, 2012, 7 (11), pp.1395-404. �10.1002/biot.201200188�. �inserm-00813081�
Supporting informations
Table S1 : Human gene sets retrieved from published experiments and used to determine gene sets detected in HepG2 cells (Full), liver (set 1) or deregulated in hepatocellular carcinoma HCC (set2).
Number of genes PMID References 1345164 Okubo et al , 1992 11466695 Tackel Hornes et al , 2001 15013840 Butura et al , 2004 17967932 Liguori et al , 2008 20571111 Berger et al , 2010 127558421 De Gottardi et al , 2007 1577423 Shyamsundare et al , 2005 1676090 Das et al , 2006 10694486 Yamashita et al , 2000 11580139 Yano et al , 2001 19171046 Okabe et al , 2001 18171335 Wong et al , 2008 181711335 Zender et al , 2010 20839 4918 806 Full Liver (set 1) HCC (set 2)
Table S2: Drugs used in experiments
Drug Activity
Highest Concentration
tested
Reference (PMID) Vehicle Purchased by
2,5 DDA Adenylate cyclase inhibitor 100 !M 21444924 Dimethylsulfoxide (DMSO) SIGMA ALDRICH, France
A6355 P42/P44 inhibitor 90 !M DMSO SIGMA ALDRICH, France
Butein Janus kinase (JAK1) inhibitor 20 !M 9571170 (HepG2) DMSO SIGMA ALDRICH, France
Compound C AMPc activated kinase (AMPK) inhibitor 40 !M 22674626 DMSO SIGMA ALDRICH, France
GW7647
Peroxisome-proliferator activated receptor
alpha (PPARA) activator 10 !M 188520 DMSO SIGMA ALDRICH, France
KT5720
Protein kinase AMPc dependant (PKA)
inhibitor 30 !M Methanol (MetOH) SIGMA ALDRICH, France
LY294002 PI3Kinase inhibitor 250 !M 22025081 (HepG2) DMSO
CELL SIGNALING, Ozyme, St Quentin-en-Yvelines, France
P3115
Protein kinase Calcium dependant (PKC)
inhibitor 50 !M 8420972 H2O SIGMA ALDRICH, France
Pertussis Toxin G protein subunit Gi/G0 inhibitor 1 µg/ml H20 SIGMA ALDRICH, France
Rapamycin TOR/P70S6Kinase inhibitor 50 nM 15870276; 21830446 H2O
CELL SIGNALING, Ozyme, St Quentin-en-Yvelines, France
RU 486 PPARA inhibitor 5 !M H2O SIGMA ALDRICH, France
SD169 P38 MAP Kinase (P38MAPK) inhibitor 300 !M 16603672 DMSO SIGMA ALDRICH, France
SP600125 Jun-NH2 kinase (JNK) inhibitor 100 !M 14766793 (HepG2) DMSO SIGMA ALDRICH, France
Tyrphostin 490 Janus kinase 2 (JAK2) inhibitor 50 !M 18448488 Ethanol (EtOH) SIGMA ALDRICH, France
U0126 MEK1/2 MAPK inhibitor 100 !M 18448488 DMSO
CELL SIGNALING, Ozyme, St Quentin-en-Yvelines, France
U73122
Phospholipase C (PLC and Phospholipase
A2 (PLA2) inhibitor 5 !M 18629476 EtOH SIGMA ALDRICH, France
Wedelolactone
Nuclear factor kappa B, p65 subunit
(NFKBp65) inhibitor 10 !M 17942463 DMSO SIGMA ALDRICH, France
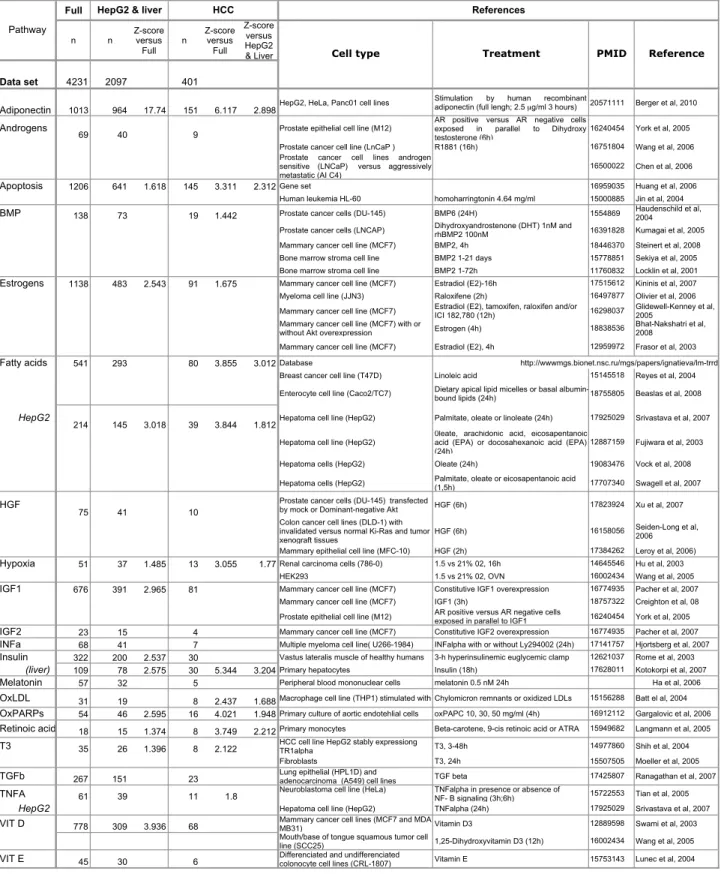
Table S3: References of human gene sets retrieved from published experiments and used to determine
pathway representativity in either human genes detected in HepG2 cells (Full), liver or deregulated in hepatocellular carcinoma (HCC). Gene number (n) in data sets represent the number of genes modulated by at least one pathway in either Full, liver or HCC sets. Gene sets modulated by external factors (Stimulus) and intracellular pathways were retrieved from experiments performed in human cells (PubMed Identifiers, PMID) and sets obtained on HepG2 cells are reported separately. Only significant Z-test scores are reported (confidence level > 90). Full n n Z-score versus Full n Z-score versus Full Z-score versus HepG2
& Liver Cell type Treatment PMID Reference
Data set 4231 2097 401
Adiponectin 1013 964 17.74 151 6.117 2.898HepG2, HeLa, Panc01 cell lines
Stimulation by human recombinant
adiponectin (full lengh; 2.5 µg/ml 3 hours) 20571111 Berger et al, 2010
Androgens
69 40 9 Prostate epithelial cell line (M12)
AR positive versus AR negative cells exposed in parallel to Dihydroxy testosterone (6h)
16240454 York et al, 2005 Prostate cancer cell line (LnCaP ) R1881 (16h) 16751804 Wang et al, 2006 Prostate cancer cell lines androgen
sensitive (LNCaP) versus aggressively metastatic (AI C4)
16500022 Chen et al, 2006
Apoptosis 1206 641 1.618 145 3.311 2.312Gene set 16959035 Huang et al, 2006 Human leukemia HL-60 homoharringtonin 4.64 mg/ml 15000885 Jin et al, 2004
BMP 138 73 19 1.442 Prostate cancer cells (DU-145) BMP6 (24H) 1554869 Haudenschild et al, 2004 Prostate cancer cells (LNCAP) Dihydroxyandrostenone (DHT) 1nM and rhBMP2 100nM 16391828 Kumagai et al, 2005 Mammary cancer cell line (MCF7) BMP2, 4h 18446370 Steinert et al, 2008 Bone marrow stroma cell line BMP2 1-21 days 15778851 Sekiya et al, 2005 Bone marrow stroma cell line BMP2 1-72h 11760832 Locklin et al, 2001
Estrogens 1138 483 2.543 91 1.675 Mammary cancer cell line (MCF7) Estradiol (E2)-16h 17515612 Kininis et al, 2007 Myeloma cell line (JJN3) Raloxifene (2h) 16497877 Olivier et al, 2006 Mammary cancer cell line (MCF7) Estradiol (E2), tamoxifen, raloxifen and/or
ICI 182,780 (12h) 16298037
Glidewell-Kenney et al, 2005
Mammary cancer cell line (MCF7) with or
without Akt overexpression Estrogen (4h) 18838536
Bhat-Nakshatri et al, 2008
Mammary cancer cell line (MCF7) Estradiol (E2), 4h 12959972 Frasor et al, 2003
Fatty acids 541 293 80 3.855 3.012Database
Breast cancer cell line (T47D) Linoleic acid 15145518 Reyes et al, 2004 Enterocyte cell line (Caco2/TC7) Dietary apical lipid micelles or basal albumin-bound lipids (24h) 18755805 Beaslas et al, 2008 HepG2
214 145 3.018 39 3.844 1.812Hepatoma cell line (HepG2) Palmitate, oleate or linoleate (24h) 17925029 Srivastava et al, 2007
Hepatoma cell line (HepG2)
0leate, arachidonic acid, eicosapentanoic acid (EPA) or docosahexanoic acid (EPA) (24h)
12887159 Fujiwara et al, 2003 Hepatoma cells (HepG2) Oleate (24h) 19083476 Vock et al, 2008 Hepatoma cells (HepG2) Palmitate, oleate or eicosapentanoic acid (1,5h) 17707340 Swagell et al, 2007
HGF
75 41 10
Prostate cancer cells (DU-145) transfected
by mock or Dominant-negative Akt HGF (6h) 17823924 Xu et al, 2007 Colon cancer cell lines (DLD-1) with
invalidated versus normal Ki-Ras and tumor xenograft tissues
HGF (6h) 16158056 Seiden-Long et al, 2006 Mammary epithelial cell line (MFC-10) HGF (2h) 17384262 Leroy et al, 2006)
Hypoxia 51 37 1.485 13 3.055 1.77Renal carcinoma cells (786-0) 1.5 vs 21% 02, 16h 14645546 Hu et al, 2003 HEK293 1.5 vs 21% 02, OVN 16002434 Wang et al, 2005
IGF1 676 391 2.965 81 Mammary cancer cell line (MCF7) Constitutive IGF1 overexpression 16774935 Pacher et al, 2007 Mammary cancer cell line (MCF7) IGF1 (3h) 18757322 Creighton et al, 08 Prostate epithelial cell line (M12) AR positive versus AR negative cells exposed in parallel to IGF1 16240454 York et al, 2005
IGF2 23 15 4 Mammary cancer cell line (MCF7) Constitutive IGF2 overexpression 16774935 Pacher et al, 2007
INFa 68 41 7 Multiple myeloma cell line( U266-1984) INFalpha with or without Ly294002 (24h) 17141757 Hjortsberg et al, 2007
Insulin 322 200 2.537 30 Vastus lateralis muscle of healthy humans 3-h hyperinsulinemic euglycemic clamp 12621037 Rome et al, 2003 (liver) 109 78 2.575 30 5.344 3.204Primary hepatocytes Insulin (18h) 17628011 Kotokorpi et al, 2007
Melatonin 57 32 5 Peripheral blood mononuclear cells melatonin 0.5 nM 24h Ha et al, 2006
OxLDL 31 19 8 2.437 1.688Macrophage cell line (THP1) stimulated with Chylomicron remnants or oxidized LDLs 15156288 Batt el al, 2004
OxPARPs 54 46 2.595 16 4.021 1.948Primary culture of aortic endotehlial cells oxPAPC 10, 30, 50 mg/ml (4h) 16912112 Gargalovic et al, 2006
Retinoic acids 18 15 1.374 8 3.749 2.212Primary monocytes Beta-carotene, 9-cis retinoic acid or ATRA 15949682 Langmann et al, 2005
T3 35 26 1.396 8 2.122 HCC cell line HepG2 stably expressiong TR1alpha T3, 3-48h 14977860 Shih et al, 2004 Fibroblasts T3, 24h 15507505 Moeller et al, 2005
TGFb 267 151 23 Lung epithelial (HPL1D) and adenocarcinoma (A549) cell lines TGF beta 17425807 Ranagathan et al, 2007
TNFA 61 39 11 1.8 Neuroblastoma cell line (HeLa) TNFalpha in presence or absence ofNF- B signaling (3h;6h) 15722553 Tian et al, 2005 HepG2 Hepatoma cell line (HepG2) TNFalpha (24h) 17925029 Srivastava et al, 2007
VIT D 778 309 3.936 68 Mammary cancer cell lines (MCF7 and MDA MB31) Vitamin D3 12889598 Swami et al, 2003 Mouth/base of tongue squamous tumor cell
line (SCC25) 1,25-Dihydroxyvitamin D3 (12h) 16002434 Wang et al, 2005
VIT E 45 30 6 Differenciated and undifferenciated colonocyte cell lines (CRL-1807) Vitamin E 15753143 Lunec et al, 2004 http://wwwmgs.bionet.nsc.ru/mgs/papers/ignatieva/lm-trrd HepG2 & liver HCC
Pathway
STIMULUS
Full n n Z-score versus Full n Z-score versus Full Z-score versus HepG2
& Liver Cell type Treatment PMID Reference
Data set 5690 2529 453
Akt 1009 418 79 Prostate cancer cells (DU-145) Transfection DN-Akt and stimulation by
HGF (6h) 17823924 Xu et al, 2007 Umbilical vein endotheliual cells (HUVECs) Infected with adenoviral constitutively active
Akt (24h) 15784720 Kim et al, 2005 Mammary cancer cell line (MCF7) Constitutive Akt overexpression 18838536 Bhat-Nakshatri et al,
2008 Retinoic pigment epithelial cells (RPE)
expressing constitutively active Akt fused to the hormone binding domain of the oestrogen receptor
4-hydroxytamoxifen (4-OHT) 16007182 Portsmann et al, 2005
Akt
Translation 92 84 4.831 11 14576155 Gera et al, 2004
Gb/g
22 14 4
Knock out beta and gamma G protein
subunit 15983374 Hwang et al, 2005
JNK 74 49 1.969 18 4.184 2.473Epidermal keratinocytes SP600125 (4h) 16648634 Gazel et al, 2006
Ki-RAS 73 44 1.665 6 4 pancreatic cancer cell lines Infection by adenoviral Ki-Ras antisens 16446406 Spence et al, 2006
LKB1 36 15 4 Lung adenocarinoma cells (A549) LKB1 overexpression (6h) 12649203 Jimenez et al, 2003
Mek/Erk1/2 103 50 9 Immortalized retinal pigment epithelial cells (RPE) Transient MKK1 or ERK2 overexpression 16735500 Schweppe et al, 2006 Lung carcinoma cells (H157) U0126 and/or plaxitel (6h) 12941840 Taxman et al, 2003
3972 1719 265 4.818 3.684HCC cell line HepG2 5-AzaC 16649225 Arai et al, 2006 HCC cell line HepG2 5-AzaC, TSA 16854234 Dannenberg et al, 2006
MKK5/Erk5 26 18 1.556 5 1.675 Immortalized retinal pigment epithelial cells (RPE) Transient MKK5 or ERK5 overexpression 16735500 Schweppe et al, 2006
mTOR 540 269 50 Hepatic cell line (HepaRG) Constitutively active mTOR overexpression 17483347 Parent et al, 2007 Jurkat T cells Rapamycin (3 days) 11943782 Grolleau et al, 2002
280 221 6.596 31 1.664 11943782 Grolleau et al, 2002
14576155 Gera et al, 2004
N-RAS 400 281 6.028 79 7.548 3.531Cancer cell lines (SHEP, A549, NCIH929, U87 and LaNR) Salirasib 17409441 Blum et al, 2007 Cord blood CD34+ cells Constitutive N-RAS expression 17533045 Shen et al, 2007
P38MAPK 91 71 3.526 25 5.69 2.854Follicular lymphoma cell line (OCILY-1) SB203580 15169874 Lin et al, 2004
Pi3K 72 38 6 Gioblastoma cell line (T98G) LY294002 (3h) 18226221 Terragni et al, 2008 Multiple myeloma cell line( U266-1984) Ly294002 (24h) 17141757 Hjortsberg et al, 2007
PKA 89 39 10 0.945 Prostate cancer cell line (LnCaP ) Forskolin (16h) 16751804 Wang et al, 2006 Endometrial stromal cells 8-Br-cAMP (2h) 14532334 Tierney et al, 2003
PTEN 123 95 4.092 26 4.635 1.858Endometrial cancer cell line (HEC-151) Infection by adenoviral PTEN Dominant negatif 11325847 Matsushima-Nishiu et al, 2001
PTEN translation
92 69 3.235 13 1.708
14576155 Gera et al, 2004
Rac1 34 23 1.369 7 1.964 Colorectal adenocarcinomacell line (SW620) Stably transfected shRNA versus wild type Rac1 17766170 Gomez del Pulgar et al, 2007
TSC1/2 41 27 0 1.461 1.8Neuroblastoma cell line (HeLa) Transient TSC1/2 overexpression 12894220 Rosner et al, 2003
Wnt/bCAT 222 142 3.399 31 2.867 Neuroblastoma cell line (HeLa) Stably integrated, inducible RNA interference (RNAi) for beta-catenin 16959035 Huang et al, 2006 Database 17157329 Lee et al, 2007 mTOR translation Methylation (HepG2)
HepG2 & liver HCC References
http://www.stanford.edu/~rnusse/pat hways/targets.html
Hepatoma carcinoma cell lines with constitutive versus minimal beta-catenin activity (HepG2, SNU-182, SNU-354 versus Hep3B, PLC/PRF/5, SNU-387, SNU-449, SNU-475) Polysom microarray analysis of U87MG glioblastoma cell line transfected with wild-type PTEN and treated by rapamycin
Polysom microarray analysis of protsate cancer LAPC-4 cell line stably transfected with a constitutively active AKT and treated by rapamycin
Proteomic Profiling by 2D-electrophoresis of Rapamycin-treated Jurkat T Cells Polysom microarray analysis of protsate cancer LAPC-4 and glioblastoma U87MG cell line treated by rapamycin
Intracellular pathways
Table S4: Nomenclature, primers and experimental conditions designed for real-time analysis of human gene
transcription. Standards corresponding to fragments of human genes used as at several known concentrations were used to calibrate mRNA quantifications.
Symbol Name Gene Id Primers Hybridization
(°C)
Amplicon size (bp) Standard Sens: 5' AAGCACCGGCAGACAAGAGC 60 133 ADIPOR1 Antisens: 5' AGGAAGAACCAGCCCATCTG
Sens: 5' CTGTGTGCTGGGCATTGCAG 60 180 ADIPOR2 Antisens: 5' AGCCTATCTGCCCTATGGTG
Sens: 5' TCTCAGGCCTGTTGGAG 60 98 HPRT1
Antisens: 5' CCAAAGCAGCACGAGTT
Sens: 5'CTGAGCAGAACATCTCTTGAC 60 154 BHLHB2 Antisens: 5'GCAGTGGTTCTTGAACTTACC
Sens: 5'TGCCCATGGCCTTGACCAAGGAG 60 254 CEBPA Antisens: 5'GCAAGGCCAAGAAGTCGGTGGAC
Sens: 5'GCTTGAACAAGTTCCGCAGG 60 156 CEBPB AACATCGCCGTGCGCAAGAG
Sens: 5'GCAATGCGCAGGAATAAG 60 135 HPRT1
AGGCTTCTTGGGCGTCT
Sens: 5'CAAACGCCTTGTCCAGCATC 58 CREBBP
Antisens: 5'GCCGTTTACCATGAGATCC
Sens: 5'ACGTGGTCAGAGTAGAACCC 60 179 HPRT1 Antisens:GGTGTTTGGAAAGTTCCTCC
Sens: 5'GTTGTTCAGAGAGATGTCAGG 60 88 EGR1 Antisens: 5'CAGCACCTTCAACCCTCAG
Sens: 5'GCTGGAGACAATGACAGG 62 125 HPRT1
Antisens: 5'CATTGGTGATTATGTCGCC
Sens: 5'TTCTTTAGTGGCGATCTGCG 60 111 HPRT1 Antisens: 5'AAGAAAGAGGAGCTATCCCCTC
Sens: 5'AGACATCTTTGGACTGCTTC 60 115 FOXO1A Antisens: 5'TCAAGACAACGACACATAGC Sens: 5' GAAATGACAGTGAAGCACCTC 55 113 HPRT1 Antisens: 5' GTTCATGCACTCGCTGAAG Sens: 5'GCTTTGCAGAATGCTCAGAG 60 98 HPRT1 Antisens: 5'TGATCGTCTGGCTGCTGT Sens: 5'TGTTGCAGGATGGCTCGGAC 60 131 HK2 Antisens: 5'CAAGCGTGGACTGCTCTTCC Sens: 5'GAGATCCATGGTGTTCAAGG 60 150 HPRT1 Antisens: 5'ATTGTCATCGATCTGCAGC Sens: 5' TTGCTGACCTGCTGGATTAC 60 151 HPRT1 Antisens: 5' AGTTGAGAGATCATCTCCAC Sens: 5' CAGCAACAGAAGACTTCGG 58 95 HPRT1 Antisens: ATCTAGCAGGCTCAGCTTC Sens: 5'GCTGGGACATCAACAAG 58 119 HPRT1 Antisens: 5'AAAGTTGGCCTTCCACGT Sens: 5'TCACTCCATCTCAAGCATCG 60 149 HPRT1 Antisens: 5'TGGCACTGAAAATGGCTTCG
Sens: 5'GTAGTTGTGCTGATGTGTGG 60 171 MYC Antisens: 5'GAGGAGGAACAAGAAGATGAG
Sens: 5'GCATTATGAGACATCCCCAC 65 474 PPAR Antisens: 5'TCTCTCCGTAATGGAAGACC
Sens: 5'CTTGGTTGGCTTTATGAGGAGG 60 143 PPARGC1A Antisens: 5'TCCTCTGACCCCAGAGTCAC Sens: 5' TGGTGTGCACAGGAGCCAAG 60 139 TBP Antisens: 5' TTCACATCACAGCTCCCCAC Sens: 5'GGTTATGCTGGTTGTACAGG 55 229 TGFB Antisens: 5'AGGGCTACCATGCCAACTTC Sens: 5'CTACAGATGGCGTCTCAGC 60 126 HPRT1 Antisens: 5'CCCTAGTCTACCACCAGCATAG
Sens: 5'CAATCTGGGGTAGGCACAAC 60 129 TNFRSF1A Antisens: 5'CCTGCCAGGAGAAACAGAAC
7132 Tumor necrosis factor receptor
superfamily, member 1A
7040
7057 thrombospondin 1
Transforming growth factor, beta 1 6908 10891 5468 3949 4609 3659 8518 3172 3251 3099 3091 3280 2305 2308 2168 1958 1387 1588 6043 1050
CREB binding protein (Rubinstein-Taybi syndrome)
8552
1051 Basic helix-loop-helix domain
containing, class B, 2
CCAAT/enhancer binding protein (C/EBP), alpha
CCAAT/enhancer binding protein (C/EBP), beta
ADIPOR1 Adiponectin receptor 1 51094
ADIPOR2 AFP Adiponectin receptor 2 Alpha fetoprotein 79602 174 BHLHB2 / BHLHE40 CEBPA CEBPB CDKN1B CREBBP CYP19A1 EGR1 FABP1 FOXM1/HNF3a FOXO1A HES1 HIF1A HK2 HNF4A HPRT IKBKAP IRF1 LDLR MYC PPARG TNFRSF1A
TATA box binding protein Peroxisome proliferator-activated receptor gamma, coactivator 1 alpha Peroxisome proliferator-activated receptor gamma PPARGC1A TBP TGFB1 THBS1
v-myc myelocytomatosis viral oncogene homolog (avian) low density lipoprotein receptor interferon regulatory factor 1 inhibitor of kappa light polypeptide gene enhancer in Bcells, kinase complexassociated protein hypoxanthine
phosphoribosyltransferase 1 hepatocyte nuclear factor 4, alpha Hexokinase 2
hypoxia inducible factor 1, alpha subunit (basic helix-loop-helix transcription factor) Early growth response 1 cytochrome P450, family 19, subfamily A, polypeptide 1 Cyclin-dependent kinase inhibitor 1B (p27, Kip1)
hairy and enhancer of split 1, (Drosophila)
forkhead box O1 forkhead box M1
Table S5: Real-time quantification of gene expression in HepG2 cells incubated with specific inhibitors during 5
hours in serum free standard media. Fold changes for samples treated versus controls (i.e. vehicle) were normalized to HPRT1. Significant modulation was considered through ANOVA test, i.e. p-value < 0.01 (n>3 independant experiments). Gene names, sequence references and primers are reported in Table S4, drug informations in Table S2.
CEBPA -1.96 ± 0.03 BHLHB2 2.77 ± 0.10 ADIPOR1 1.01 ± 0.05
CREBBP -1.37 ± 0.09 HES1 2.47 ± 0.10 AFP 1.02 ± 0.06
HNF4A 2.23 ± 0.38 CEBPB 0.93 ± 0.04 TGFB1 1.80 ± 0.02 CYP19A1 1.03 ± 0.16 THBS1 1.69 ± 0.20 EGR1 0.95 ± 0.01 FOXM1/HNF3 1.54 ± 0.11 FABP1 1.31 ± 0.08 ADIPOR2 1.49 ± 0.05 IKBKAP 0.84 ± 0/04 IRF1 1.48 ± 0.05 PPARG 1.17 ± 0.09 LDLR 1.44 ± 0.02 TBP 0/98 ± 0.06 TNFRSF1A 1.44 ± 0.07
CEBPA -1.75 ± 0.02 IRF1 3.31 ± 0.67 ADIPOR1 1.21 ± 0.05 EGR1 -1.59 ± 0.07 FOXO1A 1.57 ± 0.10 ADIPOR2 -1.09 ± 0.04 HK2 -1.53 ± 0.02 CYP19A1 1.45 ± 0.06 AFP 1.18 ± 0.08 LDLR -1.44 ± 0.02 HES1 1.42 ± 0.03 BHLHB2 -1.13 ± 0.02 MYC -1.38 ± 0.03 CEBPB -1.08 ± 0.13 CREBBP 1.15 ± 0.13 FABP1 1.21 ± 0.07 FOXM1/HNF3 1.28 ± 0.06 HNF4A 1.20 ± 0.07 IKBKAP -1.18 ± 0.07 PPARG 1.31 ± 0.10 PPARGC1A 1.31 ± 0.14 TBP 1.23 ± 0.05 TGFB1 -1.22 ± 0.12 THBS1 -1.04 ± 0.03 TNFRSF1A 1.07 ± 0.17
CEBPA -8.07 ± 0.00 EGR1 17.34 ± 0.39 ADIPOR1 1.23 ± 0.06 PPARGC1A -2.31 ± 0.05 LDLR 6.63 ± 0.44 CEBPB 1.06 ± 0.13 MYC -2.15 ± 0.05 BHLHB2 5.84 ± 0.11 FABP1 1.29 ± 0.06 CREBBP -2.10 ± 0.04 HES1 3.98 ± 0.09 HK2 1.07 ± 0.05 IKBKAP -2.09 ± 0.00 FOXO1A 2.93 ± 0.42 TBP 1.02 ± 0.04 HNF4A -1.62 ± 0.04 IRF1 2.17 ± 0.15 TGFB1 1.29 ± 0.16 THBS1 -1.48 ± 0.07 CYP19A1 1.94 ± 0.17 TNFRSF1A -1.40 ± 0.08 ADIPOR2 1.92 ± 0.05 AFP -1.38 ± 0.04 FOXM1/HNF3 1.89 ± 0.11 PPARG 1.45 ± 0.12 CEBPA -2.17 ± 0.03 BHLHB2 3.85 ± 0.07 ADIPOR1 1.08 ± 0.03 LDLR 3.23 ± 0.78 AFP -1.24 ± 0.08 HES1 2.50 ± 0.05 CEBPB -1.22 ± 0.07 THBS1 2.00 ± 0.32 CREBBP -1.33 ± 0.01 HNF4A 1.83 ± 0.08 FABP1 1.16 ± 0.06 EGR1 1.67 ± 0.09 FOXO1A 1.23 ± 0.16 MYC 1.61 ± 0.10 TBP 1.01 ± 0.06 FOXM1/HNF3 1.57 ± 0.20 TGFB1 1.33 ± 0.01 ADIPOR2 1.50 ± 0.07 TNFRSF1A 1.04 ± 0.07 PPARG 1.44 ± 0.12 EGR1 2.8 ± 0.12 ADIPOR1 1.29 ± 0.00 BHLHB2 2.67 ± 0.16 ADIPOR2 1.26 ± 0.01 AFP 2.33 ± 0.10 CEBPA 1.18 ± 0.09 FOXM1/HNF3 2.31 ± 0.03 PPARG -1.02 ± 0.03 CEBPB 1.70 ± 0.16 TBP 1.26 ± 0.04 HES1 1.64 ± 0.02 LDLR 1.57 ± 0.08
Gi/G0 (Inhibition by Pertussis Toxin, 500 ng/ml)
JAK1 (Inhibition by Butein, 20 µM) PKC (Inhibition by P3115, 50 µM) Mek1/2 (Inhibition by U0126, 10 µM)
P42/44 (inhibition by A6355, 90 µM)
Figure S1 : Search of links between genes selected for mRNA qunatificatioon and (A) hepatic functions (B)
hepatic disorders (C) canonical pathways as defined by Ingenuity Systems Library. Gene nomenclature is reported in Table S4. CEBPB ADIPOR1 FOXM1 PPARGC1A EGR1 HNF4A MYC
Binding of hepatocytes
Differentiation of hepatocytes
Proliferation of liver
Proliferation of hepatocytes
Quantity of hepatocytes
Morphology of liver
Gluconeogenesis of D-glucose
Morphology of liver tissue
Regeneration of liver
ADIPOR2
TGFB1
THBS1
FOXM1 EGR1 PPARG MYC IRF1
Fragmentation of hepatocytes
Apoptosis of hepatic stellate cells
Chronic hepatitis C
Cirrhosis
Hepatic steatosis
Delay in tumorigenesis in liver
Apoptosis of liver cells
Hepatocellular carcinoma
ADIPOR2 CEBPB TGFB1 CYP19A1Injury of hepatocytes
Apoptosis of
hepatocytes
Nonalcoholic
steatohepatosis
Proliferatiopn of
hepatocytes
Cancer of liver
Regeneration of liver
Proliferation of liver
Steatohepatosis
B-Hepatic diseases
CEBPB ADIPOR1 PPARGC1A FOXO1A HES1 HNF4A PPARG MYC IRF1
PPAR!/RXR! Activation
Type II Diabetes Mellitus Signaling
IL-6 Signaling
VDR/RXR Activation
FXR/RXR Activation
Molecular
Mechanisms
of Cancer
TGFB1 CYP19A1Cell Cycle:G1/S
Chekpoint Regulation
IL-12 Signaling and
Production in
Macrophages
PPAR Signaling
PXR/RXR Activation
ADIPOR2C-Canonical pathways
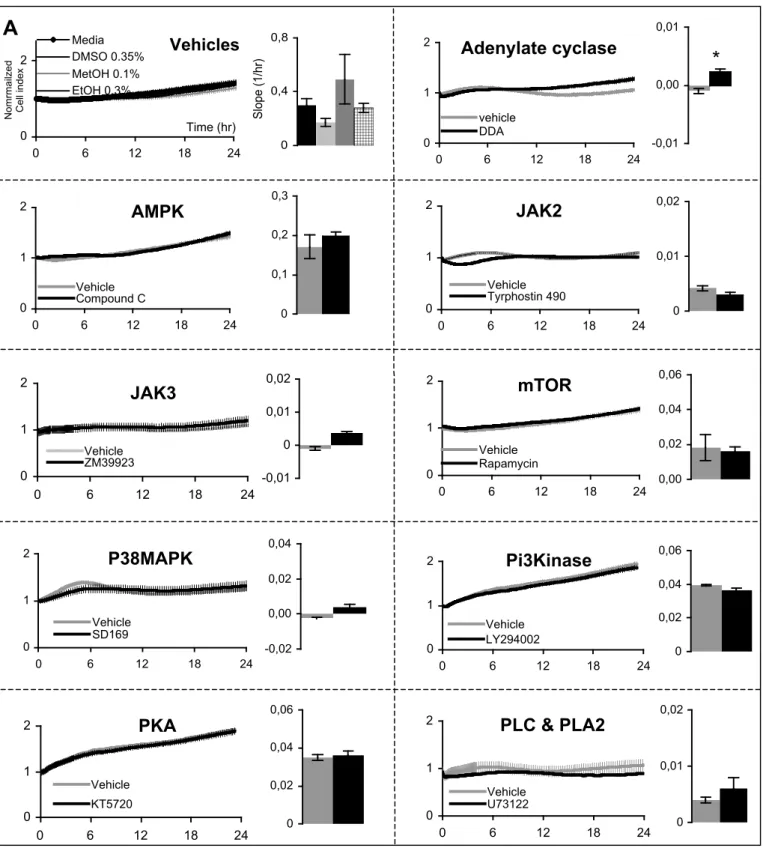
Figure S2: Real Time Cell Analysis of signaling pathways involved in cell growth and/or proliferation by using
specific inhibitors on (A) HepG2 cells (B) HuH7 cells (during one day); name of pathways and concentrations are reported in Support. Information, Table S2. Left panel represents the cell index normalized at time of treatment, right panel corresponding slopes (representative experiments, mean values +/- SEM, n>6; Student test t p-value*< 0.05; **<0.001;***<0.0001). Vehicles 0 2 0 6 12 18 24 Time (hr) N o mrma ilze d C e ll in d e x Media DMSO 0.35% MetOH 0.1% EtOH 0.3% 0 0,4 0,8 Sl o p e (1 /h r)
Adenylate cyclase
0 1 2 0 6 12 18 24 vehicle DDA -0,01 0,00 0,01*
AMPK
0 1 2 0 6 12 18 24 Vehicle Compound C 0 0,1 0,2 0,3JAK2
0 1 2 0 6 12 18 24 Vehicle Tyrphostin 490 0 0,01 0,02 JAK3 0 1 2 0 6 12 18 24 Vehicle ZM39923 -0,01 0 0,01 0,02mTOR
0 1 2 0 6 12 18 24 Vehicle Rapamycin 0,00 0,02 0,04 0,06 -0,02 0,00 0,02 0,04Pi3Kinase
0 1 2 0 6 12 18 24 Vehicle LY294002 0 0,02 0,04 0,06 0 0,02 0,04 0,06PLC & PLA2
0 1 2 0 6 12 18 24 Vehicle U73122 0 0,01 0,02 P38MAPK 0 1 2 0 6 12 18 24 Vehicle SD169PKA
0 1 2 0 6 12 18 24 Vehicle KT5720A
B
6hr 0 0,02 0,04 0,06 Sl o p e (1 /h r)***
0 0,02 0,04 0,06 Sl o p e (1 /h r)*
NFKBp65 0 2 4 6 0 12 24 36 48 Time (hr) N o rma lize d C I Vehicle Wedelolactone 0 0,02 0,04 0,06 Sl o p e (1 /h r)*
PPARA 0 1 2 3 4 0 6 12 18 24 Time (hr) N o rma lize d C I Vehicle GW6471P42/44
0 2 4 0 6 12 18 24 Time (hr) N o rma lize d C I Vehicle A6355JNK
0 2 4 0 6 12 18 24 Time (hr) N o rma lize d C I Vehicle SP600125 -0,04 0,00 0,04 0,08 Sl o p e (1 /h r)***
HepG2 cell line Liver
Hepatocellular carcinoma
Gene data sets:
-Time
C
e
ll
c
o
u
n
t
Bioinformatic analyses
Extracellular signals Intracellular pathways Transcription factorsm
R
N
A
Quantitative RT-PCR
*
*
Identification
Signaling pathways
Validation
Real time proliferation assay
(xCELLigence®)
ADIPOR1
ADIPOR2 CEBPA
Gi/G0 AFP CREB*
BHLHB2 E2F CDKN1B EGR1* CEBPA ESR CEBPB Ets* p42/44 CREBBP HIF1A CYP19A1 HNFs EGR1 JUN* FABP1 KLF4 FOXM1 LXR PKC FOXO1A MYB HES1 MYC* HK2 NFKB* HNF4A PPARA* HPRT PPARG*
Mek1/2 IKBKAP RARA
IRF1 SMADs LDLR SREBP1A* MYC STATs PPARG TFAP2A JAK1 PPARGC1A TP53 TBP USF TGFB1 THBS1 TNFRSF1A A B
0 10 20 30 40 ATF2 CEBPA CEBPB CEBPD c-Myc E2F EGR1 Elk1 ESR1 ESR2 Ets FOS FOXO1A FXRA HIF1A HNF1A HNF4A JUN KLF4 LXR MIZ-1 MYB NFkB Oct1/POU2F1 PPARGC1A/ESR1 PPARA PPARD PPARG RXR SMADS SREBP1A STATs TFAP2A,B,C TP53 Genes (%) HCC Liver Genome *
*
*
**
*
*
*
*
*
*
*
*
*
*
*
*
*
*
*
*
*
*
*
*
*
*
*
*
*
*
*
*
*
*
*
*
*
*
*
*
*
*
*
*
*
*
*
*
*
*
*
*
*
*
*
*
*
*
*
*
*
*
*
* *
*
*
*
ADIPOR2, CEBPA, EGR1 ADIPOR1, ADIPOR2, CEBPA,
FABP1, MYC MYC
ADIPOR2, CEBPA, MYC
CEBPA BHLHB2, CEBPA MYC
CYP19A1, MYC, PPARG
MYC EGR1 CEBPA AFP, CDKN1B, HNF4A, LDLR AFP, CYP19A1 CREBBP, PPARG AFP, HNF4A FOXM1, THBS1 0 20 40 60 80 100 c-Ets-1p54 c-Myc:Max CP2 CREB CREBATF c-Rel DEAF1 E2F E2F-1 E2F-1:DP-1 E2F-1:DP-2 E2F-4:DP-1 E2F-4:DP-2 Elk-1 KROX LXR, PXR, CAR, COUP, RAR MAZ MAZR Muscle initiator sequence-20 Myc NF-kappaB PITX2 POU3F2 PPAR direct repeat 1 Sp3 SREBP-1 TFII-I USF Genes (%) HCC Liver Genome
A
B
Genes (%) Genes (%)0 20 40 60 80 Akt Akt translation betaCatenin Gb1/2 JNK Ki-Ras LKB1 Mek/Erk1/2 Methylation MKK5/Erk5 mTOR mTOR translation N-Ras P38MAPK Pi3K PKA PTEN PTEN translation Rac1 TSC1/2 Genes (%) HCC Liver Full *
*
*
*
*
*
*
*
*
*
*
*
*
*
*
*
*
*
*
*
*
*
*
*
*
*
*
*
*
HIF1A, LDLR, THBS1 AFP, EGR1, PRKAR1A CDKN1B, FOXM1, THBS1 EGR1, PPARG, TGFB, THBS1 CKB, CYP19A1, HK2 BHLHB2, CEBPA, HIF1A, THBS1 MYC CEBPA, MYCCEBPA, EGR1, HK2, TNFRSF1A
PRKAR1A, TNFRSF1A BHLHB2, CEBPA, CDKN1B, FOXM1, LDLR, PPARG, TGFB, THBS1 CDKN1B, FOXO1A, HK2, IRF1, LDLR MYC, HIF1A MYC
BHLHB2, CEBPA, EGR1, CREBBP, LDLR, MYC, PPARG, THBS1
*
0 10 20 30 40 50 Adiponectin Androgens Apoptosis BMPs Estrogens Fatty Acids HGF Hypoxia IGF1 IGF2 INFalpha Insulin (liver) Melatonin OxLDL OxPL Retinoic acids T3 TGFbeta TNFalpha Vitamin D3 Vitamin E Genes (%) HCC Liver Full **
*
*
*
*
*
*
*
*
**
*
*
*
*
*
*
*
**
*
*
*
*
*
*
*
*
*
*
*
*
StimuliB Intracellular pathways
A Stimulus
A Stimulus
B Intracellular pathways
0 20 40 60 80 Akt Akt translation betaCatenin Gb1/2 JNK Ki-Ras LKB1 Mek/Erk1/2 Methylation MKK5/Erk5 mTOR mTOR translation N-Ras P38MAPK Pi3K PKA PTEN PTEN translation Rac1 TSC1/2 Genes (%) HCC Liver Full **
*
*
*
*
*
*
*
*
*
*
*
*
*
*
*
*
*
*
*
*
*
*
*
*
*
*
*
HIF1A, LDLR, THBS1 AFP, EGR1, PRKAR1A CDKN1B, FOXM1, THBS1 EGR1, PPARG, TGFB, THBS1 CKB, CYP19A1, HK2 BHLHB2, CEBPA, HIF1A, THBS1 MYC CEBPA, MYCCEBPA, EGR1, HK2, TNFRSF1A
PRKAR1A, TNFRSF1A BHLHB2, CEBPA, CDKN1B, FOXM1, LDLR, PPARG, TGFB, THBS1 CDKN1B, FOXO1A, HK2, IRF1, LDLR MYC, HIF1A MYC
BHLHB2, CEBPA, EGR1, CREBBP, LDLR, MYC, PPARG, THBS1
*
0 10 20 30 40 50 Adiponectin Androgens Apoptosis BMPs Estrogens Fatty Acids HGF Hypoxia IGF1 IGF2 INFalpha Insulin (liver) Melatonin OxLDL OxPL Retinoic acids T3 TGFbeta TNFalpha Vitamin D3 Vitamin E Genes (%) HCC Liver Full **
*
*
*
*
*
*
*
*
**
*
*
*
*
*
*
*
**
*
*
*
*
*
*
*
*
*
*
*
*
StimuliHCC (set 2)
Datasets
505 (62.7%)
2473 (50.3%)
4736 (22.7%)
Transcription factors (53 sets)
453 (56.2%)
2529 (51.4 %)
5690 (27.3%)
Intracellular pathways (21 sets)
401 (49.8%)
2096 (42.6%)
4231 (20.3%)
Stimulus (24 sets)
806 (16.4%)
4918 (23.6%)
20839
31524
Full
Liver (set 1)
HepG2
Genome (Fatigo +)
Research Article
Gene network analysis leads to functional validation of pathways linked to cancer cell growth and survival. BERGER Emmanuelle VEGA Nathalie VIDAL Hubert GELOËN Alain 1
Lyon University, INSERM, UMR1060, F-69008 ; INRA 1235, CarMeN Laboratory, INSA-Lyon, INSA-Lyon, F69008 France.
*Corresponding author: Dr Emmanuelle Berger, PhD
CarMeN Laboratory, INSA-Lyon, Lyon, F69008 France. Mail: emmanuelle.danty@univ-lyon1.fr
Keywords: human hepatocellular carcinoma, signal transduction, real-time proliferation
assay.
Abbreviations:
ADIPOR1 and 2, adiponectin receptors 1 and 2 ; AMPK , 5’-AMP-activated protein kinase; BHLHB2, basic helix-loop-helix family, member e40 cAMP responsive element binding protein 1 ; CAR, constitutive androstane nuclear receptor ;
CEBPA, CCAAT/enhancer binding protein alpha; CEBPs, CCAAT/enhancer binding proteins ; COUP, chicken ovalbumin upstream promoter-transcription factor ; DMEM : Dubbelco’s minimum essential media ; FCS : fetal calf serum, FOXM1, forkhead box M1 ; FOXO1A, forkhead box O1 ; GO, gene ontology ; HCC, hepatocellular
carcinoma ; HES1, hairy and enhancer of split 1 ; HIF1A, hypoxia inducible factor 1, alpha subunit ; HNF4A , hepatic nuclear factor 4-alpha; HPRT1 : hypoxanthine phosphoribosyltransferase 1 ; JAK, Janus kinase ; JNK, Jun-NH2 kinase ; KROX or EGR, early growth response factor; CREB, LXR, liver X nuclear receptor ; MAPK, mitogen activated protein kinase ; MYC, v-myc myelocytomatosis viral oncogene homolog ; NFKBp65, Nuclear factor kappa B p65 subunit; PKC, protein kinase C ; PPARA and G, peroxisome-proliferator activated receptors alpha and gamma ; PTEN,
phosphatase and tensin homolog ; PXR, pregnane X nuclear receptor ; RAR , retinoic acid receptor; ROS, reactive oxigen species ; RTCA: real-time cell analyser ; RT-qPCR, real time quantitative polymerase chain reaction ; SREBP1, sterol regulatory element binding protein 1.
ABSTRACT
Hepatocellular carcinoma (HCC) represents one of the most frequent human cancers and efforts are needed to find alternative treatments to surgical resection, like intense screening of druggable targets. In this study we performed bioinformatic analyses of previously
published transcriptomic data in order to characterize liver specific networks, i.e. biological functions, signaling pathways and transcription factors, potentially deregulated in HCC. Then, by using real-time proliferation assay with specific inhibitors, we validated the in silico results. We found that G protein subunits Gi/G0, Protein kinase C, mitogen activated kinases
Mek1/2, and Erk1/2 (P42/44), Janus kinase JAK1, Peroxisome-proliferator activated
receptors alpha (PPARA) and Nuclear factor kappa B p65 subunit, were the major signaling pathways required for survival and proliferation in human HCC cell lines. We also found that these pathways regulate the expression of key hepatic transcription factors involved in cell differentiation, such as CCAAT/Enhancer binding protein alpha (CEBPA), Early growth response factor (EGR1), Forkhead box M1 (FOXM1) and the PPARs. Thus, our study shows that the combination of bioinformatic analyses and functional analyses provided the
1. Introduction
Hepatocellular carcinoma (HCC) represents more than 80% of primary, malignant liver tumors and many efforts are needed to find alternative treatments to surgical resection, including intensive screening of druggable targets [1]. It is well established that HCC are characterized by major alterations in gene expression, mainly related to cell growth and maintenance, cell cycle and cell proliferation as well as metabolism [2-4]. Several signaling pathways are also affected, like Wnt and MAPK pathways [5-7] with elevated expression and activation of P42/44 (Erk1/2) [8-9] and reduced P38 MAPK activity [10] in HCC. In addition a number of other kinases at the crosstalk between cell growth, stress and metabolism have also been associated to hepatocarcinogenesis, such as the energy sensor AMPK [11], Pi3kinase [12] and JAK/STATs [13]. These alterations are potentially associated with deregulation of key transcription factors, such as CEBPs and HNF4A [14-15]. However, despite this important bulk of data, it is still difficult to draw a clear picture of the molecular mechanisms deregulated in HCC. Given the availability of large amount of data in public databases, our objective in the present study was to find the major cellular pathways deregulated in human HCC. To this aim, we first analysed previously published
transcriptomic data of normal liver, in HCC and in HepG2 cells, in order to define the major biological functions, signaling pathways and transcriptions factors related to human HCC. Then, by using real-time proliferation assay in the presence of specific inhibitors of these signaling pathways, related to cell proliferation and/or survival, we validated the in silico approach in human HCC-derived cell lines.
2. Materials and methods 2.1. Data analysis
The sets of genes expressed in human normal liver, HCC and HepG2 cells were obtained from previous published studies (Supporting information, Table S1). Intracellular pathways or transcription factors modulated by various stimuli, were identified and retrieved from previously published experiments performed on different human cancer cell lines, and HepG2 cells (Supporting information, Table S2 and [16]).
Significantly over-represented biological functions were retrieved by using Fatigo+ software from http://babelomics.bioinfo.cipf.es. The putative transcription factors associated with these biological functions were found by using Fatigo+ software. Gene networks were built using the Ingenuity Systems Pathway analysis at www.ingenuity.com. The online TRED database was used to define the potential target genes for relevant transcription factors at
2.2. Cell culture, treatments and analyses
The human hepatocarcinoma-derived cell lines HepG2 and HuH7 were provided from the European Collection of Cell Cultures (ECACC, Salisbury, UK). HepG2 cell line originated from human HCC is widely used as in vitro model to study hepatic functions as well as their deregulations in hepatic disorders. Cells were grown at 37°C in 5% CO2 in DMEM
containing 10% fetal calf serum, complemented with streptomycin (100 mg/ml) and penicillin (100 units/ml). Cell proliferation and/or survival was monitored with the xCELLigence Real-time Cell Analyser (RTCA) System (Roche Diagnosis, Meylan, France), which allows label-free monitoring changes of cell number, viability, morphology and quality of cell attachment by measurement of cell-to electrode responses of cells seeded in E96-well plates
manufactured with integrated microelectronic sensor arrays. Analyses were first performed to select accurate plating density (10 000 cells per well), reaching stable proliferation rate within one day (cell index 0.5 to 1). For signaling pathway analyses, specific inhibitors were applied in serum-free media one day after plating. Drug concentrations were optimized for each compound according to IC50 and dose-response analyses (Supporting information, Table
S3). As we found that HepG2 cells are highly sensitive to serum deprivation, we had to adapt
the conditions to maintain cells in stable proliferating rate and thus the duration of the treatments was limited (not more than 24 hours) when studying the effects of drugs and inhibitors. The results are representative of at least three independent experiments and each condition was tested in at least 5 replicates.
2.3. Messenger RNA quantification by real time PCR
Total RNA purifications from HepG2 cells were performed according to standard protocol (Qiagen Quick prep mRNA, Qiagen, Courtaboeuf, France) including a DNase treatment. RNA integrity was assessed with the Agilent 2100 Bioanalyzer and RNA 6000 LabChip Kit (Agilent Technologies, Massy, France). First strand cDNAs were synthesized from 500 ng of total RNA in the presence of 100 U of Superscript (Invitrogen-Life Technologies, Eragny, France) and random hexamers and oligodT primers (Promega, Charbonnières, France). Real-time PCR was performed using ABsolute™ QPCR SYBR® Green ROX Mix (Abgene, Courtaboeuf, France) with a Rotor-GeneTM 6000 system (Corbett Life Science,
Cambridgeshire, UK). Levels of target mRNAs were normalized to hypoxanthine
phosphoribosyltransferase 1 (HPRT1) expression measured in all samples by RT-qPCR. All quantifications were performed at least on three independent experiments and data are presented as mean ± SEM. Gene names, references, functions, primers and respective qPCR conditions are reported in Supporting information, Table S4.
3. Results
3.1. Bioinformatic analysis of hepatic genes related to normal and HCC phenotypes.
We first define a list of genes commonly expressed in HepG2 cell line and in human normal liver (Figure 1) from published global transcriptomic data. Then, we selected a second set of genes with altered expression in human HCC (806 genes). These two lists of genes were compared by using Fatigo+ software in order to identify significantly enriched biological functions in human HCC. Figure 2A shows that they were linked to metabolism, cell proliferation and cell death. An analysis of biological processes over-represented in HCC versus hepatic HepG2 genes revealed a significant deregulation of genes involved in
metabolism and coagulation (Figure 2B). Genes representative of these biological functions were selected for further analyses (Supporting information, Table S4). Using Ingenuity software, we constructed the relationships between genes involved liver functions
(Supporting information, Figure S1A), hepatic diseases (Supporting information, Figure
S1B) and in hepatic canonical pathways (Supporting information, Figure S1C). We found
a number of links suggesting the implication of these genes in HCC and in liver cell proliferation and survival.
3.2. Signaling pathways over-represented in set of genes deregulated in human HCC
We next identified by computational analyses, different groups of genes regulated by external stimuli (21 different conditions) or intracellular signaling pathways (20 different conditions) expressed in normal liver (gene set 1) but deregulated in HCC (gene set 2). (Figure 3; references of gene sets are reported in Supporting information, Tables S2). We found that the list of genes deregulated in HCC is significantly enriched in genes also
regulated by insulin, by fatty acids and adiponectin, by retinoic acids, by stress conditions (such as oxidized lipids and hypoxia) and during apoptosis. Furthermore, there is a specific enrichment in genes under the control of the Ras-coupled pathways Mek/Erk and P38MAPK, the JNK pathway and the PTEN/Pi3K pathway.
3.3. Transcription factors regulating hepatic and HCC gene expression
In order to determine the transcription network involved in hepatic function in HepG2 (set 1) and deregulated in HCC (set 2) , we searched for transcription factors having putative binding sites in the promoter regions of these 2 sets of genes by using Fatigo+ software. Twenty-eight significant binding sites appeared to be over-represented in the promoter region of both sets in comparison to the human genome (Figure 4A) and are linked to transcription factors known to be involved in the regulation of cell cycle (E2Fs, MYC), to MAPK-regulated pathways (KROX, Elk1, CREB), to metabolic pathways, such as PPARs,
SREBP1 and other nuclear receptors (LXR, PXR, CAR, COUP, RAR), and to inflammatory response (NFKB and c-Rel).
In order to determine whether the 28 transcription factors with significant over-represented binding sites in the promoter region of gene sets 1 and 2 were functional, we analysed the lists of genes regulated by 53 different transcription factors in human tissues (Figure 4B). This second approach thus took into account experimental data obtained mainly in cancer cell lines, including HepG2 cells, and have been previously published [16]. A set of 4736 genes (i.e. 22.7% of human genome) regulated by at least one of these transcription factors was retrieved, also regulating 50.3% of genes in set 1 and 62.7 % in set 2 (Figure 1). We found an over-representation of genes regulated by 34 transcription factors in either normal liver or HCC gene sets, including CEBPs, E2Fs, EGR1, FOXO1A, HNFs, MYC, NFKB and PPARs. Importantly, 16 of these transcription factors regulate expression of genes present in HCC gene set, including hepatic genes regulated by CEPBA and CEBPB, FOXO1A, HNF4A, PPARs, steroid responsive transcriptions factors (ESR1 and 2, LXR), and stress and
apoptosis linked transcription factors such as TP53 or HIF1A. NFKB and E2Fs.
3.4. HepG2 cell growth, proliferation and survival depend on basal MAPK activities.
We then investigated the potential implication of the signaling pathways identified by
computational analyses (Figure 3) on hepatic cell growth, proliferation and survival. HepG2 cells were treated with a panel of specific kinase inhibitors and corresponding vehicles as controls (Supporting information, Table S3) and their growth was monitored with
xCELLigence System using Real-time Cell Analyser (RTCA) Instrument. Cell indexes, which represent cell surface occupancy, and thus cell number, were normalized at time of treatment (one day after plating) and slopes of resulting curves were calculated after treatment (Figure
5 ; Supporting information, Figure S2). Among the 15 pathways explored, only 6 inhibitors
were found to significantly affect HepG2 cell proliferation. Inhibition of adenylate cycle slightly but significantly increased HepG2 cell proliferation. HepG2 cell survival was affected in less than one hour in a dose-dependent manner by specific inhibitors of P42/44, PKC and Mek1/2 respectively (Figure 5A). HepG2 cell proliferation was found to be reduced after one day by specific inhibitors of Gi/G0 and JAK1 (not JAK2 and JAK3) and in a lesser extend JNK (Figure 5B). Similar effects were observed for both P42/44 and JNK inhibitors when applied on HuH7 cells (Supporting information, Figure S2B).
3.5. Characterization of genes and transcription factors linked to HepG2 cell proliferation and survival
Finally, in order to experimentally validate the implication of the different signaling pathways identified, we measured the expression level of a selected number of genes expressed in
HepG2 cells treated with specific inhibitors of either Gi/G0, P42/44, Mek1/2, PKC and JAK1 pathways. The whole RT-qPCR data are reported in Supporting information, Table S5. An integrative view of the results obtained by both computational analyses of gene data sets and RT-qPCR is provided in Figure 6. We found that ADIPOR2, BHLHB2, FOXM1, HES1 and LDLR were repressed and CEBPA was induced by basal activity of either Gi/G0, P42/44 and PKC. These 6 genes were further used to identify candidate transcription factors involved in their regulation. According to transcriptional data in human cells (cf Figure 4), these genes might be regulated by at least 23 types of transcription factors, 9 of them being involved in P42/44 signaling pathway (i .e CREB, EGR1, Ets, JUN, MYC, NFKB, PPARA and G, and SREBP1A), 4 of them could be regulated by CREB, NFKB, PPARA and PPARG. Interstingly, genes regulated by either NFKB, PPARA and PPARG are also over-represented in both normal liver and in HCC gene sets (cf Figure 4). As an example, we validated that PPARA, a major nuclear factor controlling hepatic metabolism, was a transcriptional activator of EGR1, FOXM1, HES1 and ADIPOR2, and inhibited CEBPA gene transcription in HepG2 cells (Table 1). RTCA monitoring revealed that PPARA specific inhibitor GW6471 significantly affected HepG2 survival in a dose-dependent manner, while its specific activator GW7647 had no significant effect (Figure 5C). In addition, by using its specific inhibitor Wedelolactone we also found that NFKBp65 was required for HepG2 cell proliferation (Figure 5C). The effects of both GW6471 and Wedelactone were also observed on HuH7 cell line
(Supporting information, Figure S2B).
4. Discussion
In this study, we report the identification of transcription networks and signaling pathways involved in normal hepatic functions being deregulated in human HCC. These results were obtained by computational analyses of published data sets. They were then validated by using real-time cell proliferation assays on HepG2 cells treated by specific inhibitors of signaling pathways and by quantification of gene expression levels. The present study provides therefore a comprehensive global picture of the complex networks including specific signaling pathways, transcription factors and gene regulations potentially contributing to the proliferation of transformed liver cells. As expected, most of the major features already described in the literature were found and thus confirmed in this study, such as hepatic specialization in regulation of metabolism and deregulation of cell growth and survival pathways in HCC.
The process of tumorigenesis involves deregulations of pathways controlling cell growth, proliferation and survival in normal conditions. These are due to abnormal responses to external stimuli and/or to defective intracellular regulations of these pathways. Using computational analyses of published data sets obtained in human cells or tissues we
identified biological pathways and gene networks over-represented in HepG2 and in HCC and we confirmed their implication in cell proliferation using Real-time cell Analyser Instrument (xCELLigence system).
Among the signaling pathways involved in HepG2 cell survival, which are either
over-expressed or up-regulated in HCC, we identified PKC [17], P42/44 [10], Gi/G0 [18] as well as NFKBp65 [19] and JAK1 (but not JAK2 nor JAK3). JAK/STAT pathways are involved in the progression of cell cycle and to confer resistance to apoptosis [20, 21]. Our result can be explained by the fact that JAK1 inhibitor butein may also activate JNK and ROS production in HepG2 cells, leading to cell cycle arrest and apoptosis [22]. The lack of effect of the JAKs could be a consequence of the well described constitutive activation of STAT3 in most HCC as well as in HepG2 cells [23].
PKC is known to activate NFKB by isoform alpha and P42/44 by isoform beta in HCC [24]. In our study, NFKB was identified by both computational analyses of enriched transcription factor target genes and binding site enrichment in HepG2 and HCC. Moreover basal NFKBp65 activity appeared to be required for HepG2 cell growth. These results are in accordance with other studies showing that inhibition of NFKB as well as PKCalpha isoform in HepG2 cells can induce apoptosis [25] and that p65 subunit is involved in HepG2 cell survival [26, 27]. The second pathway regulated by PKC is linked to P42/44. High levels of basal P42/44 activated form in HCC has been shown to involve the Ras/Mek/Erk/FOXM1 pathway [28]. We found here that P42/44 inactivation led to cell death in HepG2 and to cell cycle arrest in HuH7 cells. Moreover we found a regulation of FOXM1 gene expression by PKC and by P42/44 itself. In other studies, FOXM1 has been found to exert an anti-apoptotic activity in HCC and is up-regulated in liver cancer [29, 30]. P42/44 is known to regulate the activity of the transcription factor MYC, which was also regulated at the transcriptional level in HepG2 by both PKC and P42/44 pathways in our experiments. MYC is considered as a tumor suppressor because of its pro-apoptotic activity and its down-regulation in both HCC and liver cancers [31]. EGR1 is another tumor suppressor known to be regulated by the P42/44 signaling pathway. We found that inhibition of P42/44 activity in HepG2 cells strongly induced expression of EGR1 gene. In the same way, its transcription is down-regulated in HCC and liver cancers [32], suggesting that EGR1 may play important roles in liver cancers. PKC and P42/44 also regulate the transcriptional activity of nuclear receptors PPARs [33]. Whether the PPARs are involved in hepatocellular carcinogenesis remains elusive. In several studies, activation of PPARG has been shown to induce apoptosis in HepG2 cells [34-37] and to reduce tumor growth in HCC [38, 39], and microarrays data suggest that PPARG may regulate BHLHB2, CEBPA, EGR1 and FOXO1A in HepG2 cells [40]. In the present study, we found that PPARA also regulates transcription of EGR1, FOXO1A and FOXM1. PPARA is highly expressed in liver where it is a key regulator of lipid metabolism
and its regulatory activity on fatty acid oxidation has been established in HepG2 cells [41-43]. In both HepG2 and HuH7 cell lines we did not found any effect of PPARA activation on cell growth and/or survival, however its inactivation greatly affected their survival. These results are in accordance with the hypothesis that PPARA basal activity may protect liver cancer cells from death. Recent experiments on HepG2 cells support the hypothesis that PPARG activation may be related to cell proliferation while activation of PPARA leads to apoptosis [44]. In liver PPARA appears to regulate cell cycle progression and cell survival through P38MAPK pathway [45] [45]. This nuclear receptor has also be found to stimulate hepatic carcinogenesis in mice liver [46]. Taken together, these data point out a key role of PPARA in HCC.
Interestingly, we found that transcription of CEBPA, another important hepatic transcription factor, was induced by the basal activity of PKC, Gi/G0, Mek1/2 and P42/44. In humans CEBPA is highly expressed in liver [47] where it regulates hepatic cell differentiation by strong arrest of cell proliferation [48, 49]. CEBPA gene expression is deregulated in HCC [6] and recently, epigenetic mechanisms have been proposed to explain how CEBPA could be deregulated in HepG2 cells [50, 51]. Our computational analyses also support the hypothesis of deregulation in methylation status in HCC genes (Figure 3B). We also found that CEBPA gene expression was induced by PPARA in HepG2 cells. Thus altered expression of CEBPA in many HCC might be the consequence of deregulations in the process of chromatine methylation, in activity or in transcriptional regulation of transcription factors, such as MYC [52] or PPARs [40]. Therefore a finely tuned regulation of CEBPA may represent a key event involved in the process of hepatic tumorigenesis.
In conclusion, combinatorial analyses of the global gene transcription networks, real time proliferation assay analysis of selected signaling pathways and gene expression analyses converged to identify key signaling pathways deregulated in human HCC. First we identified pathways related to cell survival (P42/44, PKC, Mek1/2, PPARA) and pathways involved in cell growth and proliferation (Gi/G0, JAK1, JNK and NFKB) in HCC cell lines. Second these pathways commonly control the expression of key transcription factors (i.e. they inhibit several tumor suppressors and they activate liver cell differentiation factor CEBPA). Most of the results are in agreement with published data, and this approach gives the opportunity to depict in few and rapid experiments an overall view of the molecular mechanisms involved in cell growth and proliferation.
ACKNOWLEDGEMENTS
We would like to thank Emilie Viey (Roche Applied Science team from Roche Diagnosis) for her kind technical support and Sophie Rome for revisiting the English text.
REFERENCES
[1] Tanaka, S., Arii, S., Molecular targeted therapy for hepatocellular carcinoma in the current and potential next strategies. J Gastroenterol 2010, 46, 289-296.
[2] Patil, M. A., Gutgemann, I., Zhang, J., Ho, C., et al., Array-based comparative genomic hybridization reveals recurrent chromosomal aberrations and Jab1 as a potential target for 8q gain in hepatocellular carcinoma.
Carcinogenesis 2005, 26, 2050-2057.
[3] Aburatani, S., Sun, F., Saito, S., Honda, M., et al., Gene systems network inferred from expression profiles in hepatocellular carcinogenesis by graphical Gaussian model. EURASIP J Bioinform Syst Biol 2007, 47214. [4] Teufel, A., Staib, F., Kanzler, S., Weinmann, A., et al., Genetics of hepatocellular carcinoma. World J
Gastroenterol 2007, 13, 2271-2282.
[5] Hoshida, Y., Toffanin, S., Lachenmayer, A., Villanueva, A., et al., Molecular classification and novel targets in hepatocellular carcinoma: recent advancements. Semin Liver Dis 2010, 30, 35-51.
[6] Whittaker, S., Marais, R., Zhu, A. X., The role of signaling pathways in the development and treatment of hepatocellular carcinoma. Oncogene, 29, 4989-5005.
[8] Ito, Y., Sasaki, Y., Horimoto, M., Wada, S., et al., Activation of mitogen-activated protein kinases/extracellular signal-regulated kinases in human hepatocellular carcinoma. Hepatology 1998, 27, 951-958.
[9] Zender, L., Villanueva, A., Tovar, V., Sia, D., et al., Cancer gene discovery in hepatocellular carcinoma. J
7epatol 2010, 52, 921-929.
[9] Schmidt, C. M., McKillop, I. H., Cahill, P. A., Sitzmann, J. V., The role of cAMP-MAPK signalling in the regulation of human hepatocellular carcinoma growth in vitro. Eur J Gastroenterol Hepatol 1999, 11, 1393-1399. [10] Iyoda, K., Sasaki, Y., Horimoto, M., Toyama, T., et al., Involvement of the p38 mitogen-activated protein kinase cascade in hepatocellular carcinoma. Cancer 2003, 97, 3017-3026.
[11] Adachi, M., Brenner, D. A., High molecular weight adiponectin inhibits proliferation of hepatic stellate cells via activation of adenosine monophosphate-activated protein kinase. Hepatology 2008, 47, 677-685.
[12] Ng, S. K., Neo, S. Y., Yap, Y. W., Karuturi, R. K., et al., Ablation of phosphoinositide-3-kinase class II alpha suppresses hepatoma cell proliferation. Biochem Biophys Res Commun 2009, 387, 310-315.
[13] Calvisi, D. F., Ladu, S., Pinna, F., Frau, M., et al., SKP2 and CKS1 promote degradation of cell cycle regulators and are associated with hepatocellular carcinoma prognosis. Gastroenterology 2009, 137, 1816-1826 e1811-1810.
[14] Xu, L., Hui, L., Wang, S., Gong, J., et al., Expression profiling suggested a regulatory role of liver-enriched transcription factors in human hepatocellular carcinoma. Cancer Res 2001, 61, 3176-3181.
[15] Tomizawa, M., Horie, H., Yamamoto, H., Matsunaga, T., et al., Reciprocal expression of CCAAT/enhancer binding proteins alpha and beta in hepatoblastomas and its prognostic significance. Oncol Rep 2007, 17, 341-344.
[16] Berger, E., Rome, S., Vega, N., Ciancia, C., Vidal, H., Transcriptome profiling in response to adiponectin in human cancer-derived cells. Physiol Genomics 2010, 42, 61-70.
[17] Chang, K. J., Lin, J. K., Lee, P. H., Hsieh, Y. S., et al., The altered activity of membrane-bound protein kinase C in human liver cancer. Cancer Lett 1996, 105, 211-215.
[18] Schmidt, C. M., McKillop, I. H., Cahill, P. A., Sitzmann, J. V., Alterations in guanine nucleotide regulatory protein expression and activity in human hepatocellular carcinoma. Hepatology 1997b, 26, 1189-1194. [19] Tsai, J. H., Hsieh, Y. S., Kuo, S. J., Chen, S. T., et al., Alteration in the expression of protein kinase C isoforms in human hepatocellular carcinoma. Cancer Lett 2000, 161, 171-175.
[20] Fuke, H., Shiraki, K., Sugimoto, K., Tanaka, J., et al., Jak inhibitor induces S phase cell-cycle arrest and augments TRAIL-induced apoptosis in human hepatocellular carcinoma cells. Biochem Biophys Res Commun 2007, 363, 738-744.
[21] Kusaba, M., Nakao, K., Goto, T., Nishimura, D., et al., Abrogation of constitutive STAT3 activity sensitizes human hepatoma cells to TRAIL-mediated apoptosis. J Hepatol 2007, 47, 546-555.
[22] Moon, D. O., Kim, M. O., Choi, Y. H., Hyun, J. W., et al., Butein induces G(2)/M phase arrest and apoptosis in human hepatoma cancer cells through ROS generation. Cancer Lett 2010, 288, 204-213.
[23] Sasse, J., Hemmann, U., Schwartz, C., Schniertshauer, U., et al., Mutational analysis of acute-phase response factor/Stat3 activation and dimerization. Mol Cell Biol 1997, 17, 4677-4686.
[24] Hah, N., Lee, S. T., An absolute role of the PKC-dependent NF-kappaB activation for induction of MMP-9 in hepatocellular carcinoma cells. Biochem Biophys Res Commun 2003, 305, 428-433.
[25] Chiao, P. J., Na, R., Niu, J., Sclabas, G. M., et al., Role of Rel/NF-kappaB transcription factors in apoptosis of human hepatocellular carcinoma cells. Cancer 2002, 95, 1696-1705.
[26] Alisi, A., Piemonte, F., Pastore, A., Panera, N., et al., Glutathionylation of p65NF-kappaB correlates with proliferating/apoptotic hepatoma cells exposed to pro- and anti-oxidants. Int J Mol Med 2009, 24, 319-326. [27] Wu, L. F., Li, G. P., Su, J. D., Pu, Z. J., et al., Involvement of NF-kappaB activation in the apoptosis induced by extracellular adenosine in human hepatocellular carcinoma HepG2 cells. Biochem Cell Biol 2010, 88, 705-714. [28] Feo, F., Frau, M., Tomasi, M. L., Brozzetti, S., Pascale, R. M., Genetic and epigenetic control of molecular alterations in hepatocellular carcinoma. Exp Biol Med (Maywood) 2009, 234, 726-736.
[29] Pilarsky, C., Wenzig, M., Specht, T., Saeger, H. D., Grutzmann, R., Identification and validation of commonly overexpressed genes in solid tumors by comparison of microarray data. Neoplasia 2004, 6, 744-750.
[30] Sun, H. C., Li, M., Lu, J. L., Yan, D. W., et al., Overexpression of Forkhead box M1 protein associates with aggressive tumor features and poor prognosis of hepatocellular carcinoma. Oncol Rep 2011, 25, 1533-1539.
[31] Yuen, M. F., Wu, P. C., Lai, V. C., Lau, J. Y., Lai, C. L., Expression of c-Myc, c-Fos, and c-jun in hepatocellular carcinoma. Cancer 2001, 91, 106-112.
[32] Hao, M. W., Liang, Y. R., Liu, Y. F., Liu, L., et al., Transcription factor EGR-1 inhibits growth of hepatocellular carcinoma and esophageal carcinoma cell lines. World J Gastroenterol 2002, 8, 203-207.
[33] Burns, K. A., Vanden Heuvel, J. P., Modulation of PPAR activity via phosphorylation. Biochim Biophys Acta 2007, 1771, 952-960.
[34] Okano, H., Shiraki, K., Inoue, H., Yamanaka, T., et al., Peroxisome proliferator-activated receptor gamma augments tumor necrosis factor family-induced apoptosis in hepatocellular carcinoma. Anticancer Drugs 2002,
13, 59-65.
[35] Toyoda, M., Takagi, H., Horiguchi, N., Kakizaki, S., et al., A ligand for peroxisome proliferator activated receptor gamma inhibits cell growth and induces apoptosis in human liver cancer cells. Gut 2002, 50, 563-567. [36] Li, M. Y., Deng, H., Zhao, J. M., Dai, D., Tan, X. Y., PPARgamma pathway activation results in apoptosis and COX-2 inhibition in HepG2 cells. World J Gastroenterol 2003, 9, 1220-1226.
[37] Zhou, Y. M., Wen, Y. H., Kang, X. Y., Qian, H. H., et al., Troglitazone, a peroxisome proliferator-activated receptor gamma ligand, induces growth inhibition and apoptosis of HepG2 human liver cancer cells. World J
Gastroenterol 2008, 14, 2168-2173.
[38] Koga, H., Harada, M., Ohtsubo, M., Shishido, S., et al., Troglitazone induces p27Kip1-associated cell-cycle arrest through down-regulating Skp2 in human hepatoma cells. Hepatology 2003, 37, 1086-1096.
[39] Yu, J., Qiao, L., Zimmermann, L., Ebert, M. P., et al., Troglitazone inhibits tumor growth in hepatocellular carcinoma in vitro and in vivo. Hepatology 2006, 43, 134-143.
[40] Tachibana, K., [Application of the human hepatoblastoma cell lines inducibly expressing peroxisome proliferator-activated receptors (PPARs)]. Yakugaku Zasshi 2007, 127, 1223-1229.
[41] Watkins, P. A., Ferrell, E. V., Jr., Pedersen, J. I., Hoefler, G., Peroxisomal fatty acid beta-oxidation in HepG2 cells. Arch Biochem Biophys 1991, 289, 329-336.
[42] Gulick, T., Cresci, S., Caira, T., Moore, D. D., Kelly, D. P., The peroxisome proliferator-activated receptor regulates mitochondrial fatty acid oxidative enzyme gene expression. Proc Natl Acad Sci U S A 1994, 91, 11012-11016.
[43] Lee, W. N., Lim, S., Bassilian, S., Bergner, E. A., Edmond, J., Fatty acid cycling in human hepatoma cells and the effects of troglitazone. J Biol Chem 1998, 273, 20929-20934.
[44] Maggiora, M., Oraldi, M., Muzio, G., Canuto, R. A., Involvement of PPARalpha and PPARgamma in apoptosis and proliferation of human hepatocarcinoma HepG2 cells. Cell Biochem Funct 2011, 28, 571-577. [45] Cosulich, S., James, N., Roberts, R., Role of MAP kinase signalling pathways in the mode of action of peroxisome proliferators. Carcinogenesis 2000, 21, 579-584.
[46] Glauert, H. P., Calfee-Mason, K., Li, Y., Nilakantan, V., et al., The Role of NF-kappaB in PPARalpha-Mediated Hepatocarcinogenesis. PPAR Res 2008, 2008, 286249.
[47] Shyamsundar, R., Kim, Y. H., Higgins, J. P., Montgomery, K., et al., A DNA microarray survey of gene expression in normal human tissues. Genome Biol 2005, 6, R22.
[48] Diehl, A. M., Johns, D. C., Yang, S., Lin, H., et al., Adenovirus-mediated transfer of CCAAT/enhancer-binding protein-alpha identifies a dominant antiproliferative role for this isoform in hepatocytes. J Biol Chem 1996, 271, 7343-7350.
[49] Harris, T. E., Albrecht, J. H., Nakanishi, M., Darlington, G. J., CCAAT/enhancer-binding protein-alpha cooperates with p21 to inhibit cyclin-dependent kinase-2 activity and induces growth arrest independent of DNA binding. J Biol Chem 2001, 276, 29200-29209.
[50] Lu, G. D., Leung, C. H., Yan, B., Tan, C. M., et al., C/EBPalpha is up-regulated in a subset of hepatocellular carcinomas and plays a role in cell growth and proliferation. Gastroenterology 2010, 139, 632-643, 643 e631-634. [51] Dannenberg, L. O., Edenberg, H. J., Epigenetics of gene expression in human hepatoma cells: expression profiling the response to inhibition of DNA methylation and histone deacetylation. BMC Genomics 2006, 7, 181. [52] Li, T., Wan, B., Huang, J., Zhang, X., Comparison of gene expression in hepatocellular carcinoma, liver development, and liver regeneration. Mol Genet Genomics 2010, 283, 485-492.
LEGENDS OF FIGURES
Table 1: mRNA levels of target genes modulated by peroxisome-proliferator activated
receptors alpha activator GW7647 (1 µM) in HepG2 cells (cultured for 5 hours without serum). Fold changes (stimulated versus control) were normalized to HPRT1, significantly modulated genes identified by ANOVA test (p < 0.001). For complete gene names and sequence references, see Supporting information, Table S4.
Genes activated by GW7647: EGR1 8.45±0.12 PPARGC1A 3.76±0.60 HES1 1.81±0.02 ADIPOR1 1.79±0.04 FOXM1/HNF3 1.75±0.04 AFP 1.73±0.41 CREBBP 1.65±0.05 Genes repressed by GW7647: CEBPA 0.42±0.01
Genes not modulated by GW7647:
Figure 1: The 31 525 of human genes contained in the Fatigo+ database were separated
into subsets. Set 1 contained the hepatic genes detected in HepG2 cells; set 2 the hepatic genes deregulated in hepatocellular carcinoma and present in HepG2 cells. Then we
determined, among these 2 subsets of genes, the percentage of genes affected by different external stimuli, or modulated by known intracellular pathways and transcription factors by using previously published data which are reported in the Supporting information, Tables S1 and S2.
Figure 2 : Functional enrichment analysis of the biological functions by using Fatigo+
software in (A ) Hepatic genes expressed in HepG2 (gene set 1) and deregulated in hepatocellular carcinoma (HCC, gene set 2) compared to all human genes (31 524 genes). Only most representative biological functions. i.e. highest hierarchical clustering Level 6, are presented and were found to be significantly over-represented in both gene sets (Fisher's exact test, adjusted p-value <0.001). (B) Biological functions significantly over-represented in the list of HCC genes (gene set 2) in comparison to hepatic genes (gene set 1) (highest hierarchical clustering Levels 3-5). X-axis represents the number of genes involved in these functions in either healthy liver and in HCC. Genes selected for further analyses are indicated on the right side of the panel. For complete gene names, see Supporting information, Table S4.
Figure 3 : Identification of signaling pathways specifically over-represented in human healthy
liver and in hepatocellular carcinoma (HCC) from analysis of previously published transcriptional data. Frequency of genes regulated (x-axis) by either (A) external signals (Stimulus, 21 data sets) and (B) intracellular signaling pathways (20 data sets) were calculated with sets of genes detected in HepG2 cells (Full set), specific to healthy liver and deregulated HCC. Significant differences (i.e. Z-test scores with confidence level > 90) indicated by asterisks represent pathways over-represented in either liver and HCC sets potentially linked to hepatic functions, significant differences in HCC versus liver (barrels and asterisks) identify pathways which may be affected in HCC. Target genes selected for validation by qRT PCR analysis are shown in italics. For complete gene names and references, see Supporting information, Table S4. Sets of human genes retrieved from published global gene analyses (According to the procedure previously described [16]). Complete data and references are provided in Supporting information, Table S2.