HAL Id: cea-01815552
https://hal-cea.archives-ouvertes.fr/cea-01815552
Submitted on 24 Mar 2020
HAL is a multi-disciplinary open access archive for the deposit and dissemination of sci-entific research documents, whether they are pub-lished or not. The documents may come from teaching and research institutions in France or abroad, or from public or private research centers.
L’archive ouverte pluridisciplinaire HAL, est destinée au dépôt et à la diffusion de documents scientifiques de niveau recherche, publiés ou non, émanant des établissements d’enseignement et de recherche français ou étrangers, des laboratoires publics ou privés.
Tilted Fibre Bragg Gratings and Phase Sensitive-Optical
Low Coherence Interferometry for refractometry and
liquid level sensing
A. Obaton, G. Laffont, C. Wang, A. Allard, P. Ferdinand
To cite this version:
A. Obaton, G. Laffont, C. Wang, A. Allard, P. Ferdinand. Tilted Fibre Bragg Gratings and Phase Sensitive-Optical Low Coherence Interferometry for refractometry and liquid level sensing. Sensors and Actuators A: Physical , Elsevier, 2013, 189, pp.451-458. �10.1016/j.sna.2012.10.020�. �cea-01815552�
Tilted Fiber Bragg Gratings and Phase Sensitive-Optical Low Coherence Interferometry for refractometry and liquid level sensing
A-F. Obaton1, G. Laffont2, C. Wang1, A. Allard1, and P. Ferdinand2
1 Laboratoire national de métrologie et d'essais (LNE), Laboratoire commun de métrologie LNE-CNAM (LCM), 29
av. Roger Hennequin, 78197 Trappes Cedex, France [email protected]
2 CEA LIST, Laboratoire de Mesures Optiques, 91191 Gif-sur-Yvette, France [email protected]
Abstract
A set-up based on an interferometric technique and including tilted Fiber Bragg Gratings has been used to provide refractive index and liquid level measurements. Such gratings have been investigated using the well-known Phase Sensitive-Optical Low Coherence Interferometry technique. This combination provides very promising refractometry sensing results, as the relative uncertainty on measurement is lower than 0.04 % in the range 1.37-1.40. and shows a clear potential in liquid level sensing.
Keywords
Optical Fiber Sensor; Tilted Fiber Bragg Grating; Liquid level sensor; Refractometry; Interferometry
1. Introduction
Fiber Bragg Gratings (FBGs) [1] have existed since the photosensitivity process in optical fibers was discovered in 1978 [2, 3]. They are now well-characterized and used in a variety of high-performance communication systems as well as in many sensing devices. In the field of sensing, standard FBGs are usually used to transduce physical parameters such as temperature, strain and pressure [4, 5, 6, 7]. Nevertheless, they are not appropriate to measure bio-chemical parameters of liquids surrounding the fiber since the light diffracted by the grating does not interact at all with such external medium. To extend their application in this field, specific gratings diffracting light toward the external medium have to be used. Tilted FBGs [8] can bear such a function by diffracting the guided light toward the outside of the optical guiding core. Accordingly, they are proposed here as optical transducers measuring any refractive index change of a liquid surrounding the fiber, i.e. for refractometry and liquid level sensing. TFBGs have already been used for refractometry applications, connected to a tunable laser source and a simple photodetector [9, 10]. Concerning FBG-based level sensors, several technologies have been mentioned in scientific publications [11, 12, 13, 14] but none of them includes a TFBG-based transducer. Therefore, the combination of TFBGs and the Phase Sensitive-Optical Low Coherence Interferometry technique (PS-OLCI) for both refractometry and liquid level sensing has never been suggested . PS-OLCI has several advantages compared to conventional techniques such as tunable laser source and classical photodetector, which only provide the amplitude of the optical spectrum. Indeed, PS-OLCI delivers information simultaneously in the spectral and spatial domains. Moreover, in the spectral domain, such a technique provides both real and imaginary components (respectively amplitude and phase) of the optical signal spectrum. If the phase does not present any interest in our application, it is however very useful to characterise chromatic dispersion of the optical fibers [15]. On the other hand, information in the spatial domain should be of particular interest for liquid level sensing, as they are more straightforward to interpret than information in the spectral domain to perform a quantitative analysis of the influence of liquid level.
In this paper, we will define TFBGs as well as the PS-OLCI technique. Then, we will present the measurements performed with PS-OLCI and TFBGs considering a set of index liquids and different levels of liquid in which the TFBG is immerged.
2. Tilted Fiber Bragg Gratings (TFBG)
The capability to photo-imprint gratings in optical fibers requires the glass to be photosensitive. This phenomenon, called photosensitivity, involves the irradiation of an optical waveguide with a laser beam of ultraviolet light to change the refractive index of the fiber core (Fig. 1). By irradiating the fiber core
with an intensive pattern that has a periodic (or even aperiodic) distribution (Fig. 1), a corresponding index perturbation is permanently induced. The result is an index grating that is photo-imprinted in the optical core waveguide.
Figure 1: Scheme from P. Ferdinand [16] of irradiation of a fiber by ultraviolet light for FBG photowriting.
A specific setup has been developed at the CEA LIST in order to photowrite tilted FBG in standard singlemode fibers [9].
A Tilted Fiber Bragg Grating (TFBG) is a periodic or aperiodic perturbation of the effective refractive index of the guiding core of an optical waveguide (Fig. 2) [8].
Figure 2: Scheme of a Tilted Fiber Bragg Grating.
In a TFBG, the variation of the refractive index is tilted with respect to the optical axis. This enhances coupling between the forward-propagating core mode and the contra-propagating cladding modes. Thus, TFBGs diffract the guided light toward the cladding at several predetermined narrow spectral locations or resonance wavelengths, while passing all the other wavelengths of light. Consequently, they are usually characterized by their transmission spectrum (Fig. 3) as the light diffracted backwards by TFBGs is no longer guided by the core (and experiences high optical losses).
Figure 3: Transmission spectrum of a TFBG in a single-mode fiber.
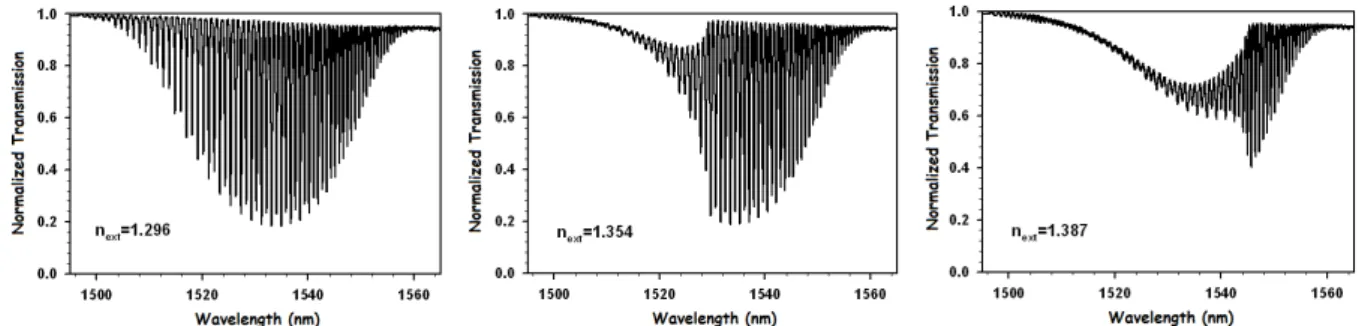
The resonances composing the spectral transmission response of a TFBG are modified by external refractive index changes. Wavelength resonances associated with cladding refractive index values lower than the external refractive index are not guided any more, since the interface between the cladding and the external medium has disappeared. The spectra shown on Fig. 4 are processed using a dedicated and
patented signal processing technique [17] in order to retrieve the refractive index surrounding the fiber accurately.
Figure 4: Spectral response of a tilted FBG to three different refractive index surrounding the fiber.
Such TFBGs are entirely appropriate for refractometry and liquid level measurements. Refractometers based on this principle reach a resolution of 10-5 for refractive index values in the range 1.3-1.45 [10, 18, 19]. For instance they have been used in cure monitoring of epoxy-based resins for composite material manufacturing. These components may also find applications in bio-chemical photonics [20]. Detection of target molecules such as proteins first requires the additional development of specific fiber coating. Such transverse developments require skills not only in metrology and guided optics but also in research fields such as surface bio-functionalization and characterization.
3. Phase Sensitive-Optical Low Coherence Interferometry (PS-OLCI)
A PS-OLCI is a Michelson interferometer illuminated with a broadband source (BBS). The Device Under Test (DUT) is inserted into the test arm of the interferometer, whereas the reference arm contains a variable-length path so that the total optical path difference of the interferometer can be varied. The basic principle of a Michelson interferometer is that interference fringes are observed only if the difference in optical path between both arms matches the coherence length of the light source. As the source is large, its coherence length is small, therefore interferograms are very localized and resolved spatially.
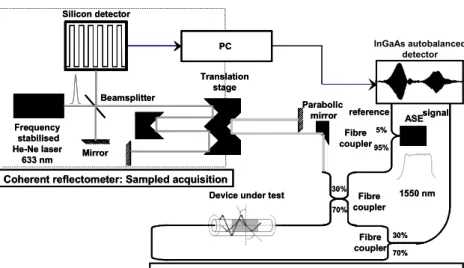
A diagram of the low coherence interferometric system developed at LNE is shown in Fig. 5. An Er3+ amplified spontaneous emission (ASE) source (central wavelength 1566 nm, spectral spread 80 nm, power 25 mW) provides the input signal. This signal is sent to a 30-70 % fiber coupler , via a 5-95 % fiber coupler , then directed into the reference and test arms of the interferometer. The light coming from the reference arm is combined with the light from the test arm, transmitted through the DUT at the fiber coupler, and recombined light is directed onto an autobalanced InGaAs detector. The two entrances of this detector have similar excess noise characteristics thanks to the 5-95 % fiber coupler . Therefore, using such detector reduces excess noise from the source and improves the signal-to-noise ratio (SNR). A frequency-stabilized HeNe laser interferometer monitors the position of the reference arm mirror, i.e. the imbalance of the PS-OLCI. This mirror consists of corner cube reflectors mounted on an air born translator allowing the scanning of a 120 cm maximum length.
The optical bandwidth of the BBS allowed to achieve a x = 12 µm spatial resolution (FWHM ~ He-Ne/4.n) in a silica fiber and this scheme allowed to achieve a - 80 dB dynamic range .
The signal on the photodetector carries spatial and spectral transmittances of the DUT. However, the interferograms have to be processed to get information in the spectral domain. Indeed, the interferograms correspond to the real part of the inverse Fourier transform of the product of the source spectrum S() by the amplitude transmittance T~() of the device under test, i.e.:
S T j d I( ) Re ( ) ~( )exp( 2 ) (1)where is the wave number i.e. the inverse of the wavelength in vacuum, j the complex number and the optical path difference between the PS-OLCI’s two arms.
In addition, LNE’s set-up enables to get the optical phase spectrum of the DUT [21] but in these studies, we will only focus on the envelope of the interferograms in the spatial domain and on the amplitude spectrum in the spatial domain. To get this envelope, we first truncate the interferogram at the
points where the SNR is approximately unity. Secondly, we append zeros to the interferogram array (zero padding) to obtain a total array length of 2n. Thirdly, we take the inverse Fourier transform of the
truncated and padded interferograms, thereby obtaining the transmission spectrum. Fourthly, using an appropriate window corresponding to the width of the source, we filter the amplitude transmittance to finally process a Fourier transform in order to get the envelope. From a chosen reference envelope, we proceed to a cropping of other acquisition envelopes through cross correlation.
Low-coherence interferometer: Interrogation of the sensor
ASE Translation stage Fibre coupler Fibre coupler Parabolic mirror PC
Coherent reflectometer: Sampled acquisition
Frequency stabilised He-Ne laser 633 nm Mirror Beamsplitter Silicon detector -50 -45 -40 -35 -30 -25 -20 1550 nm signal reference InGaAs autobalanced detector
Device under test 30%
70% 30% 70% 5% 95% Fibre coupler
Figure 5: LNE’s PS-OLCI set-up.
4. PS-OLCI measurements of TFBG
The set-up in Fig. 5 was used to measure the transmission of two different TFBG manufactured by the CEA LIST of 5 mm and 7 mm long, a 14° blaze angle and a 1535 nm working wavelength. First of all, the TFBG were characterized in order to analyse their signatures. The repeatability and reproducibility of PS-OLCI measurements have been estimated and conclusions were drawn concerning the parameters to consider in measurements. Then, we have performed refractometry measurements using different index liquid ranging from 1.37 to 1.40, and finally we have proceeded to liquid level sensing with a 1.41 liquid index.
4.1. PS-OLCI spatial and spectral signatures of a TFBG in the air
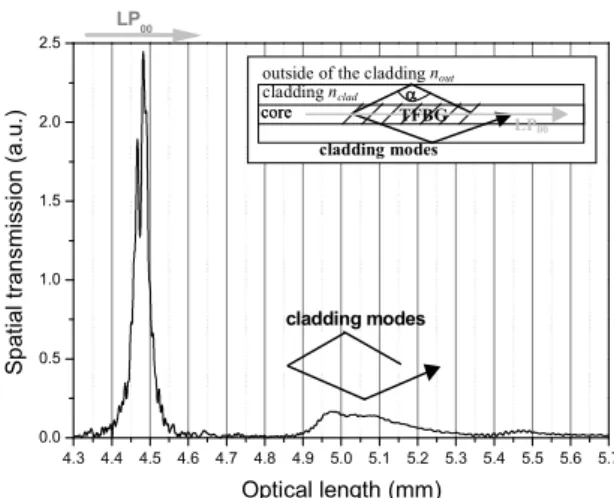
The PS-OLCI signal from the detector of a TFBG as a function of the optical path difference consists of two distinct signatures (Fig. 6). The first one in space (first interferogram) represents the interference of the direct transmitted light through the TFBG, corresponding to the fundamental mode LP00, with the
light reflected from the reference arm mirror. The other signature (second interferogram) results from the interference of light corresponding to the cladding mode reflected on the cladding surface, then in the grating and again on the cladding surface coupled with the LP00 mode as shown in Fig. 6, with the light
from the reference arm. The refractive index of the outer of the fiber upper cladding determines the shape and extent of the second signature as will be demonstrated later. Thus, only the second interferogram will be considered and studied in the next part.
4.3 4.4 4.5 4.6 4.7 4.8 4.9 5.0 5.1 5.2 5.3 5.4 5.5 5.6 5.7 0.0 0.5 1.0 1.5 2.0 2.5 core
outside of the cladding nout
cladding nclad TFBG LP00 core cladding modes cladding modes LP00 S p a ti a l tr a n s m is s io n ( a .u .) Optical length (mm)
Figure 6: PS-OLCI spatial signatures of a TFBG: the first envelope corresponds to the transmission of the LP00 mode and the
second one to the transmission of a cladding mode coupled with the LP00 mode as a function of the optical length. Performing inverse Fourier transform on the second interferogram provides the amplitude spectrum response of the TFBG (Fig. 7). This response presents resonance peaks.
1520 1525 1530 1535 1540 1545 1550 1555 1560 1565 1570 1575 0.00 0.05 0.10 0.15 0.20 0.25 0.30 0.35 0.40 0.45 0.50 S p e c tr a l tr a n s m is s io n ( a .u .) Wavelength (mm)
Figure 7: PS-OLCI spectral signature of a TFBG: amplitude spectrum of the second interferogram corresponding to the transmission of a cladding mode coupled with the LP00 mode as a function of the wavelength.
4.2. Repeatability and reproducibility of both spatial and spectral analysis of TFBG in the air, based on PS-OLCI measurements
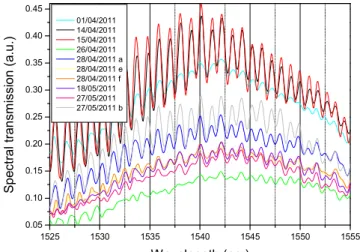
To evaluate the repeatability and reproducibility of TFBG and PS-OLCI measurements, we have proceeded to several PS-OLCI characterizations of TFBG day after day. The spectral and spatial responses of the TFBG were both analyzed.
The envelope of the second interferogram as a function of the optical length and the spectrum as a function of the wavelength are given respectively in Fig. 8 and 9. The repeatability and reproducibility of these results have been evaluated according to two criteria for both signatures: the area under the envelope and a position of a given peak in the spatial domain and the area under the spectrum and the wavelength of a resonant peak in the spectral domain. The associated uncertainties were calculated in accordance with the ISO 5725-2 standard [22] using the reproducibility variance. Regarding the area in both domains, the relative repeatability standard uncertainty is less than 0.4 % but the relative reproducibility standard uncertainty is greater than 38 %. These standard uncertainties are more satisfying regarding the optical length in the spatial domain (0.1 %) and the wavelength in the spectral domain (0.01 %). In our view, the effects that are influential among all these measurements are the following: the “day effect”, the “fiber-to-fiber connection/deconnection effect”, the “TFBG's curvature effect” as well as the “operator effect”. The predominant effects that influenced the measurement are the “connexion effect” and the “TFBG's curvature effect”, since we have noticed that when the TFBG is not disconnected and moved in between measurements, the uncertainties fall to reasonable values closed to repeatability uncertainty.
In conclusion, the more significant quantities are not the area but the optical length in the spatial domain and the wavelength in the spectral domain. Consequentlythese quantities will have to be
considered if possible. However, as we have noticed that the reproducibility is satisfying if the TFBG is not moved and disconnected between measurements, the area can be used as well. It will be the case when it comes to liquid level sensing.
3.6 3.7 3.8 3.9 4.0 4.1 4.2 4.3 4.4 4.5 4.6 4.7 4.8 4.9 5.0 0.01 0.02 0.03 0.04 0.05 S p a ti a l tr a n s m is s io n ( a .u .) Optical length (mm) 01/04/2011 14/04/2011 15/04/2011 26/04/2011 28/04/2011 a 28/04/2011 e 28/04/2011 f 18/05/2011 27/05/2011 a 27/05/2011 b
Figure 8: PS-OLCI spatial measurements of a TFBG: spatial transmission (envelope of the second interferogram) as a function of the optical length on different days.
1525 1530 1535 1540 1545 1550 1555 0.05 0.10 0.15 0.20 0.25 0.30 0.35 0.40 0.45 S p e c tr a l tr a n s m is s io n ( a .u .) Wavelength (nm) 01/04/2011 14/04/2011 15/04/2011 26/04/2011 28/04/2011 a 28/04/2011 e 28/04/2011 f 18/05/2011 27/05/2011 27/05/2011 b
Figure 9: PS-OLCI spectral measurements of a TFBG: spectral transmission as a function of the wavelength on different days.
5. Refractometry measurements
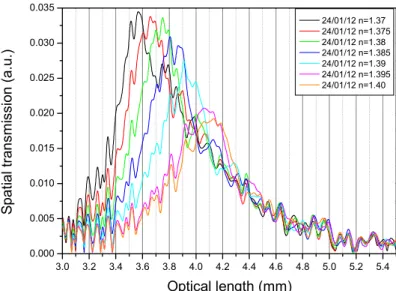
In order to demonstrate that the system is able to provide refractive indices measurements, a TFBG immersed in different index liquids was interrogated with PS-OLCI. Preliminary measurements were performed in order to choose the range of index liquids to measure. This range depends on the TFBG characteristics. If the index liquid is too high, the resonance peaks on the spectrum disappear and the interest of cladding mode cannot be exploited. Indeed, the leakage modes are preferred on cladding mode in that case. Finally, the range from 1.37 to 1.40 (step 0.005) was chosen. The TFBG was cleaned with alcohol between measurements with different index liquids. Results are shown in Fig. 10 and 11. In the spatial domain (Fig. 10), both width and amplitude of the second interferogram as a function of the optical length (corresponding to the cladding mode) decrease as the index increases. In addition, the maximum amplitude shifts on the right as the index increases. In the spectral domain (Fig. 11), we observe the same phenomena on the spectrum with a red shift of the maximum amplitude. Furthermore, as the spectrum decreases as a function of the refractive index, the number of resonance peaks decreases.
3.0 3.2 3.4 3.6 3.8 4.0 4.2 4.4 4.6 4.8 5.0 5.2 5.4 0.000 0.005 0.010 0.015 0.020 0.025 0.030 0.035 S p a ti a l tr a n s m is s io n ( a .u .) Optical length (mm) 24/01/12 n=1.37 24/01/12 n=1.375 24/01/12 n=1.38 24/01/12 n=1.385 24/01/12 n=1.39 24/01/12 n=1.395 24/01/12 n=1.40
Figure 10: PS-OLCI spatial measurement of a TFBG for different index liquids: spatial transmission (envelope of the second interfrogram) as a function of the optical length.
1525 1530 1535 1540 1545 1550 1555 1560 1565 1570 1575 0.00 0.05 0.10 0.15 0.20 0.25 0.30 S p e c tr a l tr a n s m is s io n ( a .u .) Wavelength (nm) 24/01/12 n=1.37 24/01/12 n=1.375 24/01/12 n=1.38 24/01/12 n=1.385 24/01/12 n=1.39 24/01/12 n=1.395 24/01/12 n=1.40
Figure 11: PS-OLCI spectral measurement of a TFBG for different index liquids: spectral transmission as a function of the wavelength.
The indices have been plotted as a function of the optical length and the wavelength at the maximum transmission, (respectively Figs. 13 and 14). Both curves have a linear behaviour in the range 1.37-1.40. We can observe that the more the difference (nclad - nout) decreases, the more the response of the TFBG is linked to low order cladding modes, associated with low diffraction angles with respect to the propagation axis of the fiber. A Forsythe method [23] has been used to estimate the linear fitting model and the associated uncertainty (Figs. 13 and 14). The results fit into the model especially from 1.37 to 1.39.
1.365 1.370 1.375 1.380 1.385 1.390 1.395 1.400 3.65 3.70 3.75 3.80 3.85 3.90 3.95 4.00 4.05 4.10
Optical length at m axim um of transm ission (m m )
R e fr a c ti v e i n d e x Index = 0.0504 x Lopt (mm)- 1.1866
Figure 12: PS-OLCI spatial measurement of a TFBG for different liquid indices: indices as a function of the optical length at the maximum transmission and associated linear fitting model (in light grey: uncertainty range for average on measurements,
1.370 1.375 1.380 1.385 1.390 1.395 1.400 1538 1539 1540 1541 1542 1543 1544 1545 1546 1547 1548 1549 1550
Wavelength at the m axim um of transm ission (nm )
R e fr a c ti v e i n d e x Index = 0.002317 x (nm) - 2.20
Figure 13: PS-OLCI spectral measurement of a TFBG for different liquid indices: indices as a function of the wavelength at the maximum transmission and associated linear fitting model (in light grey: uncertainty range for
average on measurements, in grey: uncertainty range for a single measurement, and in black: linear fit).
In conclusion, we have shown that the TFBG and PS-OLCI- association is a relevant way to evaluate the refractive index of a liquid with a relative standard uncertainty of 0.03 % in spatial and 0.04 % in spectral domains, in the range 1.37-1.40.
6. Liquid level sensing
Regarding liquid level sensing, an aluminium tank with a 250 µm-centred hole in its bottom was manufactured. The TFBG was vertically held in this tank, its end being glued at the hole. Then it was gradually immersed in the liquid index 1.41. This value was chosen, as there is no more coupling between core and cladding modes but only between core and radiation modes for this liquid index. This configuration facilitates the analysis of the spectral and spatial information. Between each drop of liquid, PS-OLCI measurements were performed. The experiments were carried out without moving or disconnecting the TFBG between each level of liquid.
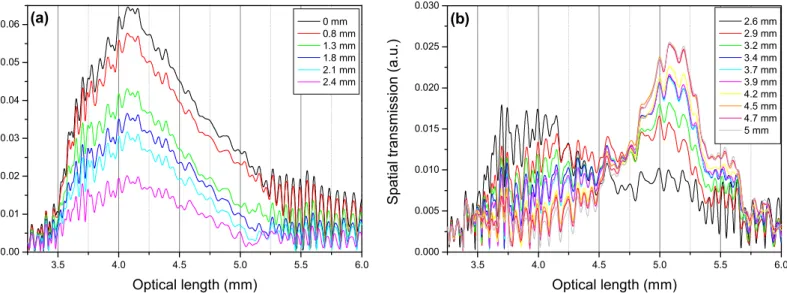
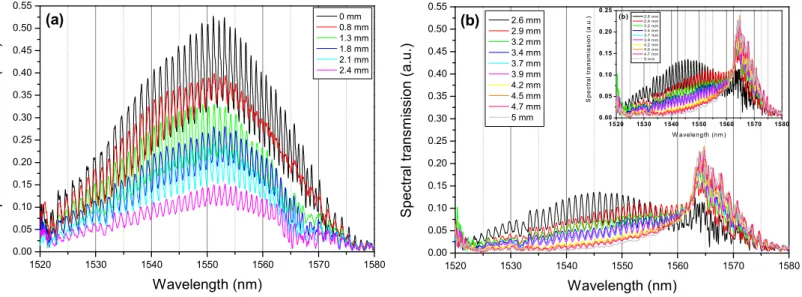
Spatial and spectral measurements in such conditions, for different levels of liquid, are presented on Fig. 14 and 15. The envelope amplitude of the second interferogram decreases as the level of liquid increases (Fig. 14 (a)). There is no progressive shift of the interferogram on the right as observed previously in refractometry measurements but we can notice a sudden shift when the level of liquid reaches half (2.5 mm) of the TFBG (Fig. 14 (b)). We observed a similar tendency in the spectral domain (Fig. 15 (a) and (b)). Consequently, the spatial and spectral positions criterion of the maximum transmission can no longer be used and we have to consider the area under the envelope of the interferogram and under the spectrum.
3.5 4.0 4.5 5.0 5.5 6.0 0.00 0.01 0.02 0.03 0.04 0.05 0.06 (a) S p a ti a l tr a n s m is s io n ( a .u .) Optical length (mm) 0 mm 0.8 mm 1.3 mm 1.8 mm 2.1 mm 2.4 mm 3.5 4.0 4.5 5.0 5.5 6.0 0.000 0.005 0.010 0.015 0.020 0.025 0.030 (b) S p a ti a l tr a n s m is s io n ( a .u .) Optical length (mm) 2.6 mm 2.9 mm 3.2 mm 3.4 mm 3.7 mm 3.9 mm 4.2 mm 4.5 mm 4.7 mm 5 mm
Figure 14: PS-OLCI spatial measurement of a TFBG for different level of index liquid 1.41: spatial transmission (envelope of the second interfrogram) as a function of the optical length for immersion of (a) the first half of the TFBG, (b) the second half
1520 1530 1540 1550 1560 1570 1580 0.00 0.05 0.10 0.15 0.20 0.25 0.30 0.35 0.40 0.45 0.50 0.55 (a) S p e c tr a l tr a n s m is s io n ( a .u .) Wavelength (nm) 0 mm 0.8 mm 1.3 mm 1.8 mm 2.1 mm 2.4 mm 1520 1530 1540 1550 1560 1570 1580 0.00 0.05 0.10 0.15 0.20 0.25 0.30 0.35 0.40 0.45 0.50 0.55 1520 1530 1540 1550 1560 1570 1580 0.00 0.05 0.10 0.15 0.20 0.25 (b) S p e c tr a l tr a n s m is s io n ( a .u .) W avelength (nm ) 2 .6 m m 2 .9 m m 3 .2 m m 3 .4 m m 3 .7 m m 3 .9 m m 4 .2 m m 4 .5 m m 4 .7 m m 5 m m (b) S p e c tr a l tr a n s m is s io n ( a .u .) Wavelength (nm) 2.6 mm 2.9 mm 3.2 mm 3.4 mm 3.7 mm 3.9 mm 4.2 mm 4.5 mm 4.7 mm 5 mm
Figure 15: PS-OLCI spectral measurement of a TFBG for different level of index liquid 1.41: spectral transmission as a function of the optical length for immersion of (a) the first half of the TFBG, (b) the second half of the TFBG.
In order to explain this shift at half height, we have calculated the angle ( ) resulting from the cladding mode reflection at the interface between the cladding (refractive index nclad = 1.48) and the outer (refractive index nout = 1.41 for index liquid and nout = 1 for air) (Insert of Fig. 6 and Table 1):
nout nclad
arcsin (2) nout/nclad (°) liquid: nout = 1.41 0.95 72 air: nout = 1 0.68 43Table 1:Angle ( ) resulting from the cladding mode reflection at the interface between the cladding (refractive index nclad = 1.48) and the outer (refractive index nout).
When the TFBG is not immersed, radiative modes forming a 43° angle,relative to the perpendicular to the optical cladding (table 1) are preferred (Fig. 16). As the liquid level gradually covers the FBG, it is the radiative modes forming a 72° angle relative to the perpendicular to the optical cladding (Table 1) which are preferred (Fig. 16). As 72° is a larger angle, the associated modes interfere with a spatial delay (resulting in a spatial shift) compared to the modes associated to 43°. This would explain why the interferogram shifts to longer wavelengths.
a) b) c)
Figure 16: Schematic representation of the angle resulting from the cladding mode reflections in a TFBG as it is gradually immersed in a liquid: a) no immersion, b) 1 / 3 immersed, c) 1 / 2 immersed.
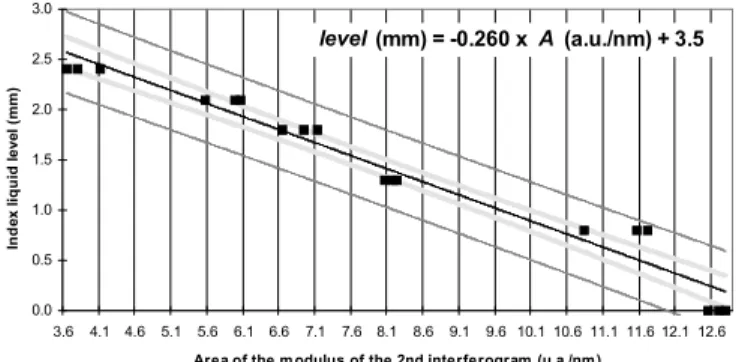
The index liquid level up to half of the TFBG as a function of the areas in the spatial and spectral domains has been plotted (Figs. 18 and 19). The mean tendency of these curves is linear.However all the points do not fit into the Forsythe model. The relative standard uncertainties extend from 3 % to 50 %. We believe that the determination of the liquid level is liable for this. Indeed, the height of the liquid level
has been estimated from the TFBG length, the volume of an index liquid drop and from the shape of the PS-OLCI signature. Indeed, the shape of PS-OLCI signature enables to determine if the TFBG is in contact or not with the liquid at the beginning of the grating and is completely covered at its end. In a similar way, we have estimated the spatial resolution of the technique to be around 0.3 mm. These determinations are not rigorous, thus the associated uncertainty is high, as the volume of a drop is not constant from one drop to the next. They will have to be improved to decrease the uncertainty on measurement.
Nevertheless, the results show a clear tendency and the system TFBG and PS-OLCI- is a very promising tool to measure liquid levels.
0.0 0.2 0.4 0.6 0.8 1.0 1.2 1.4 1.6 1.8 2.0 2.2 2.4 0.033 0.043 0.053 0.063 0.073 0.083 0.093 0.103 0.113
Area of the enveloppe of the 2nd interferogram (u.a./m m )
I n d e x l iq u id l e v e l (m m ) level (mm) = -30.1 x A (a.u./mm) + 3.55
Figure 17: PS-OLCI spatial measurement of a TFBG gradually immersed in liquid: liquid level as a function of the area under the second interfergram (in light grey: uncertainty range for average on measurements, in grey: uncertainty range for a single
measurement, and in black: linear fit).
0.0 0.5 1.0 1.5 2.0 2.5 3.0 3.6 4.1 4.6 5.1 5.6 6.1 6.6 7.1 7.6 8.1 8.6 9.1 9.6 10.1 10.6 11.1 11.6 12.1 12.6
Area of the m odulus of the 2nd interferogram (u.a./nm )
In d e x l iq u id l e v e l (m m ) level (mm) = -0.260 x A (a.u./nm) + 3.5
Figure 18: PS-OLCI spectral measurement of a TFBG gradually immersed in liquid: liquid level as a function of the area under the inverse Fourier transform of the second interfergram (in light grey: uncertainty range for average on measurements,
in grey: uncertainty range for a single measurement, and in black: linear fit).
7. Conclusion and perspectives
We have proposed, for the first time, Tilted Fiber Bragg Grating (TFBG) and phase sensitive Optical Low Coherence Interferometry technique (PS-OLCI) for both refractometry and liquid level sensing. We have clearly shown that the technique is very interesting for refractometry applications as the relative uncertainty on measurement is lower than 0.04 % in the range 1.37-1.40. Concerning liquid level measurements, the calibration of the TFBG has to be consolidated.Nevertheless, results show a clear tendency, thus promising interesting results. These preliminarily experiments have been conducted to validate the PS-OLCI measurement on TFBG in order to detect any change of refractive index in liquids. A second step will consist in functionalising the surface of the TFBG to increase its sensitivity and selectivity to a particular molecule. Our ultimate goal is to combine these sensors with this technique to develop performance of bio-chemical sensors for medical and environmental applications.
Acknowledgment
The authors are grateful to Laura Eudeline and Caroline Ville, LNE translators, for their proofreading work, and wish to thank the French Metrology for its support.
References
[2] K. O. Hill, Y. Fujii, D-C. Johnson, B-S. Kawasaki, Photosensitivity in optical fiber waveguides: Application to reflection filter fabrication, Appl. Phys. Lett. 32 (1978) 647-649.
[3] B. S. Kawasaki, K-O Hill, D. C. Johnson, Y. Fujii, Narrow-band bragg reflectors in optical fibers, Opt. Lett. 3 (1978) 66-68.
[4] J. M. Lopez-Higuera, Optical Sensors, ed. Universidad de
Cantabria Press, Santander, Spain, 1998.
[5] A. D. Kersey, M. A. Davis, H. J. Patrick, M. LeBlanc, K. P. Koo, C. G. Askins, M. A. Putnam, J. E. Friebele, Fiber grating sensors, J. Lightwave Technol. 15 (1997) 1442-1462.
[6] Y.-J. Rao, In-fibre bragg grating sensors, Meas. Sci. Technol. 8 (1997) 355-375.
[7] K. T. V. Grattan, B. T. Meggitt, Optical Fiber Sensor Technology, Kluwer Academic Publishers, Boston, 2000.
[8] T. Erdogan, J. E. Sipe, Tilted fiber phase gratings, J. Opt. Soc. Am. A 13 (1996) 296-313.
[9] G. Laffont, P. Ferdinand, Tilted short-period fibre-Bragg-grating-induced coupling to cladding modes for accurate refractometry, Measurement Science and Technology. 12 (2001) 765-770.[10] H. Phan, C. Minh, G. Laffont, V. Dewynter, P. Ferdinand, L. Labonté, D. Pagnoux, P. Roy, W. Blanc, B. Dussardier, Tilted Fiber Bragg Grating photowritten in microstructured optical fiber for improved refractive index measurement, Opt. Express 14 (2006) 10359-10370.
[11] S. Khaliq, S. W. James, R. P. Tatam, Fiber-optic liquid-level sensor using a long-period grating, Opt. Lett. 26 (2001) 1224-1226.
[12] P. Nath, P. Datta, K. C. Sarma, All fiber-optic sensor for liquid level measurement, Microw. Opt. Technol. Lett. 50 (2008) 1982-1984.
[13] H. J. Sheng, W. F. Liu, K. R. Lin, S. S. Bor, M. Y. Fu, High-sensitivity temperature-independent differential pressure sensor using fiber Bragg gratings, Opt. Express 16 (2008) 16013-16018.
[14] C-W. Lai, Y-L. Lo, J-P. Yur, C-H. Chuang, Application of fiber Bragg grating level sensor and Fabry-Perot pressure sensor to simultaneous measurement of liquid level and specific gravity, IEEE Sens. J. 12 (2012) 827-831.
[15] R. Gabet, P. Hamel, Y. Jaouën, A.-F. Obaton, G. Debarge, Versatile Specialty Fibre Characterization Using Phase-Sensitive OLCR Technique, J. Ligthwave technol. 27 (2009) 3021-3033.
[16] P. Ferdinand, Capteurs à fibres optiques à réseaux de Bragg, Techniques de l’Ingénieur R 6735 (1999) 1-24, in French.
[17] G. Laffont, P. Ferdinand, “Refractometer with blazed bragg gratings”, US7184135, 2 oct. 2001. [18] C. Caucheteur, Y. Schevchenko, L.-Y. Shao, M. Wuilpart, J. Albert, High resolution interrogation of tilted fiber grating SPR sensors from polarization properties measurement, Opt. Express 19 (2011) 1656-1664.
[19] J. Albert, L.-Y. Shao, C. Caucheteur, Tilted fiber Bragg gratings sensors, Laser & Photonics Rev. (2012) DOI: 10.1002/lpor.201100039.
[20] S. Maguis, G. Laffont, P. Ferdinand, B. Carbonnier, K. Kham, T. Mekhalif, M-C. Millot, Biofunctionalized tilted Fiber Bragg Gratings for label-free immunosensing, Opt. Express 16 (2010) 19049-19062.
[21] A-F. Obaton, A. Quoix, J. Dubard, Uncertainties on distance and chromatic dispersion measurement using Optical Low Coherence Reflectometry, Metrologia 45 (2008) 83-92.
[22] ISO 5725-2: 1994 Accuracy (trueness and precision) of measurement methods and results - Part 2: Basic method for the determination of repeatability and reproducibility of a standard measurement method Geneva.
[23] G.E. Forsythe, Generation and Use of Orthogonal Polynomials for Data-Fitting with a Digital Computer, J. Soc. Ind. Appl. Math. 5 (1957) 74-88.
Vitae
Anne-Françoise Obaton received the Ph.D. in Physics from University of La Rochelle, France, in 1998
for her research work on New Yb3+-Er3+ codoped phosphate glasses for eye-safe laser applications. In 1999, she had a post doctoral position in the Institute of Industrial Science, Laboratory for Integrated Micro-Mechatronic Systems in Tokyo University, Japan, working on AFM. In 2008, she received her habilitation to supervise research from University Pierre et Marie Curie, Paris, France. Since 2000 she has
been involved in metrology at the Laboratoire national de métrologie et d'essais (LNE) in Paris, France. Her research interest involves Optical Low Coherence Reflectometry in the guided optic domain.
Guillaume Laffont is an engineer from the Ecole Nationale Supérieure de Physique de Strasbourg –
ENSPS. He completed a Ph D in physics and optics in 2001 at the Université de Lille, France for research on the photo-writing, modelling and sensing application of Tilted FBGs. His current research at CEA LIST includes the development of FBG-based sensors and systems. He is involved in the development of tuneable sources, of innovative FBG components and in the design of photosensitive photonic crystal fiber. He also works on the use of bio-functionalized FBG-based transducers for biochemical applications. He is author or co-author of 30 publications/communications. He also holds 6 patents.
Chujun Wang received the B.E. degree in Optoelectronic Information Engineering from Huazhong
University of Science and Technology, Wuhan, China, in 2010. She will get the Engineer degree in Optoelectronic at the end of September 2012, from Polytech’Paris Sud, the engineering department of Université Paris Sud XI, Orsay, France. At the same time, she will also obtain the M.Sc. degree in Physics from Institut d’Optique Graduate School, Palaiseau, France, for her double diploma education. Her research interest focused on dye laser and optical fibers, especially for bio-chemical applications. Now she is doing her 6-month master thesis in transparent conductive oxide for solar cells.
Alexandre Allard is a statistician engineer from the Institute of Statistics of the University of Paris
(ISUP). He has been involved at the Laboratoire national de métrologie et d’essais (LNE) since 2007. His research covers the field of mathematical and statistical tools in metrology and particularly for the evaluation of measurement uncertainty, including Monte Carlo methods and sensitivity analysis. He has also been involved in the French Association for Standardization (AFNOR) as the leader of a working groupfor the evaluation of measurement uncertainty using Monte Carlo simulations.
Pierre Ferdinand is Director of Research at CEA LIST, France. His research includes Fiber Bragg
Grating and Distributed sensing (Brillouin, Raman, Rayleigh) for advanced Structure Health Monitoring (SHM). He received an MS degree in physics in 1978 from the Université Pierre et Marie Curie, Paris, the Diplôme d'Etudes Approfondies in plasma physics in 1980 and its PhD in physics from the University of Paris XI, Orsay, in 1982. In 1990 he received its State PhD (Doctorat d'Etat es Sciences) from the University of Nice. Ferdinand holds 30 patents, is the author of one scientific book and several book chapters, and approximately 180 publications/communications. He is member of several technical committees: e.g. the International and European OFS Conferences as well as the European Workshop on SHM.
![Figure 1: Scheme from P. Ferdinand [16] of irradiation of a fiber by ultraviolet light for FBG photowriting](https://thumb-eu.123doks.com/thumbv2/123doknet/13153494.389372/3.892.270.651.132.342/figure-scheme-ferdinand-irradiation-fiber-ultraviolet-light-photowriting.webp)