HAL Id: cea-00278013
https://hal-cea.archives-ouvertes.fr/cea-00278013
Submitted on 7 May 2008HAL is a multi-disciplinary open access
archive for the deposit and dissemination of sci-entific research documents, whether they are
pub-L’archive ouverte pluridisciplinaire HAL, est destinée au dépôt et à la diffusion de documents scientifiques de niveau recherche, publiés ou non,
Sorption of Aldrich Humic Acids onto Hematite:
Insights into Fractionation Phenomena by Electrospray
Ionization with Quadrupole Time-of-Flight Mass
Spectrometry
Pascal E. Reiller, Badia Amekraz, Christophe Moulin
To cite this version:
Pascal E. Reiller, Badia Amekraz, Christophe Moulin. Sorption of Aldrich Humic Acids onto Hematite: Insights into Fractionation Phenomena by Electrospray Ionization with Quadrupole Time-of-Flight Mass Spectrometry. Environmental Science and Technology, American Chemical Society, 2006, 40 (7), pp.2235-2241. �10.1021/es0520518�. �cea-00278013�
Sorption of Aldrich humic acids onto hematite:
Insights into fractionation phenomena by
ElectroSpray Ionization with Quadrupole
Time-Of-Flight Mass Spectrometry
Supplementary Information
PASCAL REILLER*, BADIA AMEKRAZ* and CHRISTOPHE MOULIN
CEA, CE Saclay, Nuclear Energy Division, DANS/DPC/SECR, Laboratoire de Spéciation des Radionucléides et des Molécules, Bâtiment 391, BP 11, F-91191 Gif sur Yvette Cedex,
France. pascal.reiller@cea.fr;badia.amekraz@cea.fr
Environmental Science and Technology, Tuesday, 07 February 2006. This section contains 6 pages, 1 table and 5 figures.
The following supplement gives complementary information about the experimental conditions used throughout the study, the values of absorbance at 203 and 253 nm and
evolution of the ratio A253/A203, the absorbance spectra obtained for the initial PAHA sample
and of supernatants from sorption experiments. Complementary ESI mass spectra are also given:
• verification of the influence of concentration on ESI mass spectra for a given sample;
• intermediate mass spectra of the supernatants that were not essential to the discussion;
• the evolution of number-averaged (I–n) and weight-averaged (I
–
w) mean molecular
intensities.
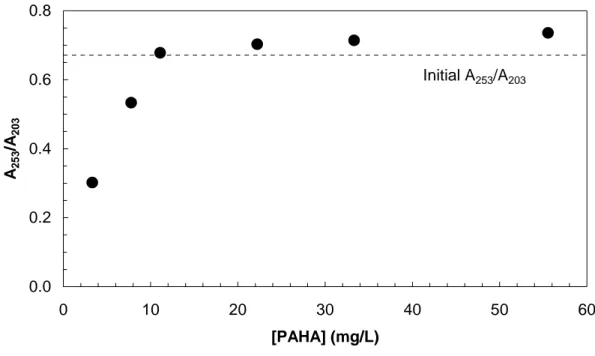
Table S1: initial PAHA concentration and pH of the sorption experiments and absorbance
values of the initial sample and supernatant: [α-Fe2O3] = 500 mg/L.
[PAHA]° (mg/L) pH A253 A203 A253/A203 Initial sample 11 7.14 0.4263 0.6350 0.67 Supernatant 3.3 7.19 0.0153 0.0507 0.30 7.7 7.03 0.1194 0.2238 0.53 11 7.10 0.2134 0.3148 0.68 22 7.02 0.6161 0.8767 0.70 33 7.00 1.0619 1.4872 0.71
0.0 0.2 0.4 0.6 0.8 0 10 20 30 40 50 60 [PAHA] (mg/L) A25 3 /A 203 Initial A253/A203
Figure S1: Variation of A253/A203 ratios of supernatant samples (from Table S1) after PAHA
retention by 500 mg/L hematite at pH ≈ 7. 0.0 0.5 1.0 1.5 2.0 2.5 3.0 3.5 200 250 300 350 400 450 500 550 600 Wavelength (nm) Ab sorbance of su pernat ant 0.0 0.2 0.4 0.6 0.8 1.0 1.2 Absorbanc e of [ P AHA] ° = 11 m g /L supernatant of [PAHA]° = 3.3 mg/L supernatant of [PAHA]° = 7.7 mg/L supernatant of [PAHA]° = 11 mg/L supernatant of [PAHA]° = 22 mg/L supernatant of [PAHA]° = 33 mg/L supernatant of [PAHA]° = 55 mg/L initial [PAHA]° = 11 mg/L, no hematite
Figure S2: Absorbance spectra of initial PAHA and of supernatant from sorption experiment onto 500 mg/L hematite at pH ≈ 7 (see table S1).
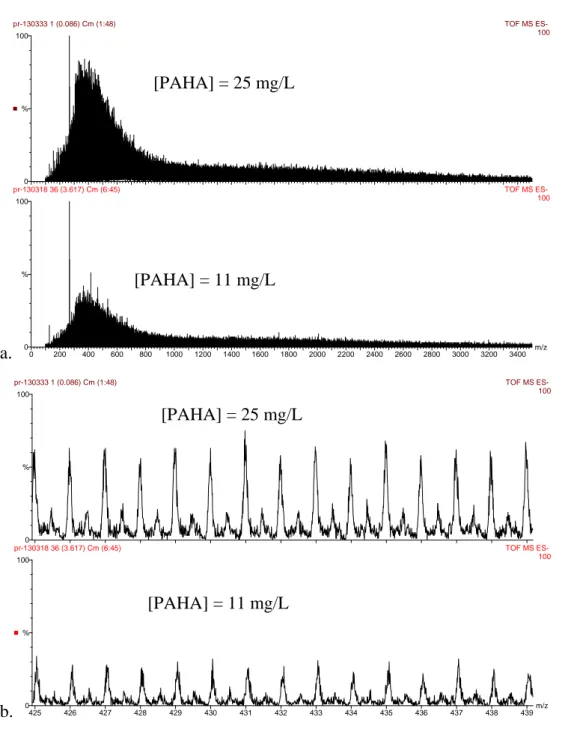
ESI QToF mass spectra of PAHA at 25 mg/L and 11 mg/L have been compared on Figure S3. No difference in the shape of the mass spectra can be evidenced under our conditions and for this particular humic extract.
a. 0 200 400 600 800 1000 1200 1400 1600 1800 2000 2200 2400 2600 2800 3000 3200 3400 m/z 0 100 % 0 100 % pr-130333 1 (0.086) Cm (1:48) TOF MS ES- 100 pr-130318 36 (3.617) Cm (6:45) TOF MS ES- 100 b. 0425 426 427 428 429 430 431 432 433 434 435 436 437 438 439m/z 100 % 0 100 % pr-130333 1 (0.086) Cm (1:48) TOF MS ES- 100 pr-130318 36 (3.617) Cm (6:45) TOF MS ES- 100
Figure S3: Comparison between ESI Q-ToF negative ion mass spectra of PAHA obtained at two different concentration at cone 55V, a. [PAHA] = 25 ppm and [PAHA] = 11 ppm in the range 100-3500 Da; b. detail in the range 425-439 Da.
[PAHA] = 25 mg/L
[PAHA] = 11 mg/L
[PAHA] = 25 mg/L
a
b
c
d
Figure S4: ESI Q-ToF negative ion mass spectra of PAHA (a) before sorption: 11 mg/L at pH
≈ 7; (b-d) after sorption at pH ≈ 7, [α-Fe2O3] = 500 mg/L, under varying initial [PAHA] : (a)
700 800 900 1000 1100 1200 1300 1400 1500 1600 1700 1 10 100 [PAHA]° (mg/L) Mean m /z (Da)
Initial I
nInitial I
wFigure S5: Influence of PAHA sorption onto hematite on the mean molecular intensity calculated from supernatants ESI mass spectra compared to the initial solution at pH ≈ 7: m/z
interval between 100 and 2535 Da; black diamonds I–n, white circles I
–
w; Horizontal dotted and
dashed lines are the values of the initial PAHA at pH ≈ 7 sample before retention for I–w and
I –
![Table S1: initial PAHA concentration and pH of the sorption experiments and absorbance values of the initial sample and supernatant: [α-Fe 2 O 3 ] = 500 mg/L](https://thumb-eu.123doks.com/thumbv2/123doknet/13123826.387654/3.892.244.650.736.1120/table-initial-concentration-sorption-experiments-absorbance-initial-supernatant.webp)