HAL Id: halshs-00586792
https://halshs.archives-ouvertes.fr/halshs-00586792
Preprint submitted on 18 Apr 2011
HAL is a multi-disciplinary open access archive for the deposit and dissemination of sci-entific research documents, whether they are pub-lished or not. The documents may come from teaching and research institutions in France or abroad, or from public or private research centers.
L’archive ouverte pluridisciplinaire HAL, est destinée au dépôt et à la diffusion de documents scientifiques de niveau recherche, publiés ou non, émanant des établissements d’enseignement et de recherche français ou étrangers, des laboratoires publics ou privés.
Keynesian hospitals? Public employment and political
pressure
Andrew E. Clark, Carine Milcent
To cite this version:
Andrew E. Clark, Carine Milcent. Keynesian hospitals? Public employment and political pressure. 2008. �halshs-00586792�
WORKING PAPER N° 2008 - 18
Keynesian hospitals? Public employment and political pressure
Andrew E. Clark Carine Milcent
JEL Codes: D21, D72, I18, J21
Keywords: hospitals, public employment, overmanning, political preferences
P
ARIS-
JOURDANS
CIENCESE
CONOMIQUESL
ABORATOIRE D’E
CONOMIEA
PPLIQUÉE-
INRA48,BD JOURDAN –E.N.S.–75014PARIS TÉL. :33(0)143136300 – FAX :33(0)143136310
Keynesian Hospitals? Public Employment and Political Pressure
A
NDREWE.
C
LARK ANDC
ARINEM
ILCENT*
Paris School of Economics and IZA; Paris School of Economics
April 2008
Abstract
This paper uses an unusual administrative dataset covering the universe of French hospitals to consider hospital employment: this is consistently higher in public hospitals than in Not-For-Profit or private hospitals, even controlling for many measures of hospital output (such as the type of operations and care provided, and the bed capacity rate). Public-hospital employment is positively correlated with the local unemployment rate, whereas no relationship is found in non-Public hospitals. This is consistent with public hospitals providing employment in depressed areas. We appeal to the Political Science literature and calculate local political allegiance, using expert evaluations on various parties’ political positions and local election results. The relationship between public hospital employment and local unemployment is stronger the more left-wing the local municipality. This latter result holds especially when electoral races are tight, consistent with a concern for re-election.
JEL Classification Codes: D21, D72, I18, J21.
Keywords: Hospitals, Public Employment, Overmanning, Political Preferences.
* Corresponding Author: Andrew Clark, PSE, 48 Boulevard Jourdan, 75014 Paris, France. Tel: +33-1-43-13-63-29; E-mail: Andrew.Clark@ens.fr. We are grateful to Petri Bockerman, Kristiaan Kerstens, Florian Mayneris, Michael McDonald, Philippe Méhaut, Meinhard Moschner, Andrew Oswald, Nicolas Sauger, Andrei Shleifer, Alois Stutzer and Paul Warwick for help and suggestions.
Keynesian Hospitals? Public Employment and Political Pressure
Andrew E. Clark and Carine Milcent
1. Introduction
The extent to which the State should be present in market economies is an old and widely-debated question. While the theoretical grounds for State intervention, typically expressed in terms of market failure or redistribution, are well-known, empirical evidence on outcomes in the public and private sectors has arguably been slightly harder to come by. One area of concern has been the relative efficiency of production across the sectors, while another has introduced a potential role for equity (rather than efficiency) considerations.
The research we present here combines these two concerns. Using an administrative dataset covering all French hospitals in 1999, we find that the number of staff employed in Public Sector hospitals is greater than the number of staff employed in Private sector hospitals, for a given level of “health output” (as measured by the number and type of operations carried out, the care provided, and the bed capacity rate). This might be thought of as prima facie evidence of Public Sector overmanning or inefficiency, although it can always be countered that we are not measuring all of the relevant outputs, and the level of some kind of omitted output (perhaps something like “quality of care”) is higher in the Public Sector than in the Private Sector. Higher levels of public sector employment are more prevalent for Nurses and (relatively unskilled) support staff positions. There is no significant difference in the employment of Doctors between the public and private sectors.
We add further detail to this result by showing that the greater employment in public sector hospitals is not equally spread the country. In particular, higher employment in public sector hospitals is more pronounced in regions with weaker labour markets, as reflected in the local unemployment rate. This second finding is therefore not consistent with a generalised productivity differential in favour of the private sector. One reading of this correlation is that hospitals play a role on the labour market by providing employment for those who would otherwise likely struggle in economically-depressed areas.
Further evidence of this “Keynesian” role for hospitals comes from the analysis of local politics (reflected in the votes cast at local elections which were held close to the year of our data, 1999). The higher employment of less-skilled workers in Public Sector hospitals is more prevalent in communities that voted left-wing. This employment effect disappears in communities that voted right-wing. In these latter we do find some evidence of greater employment in Public Sector hospitals, but now with
respect to skilled workers (Doctors), rather than less-skilled workers. In an attempt to distinguish between market failure and other interpretations of public-hospital employment, we appeal to the tightness of the most recent local elections. The greater left-wing employment response to unemployment only occurs in tighter electoral races, consistent with re-election concerns.
The paper is organised as follows. Section 2 briefly discusses research on employment and efficiency in the public and private sectors. Section 3 describes the French healthcare sector and presents our administrative data on hospitals. Section 4 presents the basic regression results linking employment and hospital type, and Section 5 underlines the role of the local labour market and political context in moderating this relationship. Section 6 concludes.
2. Public Sector Overmanning?
In this section we do not aim to provide a complete overview of how the public sector works, or even of the public sector labour market (see the excellent survey by Gregory and Borland in the Handbook of Labor Economics). We will restrict ourselves here to one broad question: that of the level of public sector employment, and, more specifically, the vexed issue of whether the public sector hires “too many” workers, given the output that it produces.
The efficiency (or not) of the public sector is a perennial subject of public debate, with positions often being broadly marked along political lines; this topic has also been prevalent in the thinking behind much of the privatisation debate. The public interest has been mirrored in a variety of theoretical and empirical contributions in Economics.
A number of papers have suggested reasons for which public- and private-sector performance may differ. In particular, public production might be less efficient than private production for incentive reasons (Laffont and Tirole, 1993); see also Leibenstein (1969) on the issue of incentives, who does however underline the problem of measuring the quality of public-sector output. Haskel and Sanchis (1995) suggest that the public sector might be inefficient in a production sense because firms there internalise the costs of workers’ effort. Shleifer and Vishny (2002) provide a useful overview of various ways in which government intervention may be viewed. They distinguish between the “Helping Hand”, where government intervention serves to overcome market failure and raise social welfare, and the “Grabbing Hand”, where government agents act at least partly in their own self-interest.1 Boycko et al. (1996) explicitly consider efficiency and employment in the public and private
1
Recalling the distinction between knights and knaves made by Le Grand (2007): “…knightly doctors, teachers or social workers would be ones who put the needs and wants of their patients, pupils or clients above their own; whereas knavish professionals are those who prioritize their own immediate interests above those of the people they were supposed to serve” (p18).
sector, suggesting privatisation as a way of rendering explicit any subsidies that are provided to public-sector enterprises (and thus discouraging those that are inefficient).
In the context of health care, Gray (2000), discusses research on the quality of medical care in different types of institutions, and notes that the incentives in private health care will not necessarily yield productive efficiency: “cost-containment is hopeless in a fee-for-service system” (p.220). The existence of public-sector hospitals might therefore be interpreted as a “helping hand” alternative to the incentive problems that arise in private hospitals, at least those with this kind of payment system.
In practice, empirical evidence on whether public-sector production is less efficient (or whether there is public-sector overmanning) has been fairly difficult to come by. The principal difficulty seems to have been that of measuring output, and this would seem to particularly be the case in the areas where the public sector is prevalent, such as health and education. In addition, when individuals are heterogeneous, the comparison of outcomes may produce a biased measure of the value-added by the enterprise. In the context of health, private hospitals may be able to cherry-pick patients who are (unobservably to the econometrician) in better initial health, or who present a lower risk of complications. The health outcome measure for private hospitals, be it mortality, morbidity or some other measure of health quality, will then reflect both the value-added from the hospital and the initial selection of patients. Public-sector enterprises typically select less, by the very nature of their mission, rendering efficiency comparisons particularly problematic.
A further issue is what exactly should be compared. Again in the context of health, is hospital output entirely captured by patients’ health outcomes, or are there also other social outcomes? In this vein, Sloan et al. (2000), in their analysis of hospital conversions in the USA, note that “the net value to the community includes a range of social benefits, some of which are intangible” (p.16). This extension of hospital output to a wider, perhaps more heterogeneous, set of outcomes can be thought of as a representation of the “helping hand” role of government intervention, whereby hospitals play role in alleviating some social ills that could be attributed to market failures.
A number of authors have tried to circumvent some of these problems. A well-known paper by Hoxby (2000) compares the productivity of public and private schools, and finds that competition resulting from the presence of private schools leads to an improvement in test scores in public schools, even though spending per pupil in the latter remains unchanged. One interpretation is that there is X-inefficiency in public schools. Hoxby’s results have, however, been challenged by Rothstein (2007), who claims that the results are not robust to including private school students in the sample, or to the way in which the exogenous formation of school district boundaries (via the presence of streams) are defined.
An alternative approach to the question is to move from cross-sectional to panel analysis, and consider transitions between sectors. One such transition is privatization. Melly and Puhani (2006) use data from two public-sector enterprises, one of which was privatized during the period considered. Their difference-in-difference results show that privatization increases wages across a broad range of skill groups, which is consistent with rising productivity (but also consistent with compensating differentials).
Brown et al. (2006) also consider privatization, here that of manufacturing firms in four ex-communist countries. Their basic OLS results suggest that privatization raised productivity in all four countries. Even in more demanding specifications with firm fixed effects and firm-specific time trends privatization is estimated to raise productivity in two out of the four countries.2
In the specific context of the health sector, one part of the large literature on productive efficiency has used DEA analysis to evaluate how close hospitals are to the production possibility frontier. An example is Leleu and Dervaux (1999). Useful surveys of this burgeoning literature are provided by Hollingsworth (2003) and Worthington (2004). Some of the relevant papers have considered different types of hospital ownership. The results of the largely US-based studies discussed in Hollingsworth broadly suggest that the public sector is more efficient (see his Figure 4 on page 205); however, Worthington concludes in the opposite direction.3
This literature does not seem to have explicitly treated the question of public or private sector efficiency resulting from different staffing levels (as opposed to other inputs, or different choices of technology). Gentry and Penrod (2000) use American data to show that the number of staff per bed is higher in Not-For-Profit than For-Profit hospitals (with median figures of 3.30 and 2.44 respectively); this difference continues to hold in a regression analysis which controls for various factors which might be thought to affect expected profit, including the local county population.
Case studies of hospital conversions (from Not-For-Profit to For-Profit) in the USA reveal positive effects on hospital profits (although there is some debate as to whether this reflects increased efficiency or more aggressive accounting) together with a null or negative effect on hospital staffing levels (Cutler and Horwitz, 2000).
The analysis we carry out here is related to that in Alesina et al. (2000), who argue that “public employment is used as a way of directing income toward disadvantaged groups” (p.219). In their model, some public employment is a disguised transfer that avoids opposition to direct transfers. Their
2
The form of privatization matters, with privatization to foreigners associated with more positive productivity effects than domestic privatization.
focus is on income inequality and ethnic fragmentation. They consider the level of public employment in US cities (of over 25 000 inhabitants) in the early 1990s. The number of government employees per 1000 of the total population or per 1000 of the working age population (18-64) is positively correlated with both inequality and ethnic fragmentation. They also find an initial positive correlation between government employment and local unemployment, although this is not robust to the inclusion of State dummies. Along similar lines, Alesina et al. (2001) argue that public-sector employment is excessive in the South of Italy, as compared to the North, and as a consequence public service production in the South is far less efficient than in the North. They conclude that half of the public wage bill in the South represents redistribution, either in the form of inefficient employment or excessive wages.
In this paper, we also attempt to understand the determinants of public employment. We do so using information on the universe of French hospitals, and compare employment in (two types of) private hospital to employment in public hospitals. We explicitly focus on local deprivation, as measured by the unemployment rate, as one potential determinant of hospital staffing. This is shown to affect employment in public hospitals, but not employment in private hospitals. We will then show that the relationship between public employment and local unemployment is crucially moderated by the political position of the local council. We will broadly interpret these findings in terms of different levels of hospital output, the “helping hand” (overcoming market inefficiencies), and the “grabbing hand” (politicians’ self-interest).
3. Staffing Levels in French Hospitals
French hospitals are of three broad types: Public, Private Not-For-Profit, and Private For-Profit. We shall refer to these as Public, NFP, and Private, for simplicity. Both NFP and Public hospitals are reimbursed according to a global budget system. As such, they receive a fixed amount of funding for the current year which does not depend on the current year’s actual activity but rather on that recorded over the previous year.4 Private hospitals are financed on a fee-for-service basis. A Payment-Per-Service system (widely known in the US as a Prospective Payment System - PPS) has been partially implemented in both NFP and Public hospitals since 2004. One of the goals of this reform was to unify the reimbursement system and thereby to introduce a degree of competition between hospitals.
3
Efficiency measures are consistent but biased, with the bias depending on the number of observations, the number of input and output dimensions, and the density of observations around the relevant segment of the frontier. This makes efficiency comparisons across markets difficult unless the size and dimensions of the samples are similar.
4
The reality is somewhat fuzzier than this, which will allow hospitals some leeway in their current hiring decisions. In particular, the budget depends on the number of staff at the hospital and the number of beds. The declining number of beds may allow for additional hiring. In addition, the budget constraint in public hospitals has arguably been fairly soft: global budgets (which were introduced in 1983) were initially renegotiated every month and subsequently every three months.
The three broad hospital types do not only differ by their reimbursement procedures: there are also substantial differences in both the type of patients that they treat and the statute of their employees. Private hospitals are able to select their patients, whereas this is not possible in either NFP or Public hospitals. Moreover, employees in NFP and Private hospitals are private-sector workers, whereas those in Public hospitals are civil servants (i.e. public-sector employees). As such, these latter cannot be laid off for economic reasons.
The pay of the civil servants in Public hospitals does not depend in any immediate way on their performance, but is rather determined more by their qualifications and their tenure in the job. The staffing levels of Public hospitals are decided at the level of the Board of Directors, on which the mayor of the local commune sits. As such, local politics may well play a role in determining employment in a way that it does not (or does to a lesser extent) in NFP or Private hospitals. The mayor is elected by the commune’s inhabitants of voting age; as such mayors have an obvious interest in satisfying the local electorate in order to conserve their position at the next election. In terms of the subject matter of this paper, the mayor may well have an incentive to encourage employment in order to tackle local unemployment, even if the purely productive efficiency case for such hirings is less clear.
NFP hospitals thus occupy something of a hybrid position. While they operate under the same budgetary and admission constraints as Public hospitals, their staffing levels are determined in the same way as those in Private hospitals. This distinction will be useful to us later in the paper in the interpretation of the regression results.
The administrative data used in this paper come from the 19995 SAE survey (Statistiques Annuelles des Etablissements), which collected information on hospital staff and activities. We initially match in some local-area information (covering age distribution, unemployment, and nationality at the communal level) from the 1999 French Census. The data covers the universe of French hospitals. These 1788 establishments are split up into 736 Public hospitals, 193 NFP hospitals, and 859 Private hospitals.
The SAE survey includes information on hospital size (as measured by both the number of beds and the number of admissions per year), and the type of care that is provided to patients. Our key variable here is hospital staffing levels. In this respect, the SAE survey provides information on the number of Administrative staff, Support staff, Medical staff and Doctors. Support staff includes, for example, staff working on buildings and grounds, as well as the staff who provide social assistance to patients. Medical staff consists of Nurses (including Specialised Nurses), Paramedical Staff (for
5
example, physical therapists and dieticians) and nursing auxiliary staff. The four staffing groups differ notably by qualification level. Support staff are the least-qualified group, and Doctors the highest-qualified group.
The employment levels of Administrative, Support and Medical staff are calculated using information on hours of employment to produce a figure for the number of full-time equivalents. As these types of employees are salaried, this information is readily available. The resulting levels of employment are comparable between the three hospital types.
The situation is somewhat less clear with respect to Doctors’ employment. While Doctors are civil servants in Public hospitals, they are private-sector salaried or self-employed (profession libérale) in both NFP and Private hospitals. We have calculated a measure of hours of employment for self-employed Doctors, but it should be borne in mind that Doctors’ employment is not measured in exactly the same way across hospital types.
The focus of this paper is on hospital staffing levels. These are of course strongly correlated with the number of beds in the hospital, but, even for a given hospital size, staffing levels differ by hospital type. The raw figures are presented in the top panel of Table 1. Public hospitals employ more staff than do NFP or Private hospitals. All of the differences in employment levels are significant at the five per cent level, and most at the one per cent level.
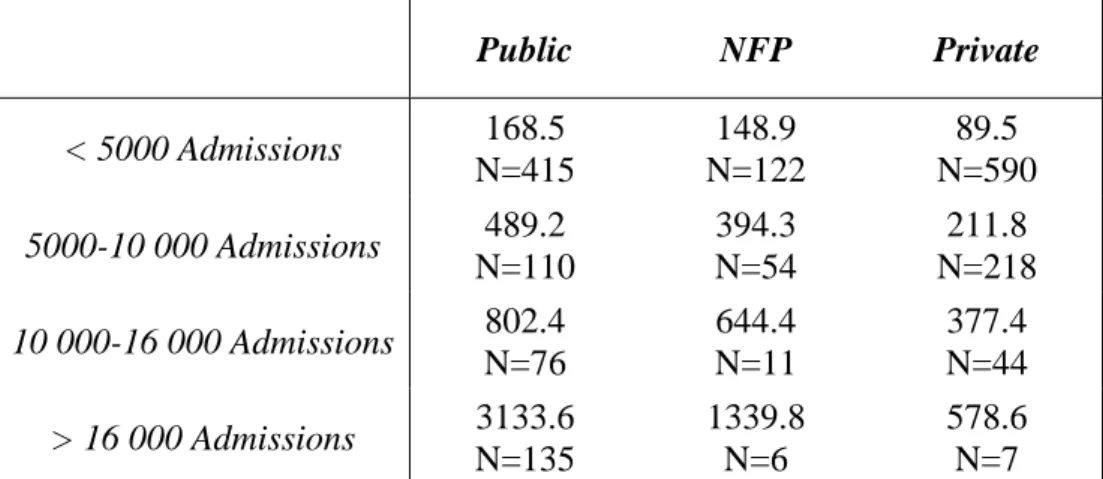
Part of the difference in staffing levels reflects hospital size, as some Public-sector hospitals are much larger than those in other sectors. One way of measuring size is the yearly number of admissions. As a first pass at looking at staffing levels by hospital type, we split yearly admissions up into four categories: up to 5000; between 5000 and 10 000; between 10 000 and 16 000; and over 16 000. These particular cut-points are those used by the French Ministry of Health in their comparisons of hospitals by size. The table in Appendix A shows average employment levels by both number of admissions and hospital type.6 Unsurprisingly, total employment rises with the number of admissions. However, even within size-class, Public-sector hospitals employ more workers than do their non-Public counterparts. Another way of reading this table is to say that employment grows with number of admissions for all hospital types, but it grows faster for Public hospitals than for other hospital types.7 Similar results can be obtained by using the number of beds as the measure of hospital size.
There are many reasons why staffing levels might differ between public and private hospitals, even conditional on hospital size. In particular, we might think of the medical procedures that are carried out, and the type of patients that are treated. This may well result from the ability of private
6
Somewhat more recent 2004 hospital employment data show exactly the same patterns.
7
hospitals to select their patients. In the following section, we use hospital administrative records to formally control for a number of different measures of medical procedures at the hospital level. We also control for some of the characteristics of the local population (at the level of the municipality) who are likely to use the hospital’s services.
4. Employment in Public and Private Sector Hospitals: Regression Analysis
Table 2 presents a formal regression analysis of hospital employment levels on a number of hospital-level and municipality-level explanatory variables. Specifically, at the hospital level we control for the number of beds (as an additional measure of hospital size), the severity of the illnesses treated (as measured by the Severity Gravity Index, SGI8), and the bed-occupancy rate. At the municipality level, we introduce the percentage of the population who are in the 60-74 and 75+ age groups, the local unemployment rate9, and the percentage of the population who are foreign-born.
The first two columns of Table 2 show the results when total employment is regressed on the same size and hospital type classification as used in Appendix A. All twelve of the elements in Appendix A appear here as dummy variables (there is thus no constant in the regression). This first regression reproduces the same statistical information as the figures in Appendix A. The regression on the right-hand side of Table 2 includes a number of control variables which might plausibly be considered to be correlated with the demand for healthcare and therefore the number of hospital employees.
The left-hand side of Table 2 shows that, without any other control variables, employment increases with hospital size. However, the employment-hospital size elasticity is far greater in public-sector hospitals than in other types of hospitals. We cannot reject that smaller hospitals (as measured by the number of admissions) have the same number of staff whatever their type; however, this equivalence fails for larger hospitals. The addition of the other explanatory variables on the right-hand side of Table 2 sharpens this conclusion: conditional on these other determinants of employment, Public hospitals employ more staff.
8
We use Deyo’s adaptation of the Charlson co-morbidity index to measure the severity of co-morbidities (Deyo, 1992; Ghali, 1996). The Charlson index, which is expressed as a six-level variable, is constructed for each stay. This index is greater than 0 when a surgical procedure has been carried out on the patient. Validation exercises have shown that this index predicts mortality in longitudinal data (Hamilton and Hamilton, 1997).
9
An alternative to the local unemployment rate is a dummy variable for whether the municipality is in an area designated as a “Zone Urbaine Sensible” (ZUS). These latter are urban zones defined as priority targets of local politics, according to a certain number of indicators of local problems. The Law of November 14, 1996 defined a number of tax and social policies, which are used to address these problems. All of our results with respect to unemployment can be reproduced using the ZUS dummy. As ZUS status changes less over time, it can be thought of as a more permanent indicator of local social malaise.
The full specification explains a great deal of the variation in hospital employment, with an adjusted R-squared of over 0.9. The two key variables determining employment (apart from hospital type and the number of admissions) are the number of hospital beds, which adds additional information about hospital size10, and the severity of the illnesses that are treated. Perhaps surprisingly, employment falls with the bed occupancy rate. In fact this negative bed-occupancy result is due to the presence of three very large central hospitals in France: APHP (Assistance Public-Hôpitaux de Paris), APHM (Assistance Public-Public-Hôpitaux de Marseille) and HCL (Hospices Civil de Lyon)11. Last, as a whole the municipality-level variables considered here only add relatively little to our understanding of hospital employment. The coefficient on the local unemployment rate is positive, but significant at only the ten per cent level (with a t-statistic of 1.88).
The conclusion from Table 2 is therefore that employment rises with hospital size and the severity of the illnesses treated. In addition, conditional on size and illness-severity, public-sector hospitals consistently employ more staff than do NFP or Private hospitals. Last, local area variables do not have huge explanatory power for hospital employment. The measure of local deprivation, the unemployment rate, is only relatively weakly positively correlated with hospital employment. However, we shall see that this weak aggregate correlation actually masks widely-varying employment-local deprivation relationships by hospital type. Further, the strength of these latter correlations is moderated by local politics. This is the subject of the next section.
5. Hospital Employment: Labour Market Tightness and Political Allegiance
The regression in Table 2 supposed that local labour market conditions have the same effect on employment in all types of hospital. The empirical results below will show that this is a poor supposition: unemployment in fact only affects employment in Public Sector hospitals. For presentational reasons, we henceforth introduce separate hospital type dummies (i.e. no longer interacted with the number of admissions) and control for hospital size independently via the number of beds. To check for heterogeneity in the local unemployment – hospital employment relationship, we interact the local unemployment rate with hospital type (Public, NFP, and Private). These three interaction variables thus replace the “local unemployment rate” variable of Table 2 in the employment regression.
10
We did look for non-linearity in this relationship, but the number of beds was strongly preferred to the log of the number of beds in terms of explanatory power.
11
These three mega-units have higher bed-occupancy rates in the raw data, but lower bed-occupancy rates conditional on the other explanatory variables on the right-hand side of Table 2. All of the key results in the rest of the paper include these three large central hospitals, but are robust to their exclusion.
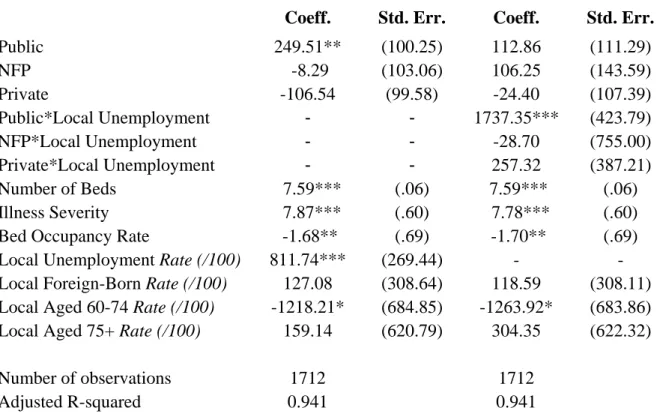
We estimate two separate empirical models. The first, on the left-hand side of Table 3, reproduces the analysis in Table 2, but now with only the three separate hospital type dummies (instead of hospital type interacted with hospital size). The estimated coefficients repeat the message from Table 2: Public hospitals have higher staffing levels than other hospitals, and employment rises with the local unemployment rate.
The model on the right-hand side of Table 3 interacts the local unemployment rate with hospital type. The main effects of the Public, NFP, and Private dummies in this specification are now insignificant. As such, when unemployment is low the regression results suggest that all hospital types would employ the same number of staff (for a given number of beds and illness severity). The difference in employment between hospital types then works entirely through local deprivation. As Table 3 shows, the interaction between the Public hospital dummy and the local unemployment rate is positive and significant, with a t-statistic of over 4. By way of contrast, the estimated coefficients on the interactions between the other hospital types and the local unemployment rate are both very insignificant. The greater hospital employment that comes with local deprivation (as shown in the left-hand side of Table 3) then results exclusively from more jobs in public-sector hospitals. Employment in both NFP and Private hospitals is independent of the local unemployment rate.12 The other explanatory variables have much the same relationship with hospital employment as in Table 2.
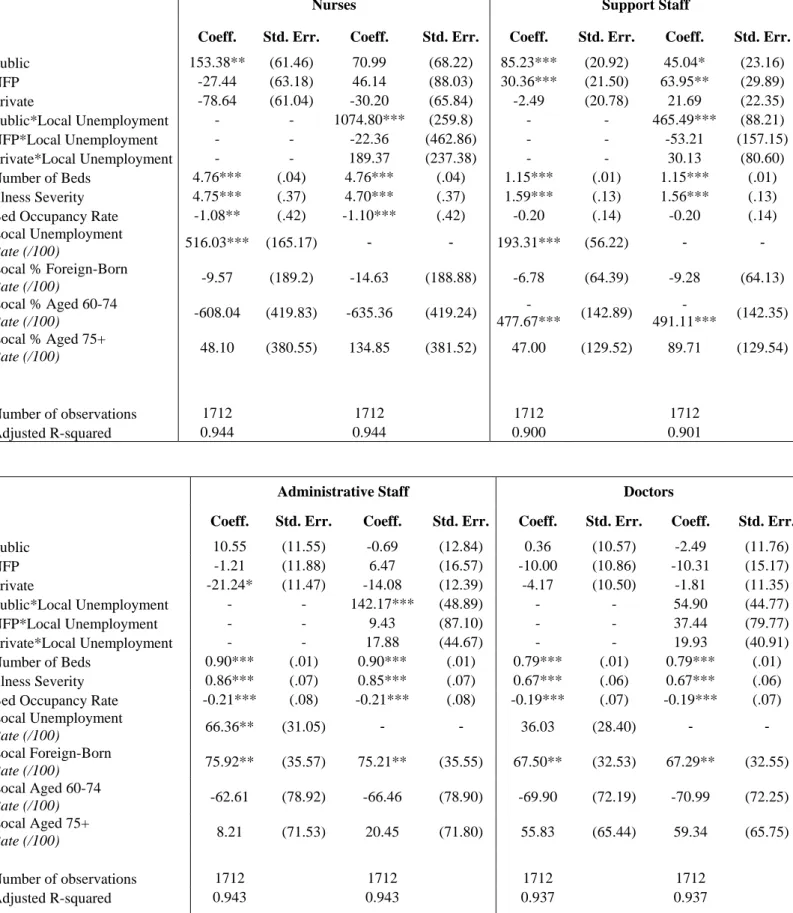
We then consider the different categories of medical staff. These are divided up into four groups: Administrative staff, Support staff, Medical staff and Doctors. Support staff are mostly lower-qualified. We carry out the same type of employment regressions as for the whole sample in Table 3; the results are presented in Table 4. Local unemployment has no significant effect on the employment of all four kinds of personnel in both NFP and Private hospitals. Table 3’s aggregate figure did not therefore hide any specific effects for certain types of personnel. The situation is different in Public hospitals. Here local unemployment positively affects the staffing levels of Nursing, Support and Administrative staff, but has no significant effect on the employment of Doctors. Public hospitals then seem to react to local labour market conditions in an entirely different way from non-public hospitals. The estimated coefficients in Tables 3 and 4 are consistent with Public hospitals playing a Keynesian role in providing employment in depressed areas (except for the group that arguably have the best employment prospects: Doctors).13
12
That the public sector effectively provides partial insurance against unemployment is consistent with lower wages in the public sector (via a compensating differential) and with regional unemployment reducing the life satisfaction of private-sector workers more than their public-private-sector counterparts (Luechinger et al., 2007).
13
Alternatively, it may be the case that the labour market for Doctors is more national than local, weakening any local-level correlation.
An alternative explanation is that the local unemployment rate is providing additional information on the morbidity of the local population (and thus the demand for healthcare) that is orthogonal to that supplied by the Illness Severity Index. If this is indeed the case then the additional healthcare demand only seems to impact on Public hospitals. One supporting argument for this kind of differential effect is that Private hospitals can cherry-pick their patients, and may by doing so effectively be insulated from any general worsening of the client population’s health. This would explain why employment in Public hospitals reacts to local deprivation while employment in Private hospitals does not. The weak point in this argument is the estimated coefficients on NFP hospitals. These hospitals are not allowed to select their patients either. Were local unemployment to be a measure of the demand for health, we would expect it to have a similar impact on Public and NFP hospitals. In fact it has no impact on employment in the latter. The cleavage in the effect of local unemployment on employment is in terms of whether their employees are civil servants (Public) or private (NFP and Private), rather than in terms of whether the hospitals can select their patients (Private) or not (Public and NFP).
The numbers in Tables 3 and 4 are therefore consistent with employment in Public hospitals reflecting both political and health priorities. To formalise the potential role of political preferences, we consider the possibility that the employment-local unemployment relationship be mediated by politic factors. A growing literature has developed around the idea of political business cycles, with a smaller empirical counterpart that has explicitly considered political influences on public employment. Coelho et al. (2006) identify pre-election employment effects in Portugese municipalities, especially for the Right. In the context of the current paper, they do not relate this employment effect to the municipal unemployment rate. Lamo et al. (2007) appeal to aggregate data and do find evidence of lagged procyclicality of a number of measures of public sector activity, although the evidence with respect to public employment seems less strong.
We will here relate the strength of the hospital employment-local unemployment relationship to the political position of the local municipality. To do so, we appeal to the Political Science literature and use expert evaluations of various parties’ political positions to calculate a weighted political stance score for each commune. We will then show that the Public Hospital response to local unemployment is muted in more right-wing communes.
Our expert evaluation scores come from Laver et al. (2006), who show not only the positions of French parties on the most salient policy dimensions, but also the relative importance that parties attach to each dimension. Laver et al. estimate the policy positions by conducting an expert survey in which they collected the judgements of French political scientists on the policy positions of the French parties. This survey followed the model of expert surveys conducted by Laver and Hunt (1992), and
provides a score for each party regarding their “social policy” (for more details, see the Appendix in Laver et al., 2006). This score takes values between 2.5 to 18.9, with higher scores referring to more right-wing parties.
There are two ways of calculating a political score for each hospital, according to the round of the local elections. Both of these require that we match our hospital data to local election results in the different municipalities. French local elections take place every six years,14 and consist of two rounds. In the first round, there is no limit on the number of candidates who can stand. To be elected directly in the first round, a candidate must receive more than 50 per cent of the votes cast. Barring this relatively unusual outcome, the two candidates with the most votes in the first round go forward to compete against each other in a second round. The first method of calculating local political scores then consists in taking the “social policy” score of the party to which the winning candidate (in either the first or the second round) belongs. The second method consists in calculating a weighted score using the percentage voting scores from the first round of the election.
It is not a priori clear which of the two political scores (weighted first round scores, or the winning party only) will be more appropriate. We want to measure the political “flavour” of each local municipality. The winning score will indeed tell us which party is in charge, but will not reveal the ease of the victory. This latter is important, as the number of seats on the local council depend on the number of votes cast: losing parties will thus also be represented. On the other hand, first-round voting is sometimes argued to be either strategic or to contain a certain “protest” element. In the remainder of the paper we will use the first-round method of calculating local political scores. In practice, both calculation methods produce remarkably similar regression results. Our data refer to the local elections of 1995. It can be argued that these are some distance in time from the observation of hospital employment in 1999. Using results from the following local elections, in 2001, produces similar results.
We require data on the number of votes for each party in each round of local elections. These data are unfortunately not available for communes with fewer than 10 000 inhabitants. For the sub-sample of larger communes we can thus match electoral outcomes directly to the hospital; for the smaller communes we will have to use the electoral results at a more aggregated level (known as the ZE level). We expect this latter imputation to introduce measurement error. We thus have two samples, and two sets of estimation results. The first comes from direct matches, and concerns a smaller number of hospitals in larger communes; the second set of estimates will come from a larger sample, but
14
The fact that elections all take place on the same day means that it will not be possible to test for strategic pre-election political behaviour (as in Levitt, 1997), as the pre-election period cannot be identified separately from any macro developments.
where one of our key variables is less-accurately measured. We expect that the standard errors will be lower in the second case (due to the larger sample) as will the estimated coefficients (as a result of attenuation bias). This is in fact what we observe in the results.
Our final political variable is called “Right”. Since the different parties’ positions regarding “social policy” take values between 2.5 to 18.9, so does our political variable. It should be remembered that “Right” is a continuous variable, and not binary.
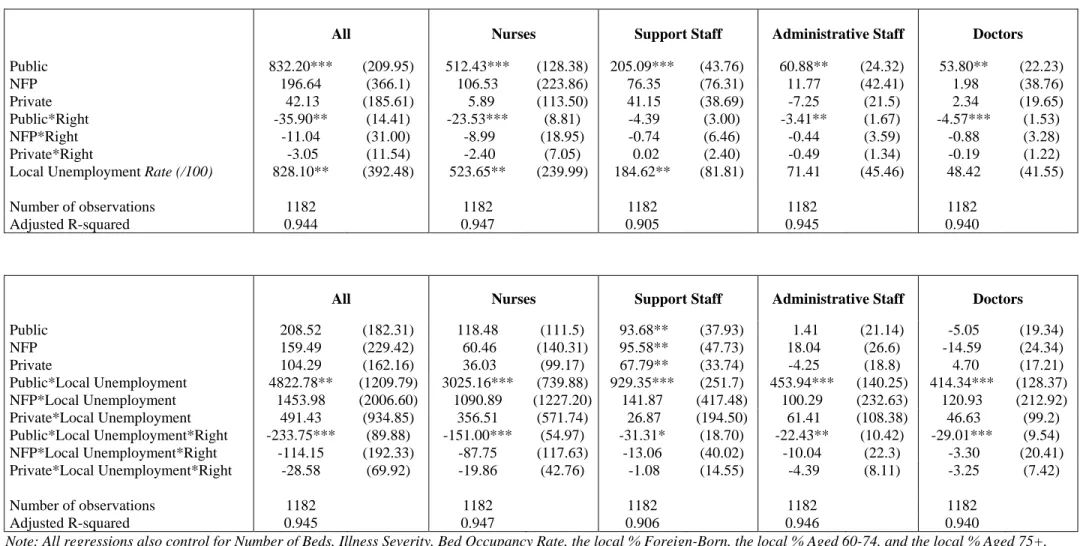
We first present results for the smaller sample where we can match hospitals exactly to voting outcomes. The top half of Table 5 shows the estimated coefficients on interactions between local political position and hospital type in an employment regression. These show that the more right-wing a local area is, the lower is the level of employment in Public hospitals; there is no significant effect of local politics on employment in either NFP or Private hospitals. The negative effect of “Right” on employment is found for total employment, and for employment in each of the four groups (except for Support staff, where the estimated coefficient is negative but not significant). All of the regressions in Table 5 control for all of the other explanatory variables that appeared in Tables 2-4.
The bottom half of Table 5 brings together the results from Table 4 (with respect to local unemployment rates) with those from the top half of Table 5 (regarding local Politics). The regressions here include two sets of interactions. The first (as in Table 4) interacts hospital type with the local unemployment rate; the second then interacts this unemployment interaction with local Politics. The first set of interactions thus tells us how hospital employment moves with local labour market conditions, and the second set tells us whether the size of the first interaction depends on the left/right position of the local municipality.
The results first show that, as in Table 4, employment in Public hospitals increases with the local unemployment rate. Further, the estimated coefficients on the second set of interactions show that this “Keynesian” effect is diminished as the local municipality moves to the right. Neither local labour market conditions nor local politics have any significant effect on employment in NFP or Private hospitals.
Table 6 reproduces exactly the analysis in Table 5, but for the larger sample of hospitals that results from matching in Political information at the ZE level. The same results continue to hold in this larger sample. As we suspected, the standard errors are generally smaller (due to the larger sample), but so are the estimated coefficients (due to attenuation bias). These results are again consistent with public-sector hospitals playing a Keynesian role, increasing employment in slack labour markets. This response is smaller in more right-wing areas.
To illustrate this effect, we have carried out a number of simulations of employment in Public hospitals. These are shown in Table 7, which consists of two panels. These correspond to the bottom panels of Tables 5 and 6. There are three lines within each panel. The first shows what we call a “Baseline” level of employment at a Public sector hospital. This is predicted from the employment regressions, setting hospital type equal to Public, and all other variables at their sample average. In other words, this is the predicted level of employment at a Public-sector hospital in a municipality with exactly average characteristics
We then carry out two changes to these average characteristics. First, we change the local political tapestry by shifting ten per cent of voters from the Parti Socialiste (Left-Wing) to the RPR (which is now known as the UMP; Right-Wing). As a result, the value of the “Right” variable increases (by just under one, in fact). The second change consists in reducing the local unemployment rate from the sample average of almost fifteen per cent15 to ten per cent. We calculate the predicted percentage change in employment due to these changes. Both are predicted to reduce Public-hospital employment, although the effect of falling unemployment is much larger. This Table shows that the fall in employment is felt across all types of Staff. However, the effect of unemployment is particularly strong amongst Support Staff. This is the least-educated group, and arguably that which is most at risk when the labour market sours.
Interpretations
The results so far indicate that public-sector hospital employment reacts to local labour markets and politics very differently from employment in not-for-profit and private hospitals. This last sub-section considers a number of potential explanations of this result.
1) Unemployment and Wages
It is fairly firmly established that greater levels of local unemployment reduce local wages (Blanchflower and Oswald, 1990). Might increased hospital employment be part of a natural labour market response to falling wages? There are three reasons to doubt this interpretation. First, if this were so, we would expect to see increased employment across all hospital types. Second, in the public sector, wages are largely fixed at the national level. Last, it is unclear how the effect of local politics in Table 6 should mediate any wage response to unemployment.
15
This is the average unemployment rate of the municipalities in which there is a hospital. It is not weighted by municipality size, and is therefore not representative of the unemployment rate in France.
2) Unions
Higher employment in public hospitals might reflect stronger public-sector unions, and unions may react to local unemployment. Two remarks seem salient here. First, while union membership is very low in France, collective bargaining coverage is close to universal (OECD, 1997), so there is little coverage differential between the public and private sectors. Second, union membership is far more prevalent amongst Doctors than it is amongst Nurses and less-qualified workers, yet it is for this latter group that we estimate the greatest employment response to local unemployment.
3) Helping Hand or Grabbing Hand?
Local politicians may react to local unemployment by increased public-hospital employment for two reasons: to overcome market failure, or for their own interests. If there is some rent associated with greater employment, then it will be in fact difficult to distinguish between the grabbing and helping hands. But if we consider that politicians’ self-interest partly reflects their desire to be re-elected, then a natural test presents itself. Levitt (1997) appealed to time differences in local elections to establish an exogenous effect of policing on crime. Here we consider a cross-section analogy: how close the result was in the most recent election. We distinguish between tight races, where the difference between the winning party’s votes and the other parties’ votes was less than the median across the sample of municipalities used in Table 5 above, and not-tight races where the winning margin was larger. With the helping hand, we imagine that parties would have greater latitude to push through their priorities when their majority is larger: the political effect on employment will then be greater in not-tight races. However, under the grabbing hand parties may try to please voters more when there is a greater chance of being voted out next election: here we expect the political effect on employment to dominate in tight races.
We thus re-estimated the bottom panel of Table 5 separately for tight and not-tight elections. The results are shown in Table 8. The first set of estimated coefficients in each panel show that public hospitals employ more people in high-unemployment regions, in both tight electoral races and not-tight electoral races. The second set of estimated coefficients shows that the left-right position of the local municipality only matters in tight electoral races. This is consistent with strategic employment, decisions: either more left-wing municipalities make a greater effort to increase employment when unemployment is high, or more right-wing municipalities reduce public-sector employment in tighter labour markets. With larger political majorities, these effects are attenuated.
6. Conclusion
This paper has contributed to the debate on efficiency in the public and private sectors by considering staffing levels in three different types of French hospitals. Administrative data provide us with hospital-level information on the employment of four different kinds of workers, as well as hospital size, the kind of illnesses treated and so on. We first show that public hospitals employ more staff than do non-public hospitals, conditional on size and illnesses treated. This might be thought of as an indication of general lower public-sector productivity.
An alternative reading is that public hospitals cannot cherry-pick their patients, and therefore have to deal with cases that are (unobservably in this dataset) more difficult to handle, and thus require more staff. The particular structure of the French health system allows us to make some headway in dealing with this point. Between public hospitals (whose staff are civil servants, with employment decided in part by the local council, and which cannot select their patients) and private hospitals (whose staff are private sector, and which can select their patients) there is a third category: NFP hospitals. Their staff are private sector, but the hospitals cannot select their patients. The fact that public hospitals employ significantly more staff than both private and NFP hospitals suggests that it is the method of deciding employment rather than patient selection which is behind the differences in staffing levels.
Further support for this reading of the data comes from the matching in of two key local-level variables: the unemployment rate and the results of recent elections. We first show that employment in public hospitals is strongly positively correlated with the local unemployment rate, whereas this is not true for other hospital types. We further show that this dependence between public hospital employment and the local unemployment rate is moderated by local politics. In particular, the more left-wing the local commune the stronger is the relationship between local unemployment and public hospital employment. All of these relationships are stronger for lower-skilled workers. These results lead us to suspect that public hospitals play a dual role, partly being used as a policy instrument to provide local employment.
There are a number of implications. A straightforward one is that employment in areas which have Public sector hospitals will move differently over the economic cycle than employment in areas with non-Public hospitals, or no hospitals at all.
A second policy implication concerns the debate over the introduction of competition between hospitals whatever the sector. The employment externalities that we think we have found in our data call for some caution in comparing performance across hospital types. In particular, public hospitals may be providing employment to those who would otherwise struggle in a slack labour market (a
“helping hand” activity16). It is entirely possible that this “surplus” employment penalises Public hospitals in efficiency calculations. However, this inefficiency may be to a large extent exogenous to their own efforts, and instead reflect economic conditions in the local commune. A broader notion of public service may include not only good service to patients, but also the needs of the local community in terms of employment. Any comparison between the public and the private sector purely in terms of the efficiency of the health service provided (in terms of cost) to patients will be inherently biased against the public sector; however this comparison may not tell the whole story with respect to social welfare. The question of whether this kind of job creation is a good way of using public money is crucial, but not one that we can answer with our current data.
Shleifer and Vishny distinguished between government actions that served to increase social welfare and actions that served to increase politicians’ self-interest: the helping and grabbing hands, respectively. The finding that public-sector employment reacts positively to local unemployment is arguably consistent with both readings. Greater employment may raise social welfare, or alternatively increase the resources that politicians control or their re-election chances. In this optic, it is of interest to ask why the employment response should be greater for Left-wing rather than Right-wing administrations. The helping hand reading is that Left-wing councils believe that the externalities from unemployment are higher; the grabbing hand reading is that local politicians follow their electorates’ preferences in this matter in order to preserve their own position. The finding that local politics only matters when the previous election was relatively tight is consistent with the latter reading.
Last, and perhaps most generally, we might wonder to what extent French hospitals are a special case. It would be of great interest to see whether the same employment effects exist in other areas of Public sector activity, such as the railways, education and local administrations, and indeed whether we have uncovered an “exception française”, or whether the employment-unemployment-politics nexus is a general characteristic of the public sector in other countries.
16
This not only benefits those who obtain such jobs. Lower local unemployment may more broadly improve the quality of local life: see Öster and Agell (2007) for the relationship between unemployment and crime.
Appendix A. Employment Levels by Size and Hospital Status Public NFP Private < 5000 Admissions 168.5 N=415 148.9 N=122 89.5 N=590 5000-10 000 Admissions 489.2 N=110 394.3 N=54 211.8 N=218 10 000-16 000 Admissions 802.4 N=76 644.4 N=11 377.4 N=44 > 16 000 Admissions 3133.6 N=135 1339.8 N=6 578.6 N=7
Table 1. Hospital Employment Levels and Variable Means
Hospital Type No. of Hospitals No. of Employees Std. Dev. Minimum Maximum
Public 736 825.7 3143.0 17.4 77253.6
NFP 193 282.8 287.2 10.8 1906.0
Private 859 139.3 104.9 4.0 935.3
Note: Number of employees measured in FTEs.
No. of Observation
s
Mean Std. Dev. Minimum Maximum
No. of Beds 1713 66.80 247.14 1 9216
No. Employees 1744 6802.42 18409.93 2 606298
Illness Severity 1788 5.09 25.23 0 768.92
Bed Occupancy Rate 1718 73.81 18.36 0.18 179.71
Local Unemployment Rate (/100) 1788 0.148 0.048 0 0.356 Local Foreign-Born Rate (/100) 1788 0.062 0.046 0 0.297 Local Aged 60-74 Rate (/100) 1788 0.140 0.031 0.029 0.251 Local Aged 75+ Rate (/100) 1788 0.093 0.034 0 0.313
Table 2. Hospital Employment Regressions
Coeff. Std. Err. Coeff. Std. Err.
Public (<5000) 168.45* (92.87) 142.59 (101.9) Public (5000-10000) 489.24*** (180.39) 169.46 (108.24) Public (10000-16000) 802.40*** (217.03) 142.79 (112.17) Public (16000+) 3133.63*** (162.84) 549.13*** (107.33) NFP (<5000) 148.90 (171.29) -22.62 (106.3) NFP (5000-10000) 394.33 (257.47) -25.20 (116.2) NFP (10000-16000) 644.40 (570.46) -127.81 (185.17) NFP (16000+) 1339.85* (772.4) 66.53 (230.03) Private (<5000) 89.53 (77.89) -112.37 (98.93) Private (5000-10000) 211.77* (128.14) -140.61 (103.54) Private (10000-16000) 377.39 (285.23) -148.66 (125.3) Private (16000+) 578.56 (715.11) -354.25 (216.97) Number of Beds - - 7.52*** (.06) Illness Severity - - 7.14*** (.61)
Bed Occupancy Rate - - -1.81*** (.69)
Local Unemployment Rate (/100) - - 510.87* (271.88)
Local Foreign-Born Rate (/100) - - 88.87 (306.67)
Local Aged 60-74 Rate (/100) - - -764.73 (683.58)
Local Aged 75+ Rate (/100) - - 411.42 (621.66)
Number of observations 1788 1712
Adjusted R-squared 0.182 0.943
*** = significant at the 1% level; ** = significant at the 5% level; and * = significant at the 10% level.
Table 3. Hospital Employment and Local Deprivation
Coeff. Std. Err. Coeff. Std. Err.
Public 249.51** (100.25) 112.86 (111.29) NFP -8.29 (103.06) 106.25 (143.59) Private -106.54 (99.58) -24.40 (107.39) Public*Local Unemployment - - 1737.35*** (423.79) NFP*Local Unemployment - - -28.70 (755.00) Private*Local Unemployment - - 257.32 (387.21) Number of Beds 7.59*** (.06) 7.59*** (.06) Illness Severity 7.87*** (.60) 7.78*** (.60)
Bed Occupancy Rate -1.68** (.69) -1.70** (.69)
Local Unemployment Rate (/100) 811.74*** (269.44) - -
Local Foreign-Born Rate (/100) 127.08 (308.64) 118.59 (308.11)
Local Aged 60-74 Rate (/100) -1218.21* (684.85) -1263.92* (683.86)
Local Aged 75+ Rate (/100) 159.14 (620.79) 304.35 (622.32)
Number of observations 1712 1712
Adjusted R-squared 0.941 0.941
*** = significant at the 1% level; ** = significant at the 5% level; and * = significant at the 10%
Table 4. Hospital Employment and Local Deprivation: By Staff Type
Nurses Support Staff
Coeff. Std. Err. Coeff. Std. Err. Coeff. Std. Err. Coeff. Std. Err.
Public 153.38** (61.46) 70.99 (68.22) 85.23*** (20.92) 45.04* (23.16) NFP -27.44 (63.18) 46.14 (88.03) 30.36*** (21.50) 63.95** (29.89) Private -78.64 (61.04) -30.20 (65.84) -2.49 (20.78) 21.69 (22.35) Public*Local Unemployment - - 1074.80*** (259.8) - - 465.49*** (88.21) NFP*Local Unemployment - - -22.36 (462.86) - - -53.21 (157.15) Private*Local Unemployment - - 189.37 (237.38) - - 30.13 (80.60) Number of Beds 4.76*** (.04) 4.76*** (.04) 1.15*** (.01) 1.15*** (.01) Illness Severity 4.75*** (.37) 4.70*** (.37) 1.59*** (.13) 1.56*** (.13) Bed Occupancy Rate -1.08** (.42) -1.10*** (.42) -0.20 (.14) -0.20 (.14) Local Unemployment Rate (/100) 516.03*** (165.17) - - 193.31*** (56.22) - - Local % Foreign-Born Rate (/100) -9.57 (189.2) -14.63 (188.88) -6.78 (64.39) -9.28 (64.13) Local % Aged 60-74 Rate (/100) -608.04 (419.83) -635.36 (419.24) -477.67*** (142.89) -491.11*** (142.35) Local % Aged 75+ Rate (/100) 48.10 (380.55) 134.85 (381.52) 47.00 (129.52) 89.71 (129.54) Number of observations 1712 1712 1712 1712 Adjusted R-squared 0.944 0.944 0.900 0.901
Administrative Staff Doctors
Coeff. Std. Err. Coeff. Std. Err. Coeff. Std. Err. Coeff. Std. Err.
Public 10.55 (11.55) -0.69 (12.84) 0.36 (10.57) -2.49 (11.76) NFP -1.21 (11.88) 6.47 (16.57) -10.00 (10.86) -10.31 (15.17) Private -21.24* (11.47) -14.08 (12.39) -4.17 (10.50) -1.81 (11.35) Public*Local Unemployment - - 142.17*** (48.89) - - 54.90 (44.77) NFP*Local Unemployment - - 9.43 (87.10) - - 37.44 (79.77) Private*Local Unemployment - - 17.88 (44.67) - - 19.93 (40.91) Number of Beds 0.90*** (.01) 0.90*** (.01) 0.79*** (.01) 0.79*** (.01) Illness Severity 0.86*** (.07) 0.85*** (.07) 0.67*** (.06) 0.67*** (.06) Bed Occupancy Rate -0.21*** (.08) -0.21*** (.08) -0.19*** (.07) -0.19*** (.07) Local Unemployment Rate (/100) 66.36** (31.05) - - 36.03 (28.40) - - Local Foreign-Born Rate (/100) 75.92** (35.57) 75.21** (35.55) 67.50** (32.53) 67.29** (32.55) Local Aged 60-74 Rate (/100) -62.61 (78.92) -66.46 (78.90) -69.90 (72.19) -70.99 (72.25) Local Aged 75+ Rate (/100) 8.21 (71.53) 20.45 (71.80) 55.83 (65.44) 59.34 (65.75) Number of observations 1712 1712 1712 1712 Adjusted R-squared 0.943 0.943 0.937 0.937
Table 5. Politics, Unemployment and Hospital Staffing: Reduced Sample
All Nurses Support Staff Administrative Staff Doctors
Public 832.20*** (209.95) 512.43*** (128.38) 205.09*** (43.76) 60.88** (24.32) 53.80** (22.23) NFP 196.64 (366.1) 106.53 (223.86) 76.35 (76.31) 11.77 (42.41) 1.98 (38.76) Private 42.13 (185.61) 5.89 (113.50) 41.15 (38.69) -7.25 (21.5) 2.34 (19.65) Public*Right -35.90** (14.41) -23.53*** (8.81) -4.39 (3.00) -3.41** (1.67) -4.57*** (1.53) NFP*Right -11.04 (31.00) -8.99 (18.95) -0.74 (6.46) -0.44 (3.59) -0.88 (3.28) Private*Right -3.05 (11.54) -2.40 (7.05) 0.02 (2.40) -0.49 (1.34) -0.19 (1.22)
Local Unemployment Rate (/100) 828.10** (392.48) 523.65** (239.99) 184.62** (81.81) 71.41 (45.46) 48.42 (41.55)
Number of observations 1182 1182 1182 1182 1182
Adjusted R-squared 0.944 0.947 0.905 0.945 0.940
All Nurses Support Staff Administrative Staff Doctors
Public 208.52 (182.31) 118.48 (111.5) 93.68** (37.93) 1.41 (21.14) -5.05 (19.34) NFP 159.49 (229.42) 60.46 (140.31) 95.58** (47.73) 18.04 (26.6) -14.59 (24.34) Private 104.29 (162.16) 36.03 (99.17) 67.79** (33.74) -4.25 (18.8) 4.70 (17.21) Public*Local Unemployment 4822.78** (1209.79) 3025.16*** (739.88) 929.35*** (251.7) 453.94*** (140.25) 414.34*** (128.37) NFP*Local Unemployment 1453.98 (2006.60) 1090.89 (1227.20) 141.87 (417.48) 100.29 (232.63) 120.93 (212.92) Private*Local Unemployment 491.43 (934.85) 356.51 (571.74) 26.87 (194.50) 61.41 (108.38) 46.63 (99.2) Public*Local Unemployment*Right -233.75*** (89.88) -151.00*** (54.97) -31.31* (18.70) -22.43** (10.42) -29.01*** (9.54) NFP*Local Unemployment*Right -114.15 (192.33) -87.75 (117.63) -13.06 (40.02) -10.04 (22.3) -3.30 (20.41) Private*Local Unemployment*Right -28.58 (69.92) -19.86 (42.76) -1.08 (14.55) -4.39 (8.11) -3.25 (7.42) Number of observations 1182 1182 1182 1182 1182 Adjusted R-squared 0.945 0.947 0.906 0.946 0.940
Note: All regressions also control for Number of Beds, Illness Severity, Bed Occupancy Rate, the local % Foreign-Born, the local % Aged 60-74, and the local % Aged 75+. *** = significant at the 1% level; ** = significant at the 5% level; and * = significant at the 10% level.
Table 6. Politics, Unemployment and Hospital Staffing: All
All Nurses Support Staff Administrative Staff Doctors
Public 505.73*** (145.69) 320.34*** (89.27) 121.59*** (30.42) 33.68** (16.81) 30.12** (15.37) NFP 0.11 (282.81) -9.86 (173.28) 25.39 (59.06) -2.36 (32.64) -13.05 (29.84) Private -59.45 (139.64) -46.01 (85.56) 1.83 (29.16) -15.20 (16.11) -0.07 (14.73) Public*Right -22.44** (9.92) -14.90** (6.08) -2.70 (2.07) -2.07* (1.14) -2.77*** (1.05) NFP*Right 0.11 (24.13) -1.24 (14.78) 0.88 (5.04) 0.16 (2.78) 0.31 (2.55) Private*Right -3.27 (9.61) -2.47 (5.89) 0.03 (2.01) -0.51 (1.11) -0.32 (1.01)
Local Unemployment Rate (/100) 809.76*** (283.95) 513.91*** (173.98) 195.67*** (59.29) 65.23** (32.77) 34.95 (29.96)
Number of observations 1614 1614 1614 1614 1614
Adjusted R-squared 0.942 0.944 0.901 0.943 0.937
All Nurses Support Staff Administrative Staff Doctors
Public 117.53 (117.67) 70.86 (72.10) 50.29** (24.52) -0.76 (13.6) -2.87 (12.44) NFP 121.56 (153.29) 56.88 (93.92) 69.56** (31.94) 7.08 (17.71) -11.97 (16.21) Private -17.44 (113.26) -27.74 (69.39) 26.43 (23.60) -14.16 (13.09) -1.97 (11.98) Public*Local Unemployment 3344.13*** (818.60) 2135.27*** (501.56) 663.40*** (170.56) 292.48*** (94.58) 252.98*** (86.57) NFP*Local Unemployment 815.76 (1638.67) 643.57 (1004.03) 63.24 (341.42) 76.23 (189.33) 32.71 (173.29) Private*Local Unemployment 551.61 (762.01) 391.72 (466.89) 42.78 (158.77) 62.88 (88.04) 54.24 (80.58) Public*Local Unemployment*Right -149.23** (65.25) -98.50** (39.98) -17.50 (13.60) -14.17* (7.54) -19.05*** (6.9) NFP*Local Unemployment*Right -89.76 (159.63) -71.50 (97.81) -12.02 (33.26) -7.06 (18.44) 0.82 (16.88) Private*Local Unemployment*Right -29.99 (58.89) -20.49 (36.08) -1.50 (12.27) -4.48 (6.8) -3.52 (6.23) Number of observations 1614 1614 1614 1614 1614 Adjusted R-squared 0.942 0.944 0.902 0.943 0.937
Note: All regressions also control for Number of Beds, Illness Severity, Bed Occupancy Rate, the local % Foreign-Born, the local % Aged 60-74, and the local % Aged 75+. *** = significant at the 1% level; ** = significant at the 5% level; and * = significant at the 10% level.
Table 7. Estimated Public Hospital Employment Effects of Politics and Economics
All Nurses Support Staff
Administrativ
e Staff Doctors
Table 5 – bottom
Baseline 724.8 458.9 146.7 70.9 48.3 10% vote switch Left to Right -4.4% -4.5% -2.9% -4.4% -8.3% Unemployment rate drops
from 15% to 10% -15.7% -15.1% -19.7% -14.8% -10.8%
Table 6 – bottom
Baseline 675.1 428.1 128.6 69.2 49.1 10% vote switch Left to Right -3.0% -3.2% -1.9% -2.8% -5.3% Unemployment rate drops from 15% to
10% -12.7% -12.4% -18.0% -10.0% -5.1%
Table 8. Politics, Unemployment and Hospital Staffing: The role of Tight Electoral Races
All Nurses Support Staff Administrative
Staff
Doctors Tight Electoral Races
Public*Local Unemployment 5020.017** 3093.889** 1040.909** 474.975** 410.244*
(1618.76) (949.754) (360.702) (172.618) (159.923)
Public*Local Unemployment*Right -280.741* -168.326* -58.873* -24.913* -28.629*
(116.120) (68.130) (25.875) (12.383) (11.472)
Not-Tight Electoral Races
Public*Local Unemployment 3576.289* 2174.481** 759.022* 325.817* 316.970*
(1415.138) (839.223) (311.338) (151.603) (141.015)
Public*Local Unemployment*Right -92.309 -55.987 -15.725 -6.006 -14.590
(108.695) (64.460) (23.913) (11.644) (10.831)
Note: All regressions also control for the other variables indicated in Table 5. *** = significant at the 1% level; ** = significant at the 5% level; and * = significant at the 10% level.
REFERENCES
Alesina, A., Baqir, R. and Easterly, W. (2000). “Redistributive Public Employment”. Journal of Urban Economics, vol. 48, pp.219-241.
Alesina, A., Danninger, S. and Rostagno, M. (2001), “Redistribution Through Public Employment: The Case of Italy”, IMF Staff Papers, vol. 48, pp. 447-473.
Blanchflower, D.G. and Oswald, A.J. (1994). The Wage Curve. Cambridge, Mass: MIT Press. (1990).
Blank, J. (ed.) Public Provision and Performance: Contributions from Efficiency and Productivity Measurement, Elsevier.
Boycko, M., Shleifer, A. and Vishny, R. (1996). “A Theory of Privatization”. Economic Journal, vol. 106, pp. 309-319.
Brown, J., Earle, J. and Telegdy, A. (2006). “The Productivity Effects of Privatization: Longitudinal Estimates from Hungary, Romania, Russia, and Ukraine”. Journal of Political Economy, 114, 61–99.
Coelho, C., Veiga, F., and Veiga, L. (2006). "Political business cycles in local employment: Evidence from Portugal". Economics Letters, 93, 82-87.
Cutler, D. and Horwitz, J. (2000), “Converting Hospitals from Not-for-Profit to For-Profit Status: Why and What Effects?”, in Cutler, D. (Ed.), The Changing Hospital Industry: Comparing Not-for-Profit and For-Profit Institutions, Chicago: University of Chicago Press.
Deyo, R., Cherkin, D. and Ciol, M. (1992). “Adapting a clinical comorbidity index for use with ICD-9-CM administrative databases”. Journal of Clinical Epidemiology, vol. 45, pp. 613-619.
Gentry, W. and Penrod, J. (2000), “The Tax Benefits of Not-for-Profit Hospitals”, in Cutler, D. (Ed.), The Changing Hospital Industry: Comparing Not-for-Profit and For-Profit Institutions, Chicago: University of Chicago Press.
Ghali, W., Hall, R., Rosen, A., Ash, A. and Moskowitz, M. (1996). “Searching for an improved clinical comorbidity index for use with ICD-9-CM administrative data”. Journal of Clinical Epidemiology, vol. 49, pp. 273-278.
Gray, B. (2000), “Comments on Chapters 5 and 6”, in Cutler, D. (Ed.), The Changing Hospital Industry: Comparing Not-for-Profit and For-Profit Institutions, Chicago: University of Chicago Press.
Gregory, R. and Borland, J. (1999). “Recent Developments in Public Sector Labor Markets”, in Ashenfelter, O. and Card, D. (Eds.), Handbook of Labor Economics Volume 3C. Amsterdam: Elsevier.
Hamilton, B. and Hamilton, V. (1997). “Estimating surgical volume-outcome relationships applying survival models: accounting for frailty and hospital fixed effects”. Health Economics, vol. 6, pp. 383-395.
Haskel, J. and Sanchis, A. (1995). “Privatisation and X-Inefficiency: A Bargaining Approach”. Journal of Industrial Economics, vol. 43, pp. 301-322.
Hollingsworth, B. (2003). "Non-Parametric and Parametric Applications Measuring Efficiency in Health Care". Health Care Management Science, vol. 6, pp. 203-218.
Hoxby, C. (2000). “Does Competition Amongst Schools Benefit Students and Taxpayers?”. American Economic Review, vol. 90, pp. 1209-1238.
Lamo, A., Pérez, J., and Schuknecht, J. (2007). "The cyclicality of consumption, wages and employment of the public sector in the euro area". European Central Bank, Working Paper Series 757.
Laffont, J.-J. and Tirole, J. (1993). A Theory of Incentives in Procurement and Regulation. Cambridge, MA: The MIT Press
Laver, M. and Hunt, B. (1992). Party and Policy Competition. London: Routledge.
Laver, M., Benoit, K. and Sauger, N. (2006). “Policy competition in the 2002 French legislative and presidential elections”, European Journal of Political Research, vol. 45, pp. 667-697. Le Grand, J. (2007). The Other Invisible Hand. Princeton and Oxford: Princeton University
Press.
Leleu, H. and Dervaux, B. (1997). “Comparaison des différentes mesures d’efficacité technique : une application aux Centres Hospitaliers français”. Economie et Prévision, vol. 129-130, pp.101-119.
Levitt, S. (1997). “Using Electoral Cycles in Police Hiring to Estimate the Effect of Police on Crime”. American Economic Review, vol. 87, pp. 270-90.
Leibenstein, H. (1969). “Organizational or Frictional Equilibria, X-Efficiency and the Rate of Innovation”. Quarterly Journal of Economics, vol. 83, pp. 600-623.
Luechinger, S., Meier, S., and Stutzer, A. (2007). "Why Does Unemployment Hurt the Employed? Evidence from the Life Satisfaction Gap between the Public and the Private Sector". University of Zurich, Mimeo.
Melly, B. and Puhani, P. (2006). “Privatization and changes in the wage structure”. Leibniz Universität Hannover, mimeo.
OECD. (1997). “Economic Performance and the Structure of Collective Bargaining”. OECD Employment Outlook.
Öster, A., and Agell, J. (2007). “Crime and Unemployment in Turbulent Times”. Journal of the European Economic Association, vol. 5, pp. 752-775.
Rothstein, J. (2007). "Does Competition Among Public Schools Benefit Students and Taxpayers? Comment". American Economic Review, 97, 2026-2037.
Shleifer, A. and Vishny, R. (2002). The Grabbing Hand. Boston, MA: Harvard University Press. Sloan, F., Taylor, D. and Conover, C. (2000), “Hospital Conversions: Is the Purchase Price Too Low?”, in Cutler, D. (Ed.), The Changing Hospital Industry: Comparing Not-for-Profit and For-Profit Institutions, Chicago: University of Chicago Press.
Worthington, A. (2004). “Frontier Efficiency Measurement in Health Care: A Review of Empirical Techniques and Selected Applications”. Medical Care Research and Review, vol. 61, pp. 1-36.