HAL Id: hal-02279352
https://hal.archives-ouvertes.fr/hal-02279352
Preprint submitted on 5 Sep 2019
HAL is a multi-disciplinary open access
archive for the deposit and dissemination of
sci-entific research documents, whether they are
pub-L’archive ouverte pluridisciplinaire HAL, est
destinée au dépôt et à la diffusion de documents
scientifiques de niveau recherche, publiés ou non,
To cite this version:
Mohammed Lamine Benomar, Amine Chikh, Xavier Descombes, Mourtada Benazzouz. Multi Features
Based Approach for White Blood Cells Segmentation and Classification in Peripheral Blood and Bone
Marrow Images. 2019. �hal-02279352�
Multi Features Based Approach for White Blood Cells
Segmentation and Classification in Peripheral Blood
and Bone Marrow Images
Mohammed Lamine Benomar*, Amine Chikh*, Xavier Descombes** and Mourtada Benazzouz*
*Computer Science Department, Abou-Bekr Belkaid University, Genie Biomedical Laboratory, Tlemcen, Algeria
E-mail : [email protected] E-mail : [email protected] E-mail : [email protected] **Côte d‟Azur University,
French Institute for Research in Computer Science and Automation (INRIA), Laboratoire d‟Informatique, Signaux et Systèmes de Sophia Antipolis (I3S), Nice, France
E-mail : [email protected]
Abstract: This paper proposes a complete automated analysis system for white
blood cells differential count in peripheral blood and bone marrow images in order to reduce the time and increase the accuracy of several blood disorders diagnosis. A new color transformation is proposed to highlight the white blood cells regions then a marker controlled watershed algorithm is used to segment the region we are interested in by introducing this transformation. The nucleus and cytoplasm are subsequently separated. In the identification step a set of color, texture and morphological features are extracted from both nucleus and cytoplasm regions. Next, the performances of the random forest classifier on a set of microscopic images are compared and evaluated. The provided results reveal high recognition accuracies for both segmentation and classification stage.
Keywords: white blood cells; cells segmentation; cells classification; color
transformation; texture features; morphological features, peripheral blood images; bone marrow images.
1 Introduction
The diagnosis of several blood disorders such as Leukemia and Myeloma, through the analysis of WBCs or Leukocytes, depends on the correct recognition of cells.For that,computer analysis image system is required to automate the process in order to help experts, to reduce the time and increase the accuracy.The main important steps in such systems are segmentation and classification of white blood cells. In this paper, we present a method to identify and classify a set of peripheral blood and bone marrow WBCs that includes basophil, neutrophil, eosophil, monocyte, lymphocyte and plasma cells.
In many researches, cell segmentation is the most challenging step and there are not standard techniques for each domain. Usually peripheral blood and bone marrow images consist of white blood cells, red blood cells (RBCs), platelets and plasma. Figure1 shows two images where the most represented cells are RBCs and WBCs. Our proposed method to identify WBCs exploits color and texture information to segment the nucleus and cytoplasm regions then the results will be used to classify their types.
Figure1. Example of peripheral blood and bone marrow images (some WBCs are outlined with
white contour and RBCs with red).
2 Related work
In the literature, there exists various methods for segmenting WBCs in order to facilitate the classification in peripheral blood and bone marrow images. To this end, there are mainly two approaches. In the first approach the white blood cells nucleus are identified and then adequate features are extracted to classify cells. Theera-Umpon and Dhompongsa(2007) propose a differential WBCs count framework in bone marrow images and show that nucleus alone can be used to classify cells, since its segmentation is much easier than the entire cell. Leukocyte cell nucleus enhancer using RGB and HSV property to segment nucleus region is proposed in (Huang and Hung, 2012). Madhloom et al. (2010) work focus on five types of white blood cells nucleus segmentation using a combination of contrast stretching and image arithmetic operation.
In the second approach, the idea is to segment the entire white blood cells individually and then to separate nucleus from cytoplasm in the second step. Recently, Arslanet al. (2014) implement white blood cells segmentation in peripheral blood and bone marrow images based on color and shape transformation. They transformed RGB image to a new intensity map based on its green and blue bands to make the pixels of WBCs more distinguishable. Putzu and Di-Ruberto(2013) use color transformation (RGB to CMYK) as WBCs are more contrasted in the Y component, followed by a redistribution of image gray levels by contrast stretching or histogram equalization in order to make the process easier. A system to locate WBCs in microscopic blood smear is proposed in (Prinyakupt and Pluempitiwiriyawej, 2015). The concept of the segmentation is based on morphological properties of the real cells. They extracted 15 features from the segmented nucleus and cytoplasm regions to classify five types of leukocytes using linear and naïve Bayes classifiers. Chu et al. (2015) introduce a method inspired by cosegmentation to delineate the entire WBCs contour. Color transformation and thresholding are employed to obtain a reference subimage. Madhloom et al. (2012) integrate color features with morphological operations to localize WBCs in peripheral blood images and extract each individual cell separately in a subimage. In a continuation of their experiments, Madhloom et al. (2013) develop a computerized recognition system
of normal and abnormal lymphocytes cells based on shape and texture features extraction, selection and cell classification. Rezatofighi and Soltanian-Zadeh (2011) propose a system to classify five major groups of white blood cells (eosinophil, basophil, monocyte, lymphocyte and neutrophil). A texture approach to WBCs recognition was presented by (Sabino et al., 2004). Ramoser et al. (2005) employ color transformation and K-means clustering for WBCs segmentation.
In previous work, we have identified plasma cell in bone marrow images algorithm in two phases. Firstly, nucleus extraction is performed by Otsu thresholding from green channel, then a region growing with circularity criterion delimitates the cytoplasms. Features extraction and cells classification is presented in (Benazzouz et al., 2015). Segmentation scheme using pixel classification based on the fusion of information and evidential algorithm to segment blood cell images is reported in (Benazzouz et al.,2013; Baghli et al., 2014; Benazzouzet al.,2016).
The previous studies based on segmentation of nucleus regions alone are limited when considering the identification of cells types, since the cytoplasm is essential for the classification of several white blood cells kinds. Moreover, the published methods show that the cells segmentation and features extraction are the most important steps. In this paper, we present the different steps of a differential white blood cells counting system based on a new color transformation, texture and shape properties leading to more fast and accurate results.
3 Proposed method
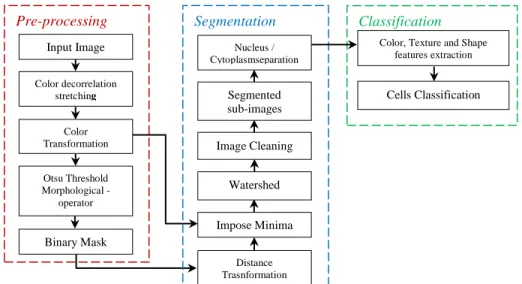
In this paper, we propose to locate the entire WBCs in peripheral blood and bone marrow microscopic smear in three main steps: pre-processing, segmentation and classification as shown in Figure 2. The main properties used by the white blood cells segmentation and classification algorithm are color, texture and morphological.The first step reveals chromatic characteristics of the WBCs by applying decorrelation stretch to multichannel RGB image. Then a simple color transformation and Otsu thresholding suppresses background and most of the red blood cells. In the segmentation step, two techniques have been used which are Marker Controlled Watershed based on the color transformation and distance maps, to separate grouped WBCs, followed by animage cleaning stepto differentiate between WBCs, false positives and artifacts using shape, color and texture features.Then the nucleus and cytoplasm separation is based on both green and a* bands of the RGB and L*a*b color system. The result consists of a binary subimage showing the individual WBCs. Finally, white blood cells were classified into categories, this phase is based on features extraction followed by a classifier.
The rest of this paper is organized as follows. In this section “Proposed Method” we detail each step of the proposed method. In section “Results” we describe the implementation and we discuss results. Finally, in section “Conclusions” we conclude the paper and present some possible future works.
3.1 Pre-processing
Since that peripheral blood and bone marrow images captured at the microscope are all in RGB color space (Figure 1), it becomes necessary to exploit these characteristics consistently to several works which conclude that reducing images into grayscale yields
poor segmentation results (Arslan et al., 2014; Benazzouz et al., 2013;Putzu and Di-Ruberto, 2013). However, the microscopic images suffer from uneven lighting and staining during acquisition process. Therefore, a pre-processing step is necessary in order to derive a robust and consistent segmentation for a large image dataset. The pre-processing is twofold.
A. Color decorrelation stretching
The nucleus regions are more contrasted than other components as shown in Figure 1. Moreover, the nucleus regions have lower value in the green channel compared with other regions and often the cytoplasm color is indistinguishable from adjacent RBCs as shown in Figure 3. Therefore, decorrelation stretching is necessary in order to enhance the color differences in peripheral blood and bone marrow images. Decorrelation stretching method was introduced by (Soha and Schwartz, 1978), based on a principal component (PC) transformation of the acquired image (Gonzales and Wintz, 1977).
The results of applying decorrelation stretching on RGB image are shown on Figure 3(b). The pixels of white blood cells are more distinguishable and the WBCs can be easily segmented from the images.
Figure 2.Block diagram of the proposed cells identification system
B.Color transformation
After Decorrelation stretching, as shown in Figure 3(b), the red blood cells (RBCs) regions have a greater value in the green channel than nucleus and cytoplasm regions. Moreover, the red and blue bands show the WBCs regions as the brightest objects in the image (Figure 4). Therefore, we propose to enhance the WBC regions in the image by adding the pixel values in the red and blue bands and then subtract the green band value. Let I be the decorrelation stretch image. The 𝐼𝑅, 𝐼𝐺 and𝐼𝐵 𝑑enote the red, green and blue bands, respectively, in RGB color space of the latter image. The enhanced 𝐼𝐸can be denoted for every pixel 𝑥, 𝑦 as:
Classification Pre-processing Segmentation Input Image Color decorrelation stretching Color Transformation Otsu Threshold Morphological -operator Binary Mask Distance Trasnformation Impose Minima Watershed Image Cleaning
Color, Texture and Shape features extraction Cells Classification Nucleus / Cytoplasmseparation Segmented sub-images
𝐼𝐸 𝑥, 𝑦 =
𝑇(𝑥, 𝑦), 𝑇(𝑥, 𝑦) > 0
0, 𝑜𝑡ℎ𝑒𝑟𝑤𝑖𝑠𝑒 (1) Where:
𝑇 𝑥, 𝑦 = 𝐼𝑅 𝑥, 𝑦 + 𝐼𝐵 𝑥, 𝑦 − 𝐼𝐺 𝑥, 𝑦
(a) Original (b) Decorrelation stretching
Figure 3. Distribution of RGB pixel values before (a) and after (b) decorrelation stretch.
(a) (b) (c)
Figure 4.Result of decorrelation stretching: (a) Red band, (b) Green band, (C) Blue band
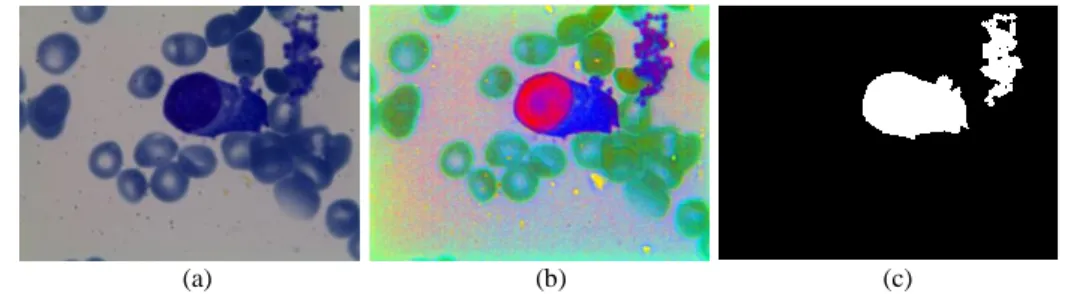
Figure 5(a) show the new intensity map via the transformation(𝐼𝐸). We use Otsu threshold method (Otsu, 1979) to obtain the binary mask containing white blood cells regions as shown in Figure 5(b). To refine the cell boundaries and remove the small artifacts in the background, we apply morphological operators (dilatation, erosion) as it can be seen in Figure 5 (c). Nevertheless, the mask obtained may contain some false positives cells (that are not WBCs) or damaged red blood cells as shown in Figure 6, these noises can be filtered using color, shape and texture features in the next segmentation step.
(a) (b) (c)
Figure 5. Color transformation (a) New Intensity map, (b) Thresholding process, (c) refined binary
mask.
(a) (b) (c)
Figure 6. Example of misfiled image (a) Input image, (b) Decorrelation stretching, (c) refined
binary mask.
3.2 Segmentation
The input image in the segmentation step is the binary mask. It can contain single or connected white blood cells. To separate adjacent cells the segmentation process is divided into two parts. In the first part we consider the marker controlled watershed algorithm (Lindblad, 2002) which uses the distance and the new intensity (IE) maps to delineate cells boundaries (Arslan, 2014). Then, image cleaning is applies to remove all the false positives cells by using the color, shape and texture features of the WBCs. A.Marker controlled watershed
Watershed segmentation is a mathematical method based on the theory of topology for morphological segmentation (Beucher,1982). The main drawback of this method is the over segmentation, to improve the performance of watershed segmentation, marker-controlled watershed transformations have been proposed by combining the shape and intensity maps (Arslan et al.,2014).
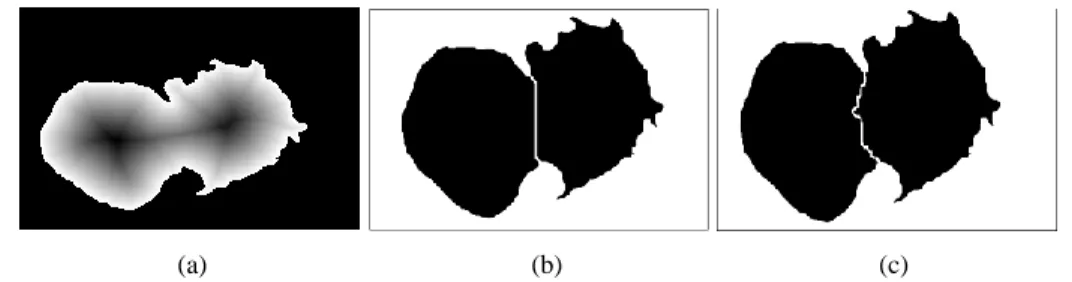
Firstly, we transform the binary mask into a distance map by inner distance transformation using the Euclidean metric from every region pixel to the border, and then we identify the markers from which flooding starts by applying H-minima transform as shown in Figure 7(a). At this stage, applying marker-controlled watershed, provide us inaccurate separation between adjacent WBCs (Figure 7b). For this reason, it is necessary to refine the contours extracted. Therefore, we define a new marking function that combines the color and shape characteristics of WBCs (Arslan et al., 2014). Let D be the
distance transform and IE be the new intensity map. We define the marking function F for every pixel 𝑥, 𝑦 as follows:
𝐹 𝑥, 𝑦 = 𝐷 𝑥, 𝑦 . 𝐼𝐸 𝑥, 𝑦 (2) By exploiting this new marking function in watershed flooding process we obtain more natural contour of white blood cells, as we can see in Figure 7(c).
(a) (b) (c)
Figure 7. Distance map (a), Watershed results with the original distance map (b) and the new
marking function (c).
B. Image cleaning
The extracted WBCs mask by marker-controlled watershed step contains all the white blood cells and sometimes other abnormal components or red blood cells that show similar color characteristics with WBCs (see Figure 6). Therefore, image cleaning is an important stage to remove false positives cells and avoid errors in the classification process. To achieve this goal we consider texture and shape properties of the segmented WBCs. Thus, we calculate descriptors for each connected component in the cells binary mask, which are: Area, Roundness, Mean intensity and Variance. To eliminate the abnormal components, we employ random forest classification algorithm (Breiman, 2001). Thus, the WBCs can be extracted and the noise objects are eliminated.
C. Nucleus and cytoplasm separation
The goal of this stage is to divide the WBC to its basic components which are nucleus and cytoplasm. Before that, we cut out subimages (bounding box) containing only single WBC from the cleaned image (Figure 8) in order to avoid problems due to signal heterogeneity among different cells.
In Peripheral blood and bone marrow images the nucleus regions are more contrasted in the green channel of the RGB color space (Cseke,1992;Sabino, 2004). However, a simple Otsu threshold in this color band provide inaccurate nucleus regions, since there are granules in the cytoplasm region selected erroneously as part of the nucleus (Putzu, 2013). Moreover, the nucleus regions are more distinguishable in the a* channel of the L*a*b color system. Thus, we make use of these properties by combining the binary image of both green and a* bands threshold. Combining these two color bands yield more accurate nucleus regions. Once the nucleus binary subimage have been created, to obtain the cytoplasm regions we perform a subtraction between the entire cell and nucleus binary subimages.
3.3 Classification
In practice the expert uses visual white blood cells characteristics to identify the cell type such as nucleus and cytoplasm shape, texture, andcolor. We automatically quantify these properties to classify the major types of WBCs: basophil, neutrophil, eosinophil, monocyte, lymphocyte and plasma cell (LaFleur-Brooks, 2008; Sun, 2009). To this end, morphological, color and texture features are computed from the segmented nucleus and cytoplasm regions and used in a random forest classification (Breiman, 2001) to identify the cells types.
A. Morphological features
To obtain a robust classification, we extract morphological features based on the biological aspects of WBC subtype. These features include nucleus and the whole cell area and perimeter, since the monocyte and plasma cell size is high compared with basophil, neutrophil and eosinophil which have intermediate size, whereas, the lymphocyte size is very low. We use the ratio between nucleus and cytoplasm areas, this ratio is very high for lymphocyte and allows to differentiate it from the other WBCs kinds since the nucleus occupies the major cell area. In addition, roundness, solidity and extent of nucleus and cell body are used. To these features are added two specific measures, the number of nucleus concavities and nucleus connected components. Hence, if there are multiple nucleus regions in the same cell the respective features are averaged. B.Color and texture features
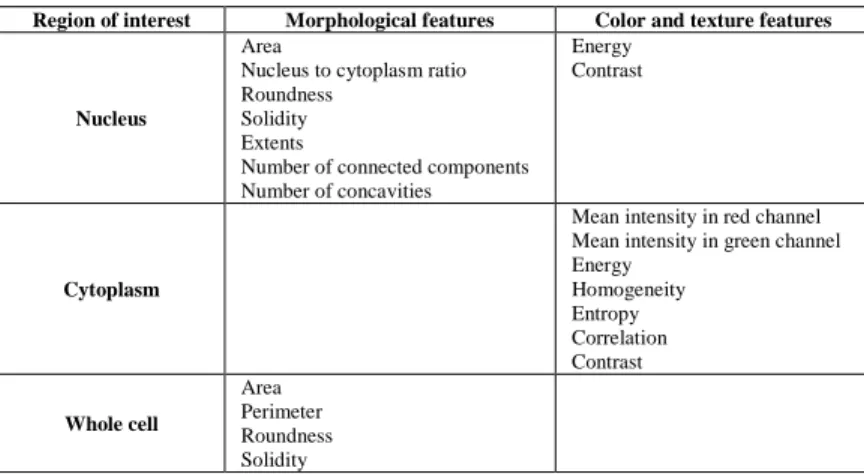
In addition to the morphological features, we also take into account color and texture information, since neutrophil, basophil and eosinophil contain granules, called granulocytes, and the other cells are smooth called agranulocytes (Putzu, 2013). Table1 illustrate the total employed features and the corresponding region of interest.
4 Results
The proposed method was tested on a set of 87 color images containing 155 WBCs, obtained from marrow and peripheral blood smears dyed by MGG (May-Grunwald Giemsa) staining method in the Hemobiology department of Tlemcen Hospital, Algeria. The images were taken on a Leica microscope with 100x magnification achromatic lens and recorded by a digital camera with a 1024x768 pixels resolution. The white blood
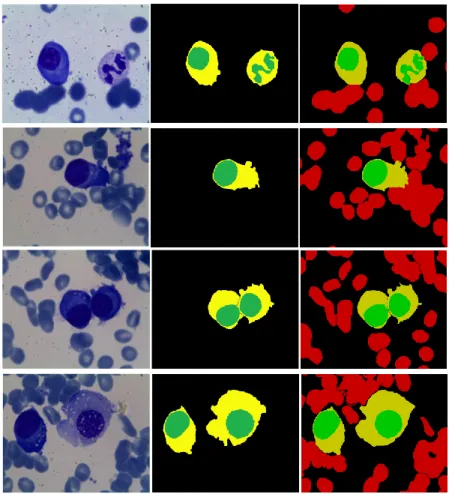
cells have been classified by an expert to evaluate the segmentation and identification results, thus, each microscopic image has an associated ground truth image where nucleus, cytoplasm, background and red blood cells regions are clearly separated and colored with green, yellow, black and red respectively (see Figure 9).
Region of interest Morphological features Color and texture features
Nucleus
Area
Nucleus to cytoplasm ratio Roundness
Solidity Extents
Number of connected components Number of concavities
Energy Contrast
Cytoplasm
Mean intensity in red channel Mean intensity in green channel Energy Homogeneity Entropy Correlation Contrast Whole cell Area Perimeter Roundness Solidity
Table 1. Features extracted for cells classification.
A. Segmentation results
To evaluate our proposed method we use both visual and quantitative measurements. Figure 9 shows samples segmentation results. The performances of the proposed method are excellent in most cases, since the background and the red blood cells surrounding the WBCs are completely removed from the image in the preprocessing stage, in fact the adjacency between cells increases the difficulty in many previous researches. Moreover, the damaged cells and the false positive objects are cleaned from the binary mask before the identification stage. In the same way, the non-entire cells located on the edge of the images affect the segmentation accuracy.We eliminate 10 non-entire cells, located on the image border.
For a quantitative evaluation, we compare the performance of our experiments to the methods mentioned in the related work on the same images dataset (Benazzouz, 2013; 2015;2016). As shown in Table2, an average accuracy of 96.87% and 92.50% was obtained for nucleus and cytoplasm segmentation, respectively. Therefore, the proposed method achieved better results than (Benazzouz, 2013; 2015; 2016) especially in cytoplasm regions. Indeed, our segmentation extract the cytoplasm regions precisely even when the shape boundaries are irregular. We can note that the circularity criterion that prevents the deformation of the region growing in (Benazzouz, 2015)and the misclassification between red blood cells and some cytoplasm regions in (Benazzouz, 2013; 2016)affect the segmentation accuracy.
Rate (%) Accuracy (%)
Nucleus Cytoplasm Nucleus Cytoplasm
Benazzouz et al., (2013) 94.63 90.25 95.02 84.53
Benazzouz et al., (2016) 93.53 90.04 96.42 50.77
Benazzouz et al., (2015) 98.73 94.04 96.67 91.44
Proposed method 98.81 95.24 96.87 92.50
Table 2. Quantitative comparison in terms of segmented regions.
Figure 9. Segmentation samples. First column demonstrate the original images, second are
segmentation results, and third are ground truth images.
B.Classification results
The proposed method classifies the white blood cells into seven types (Lymphocyte, monocyte, eosinophil, neutrophil, basophil, plasma cell including normal and dystrophic cells (LaFleur-Brooks, 2008; Sun, 2009) with a set of 20 extracted features to represent the WBCs (see Table 1). The classification is performed using the random forest algorithm that requires as inputs the number of trees forming the forest. After multiple tests we opt for the typical value of 100 trees. Also, the segmentation stage extracts properly 145 subimages containing individual WBCs from the image dataset. The
learning was done on 92 cells images and 53 were used for testing. For the purpose of evaluation we calculate the class accuracy and the overall accuracy from the confusion matrix.
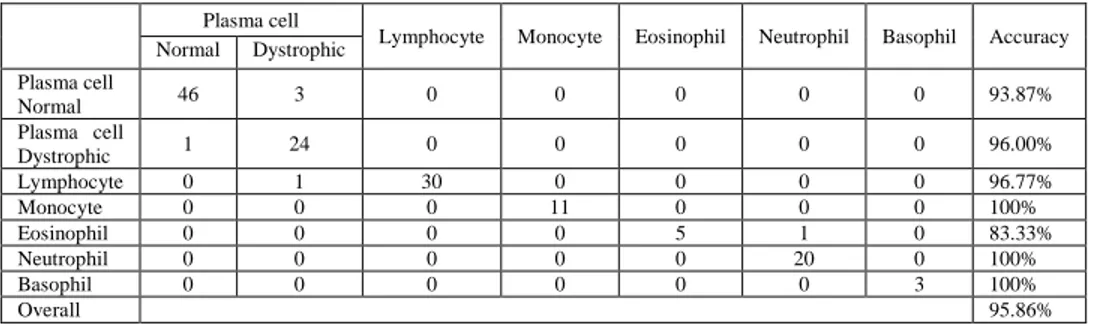
As shown in Table 3. We obtain an overall accuracy of 95.86% and a robust recognition of the majority classes. However, we observe some misclassification of eosinophil into neutrophil since the eosinophil and neutrophil nucleus have similar shape.
Plasma cell
Lymphocyte Monocyte Eosinophil Neutrophil Basophil Accuracy Normal Dystrophic Plasma cell Normal 46 3 0 0 0 0 0 93.87% Plasma cell Dystrophic 1 24 0 0 0 0 0 96.00% Lymphocyte 0 1 30 0 0 0 0 96.77% Monocyte 0 0 0 11 0 0 0 100% Eosinophil 0 0 0 0 5 1 0 83.33% Neutrophil 0 0 0 0 0 20 0 100% Basophil 0 0 0 0 0 0 3 100% Overall 95.86%
Table 3.Confusion matrix, accuracy and overall accuracy.
We consider the current classification method as an improvement with the respect to the method described earlier by Benazzouz et al.(2015) where the authors separate white blood cells into two classes in order to diagnose Myeloma pathology. The first class contains plasma cells including normal and dystrophic cells, and the second class contains other white blood cells types. The obtained plasma cells accuracy was 75.25% due to the misclassification of most dystrophic plasma cells into other cells type. However, the proposed classification method provides an important improvement with an accuracy of 93.87% and 96.00% for normal and dystrophic plasma cells respectively (see Table 3). The main reason is that our classification algorithm employs morphological cells features in addition to the color and texture features, since the segmentation stage is able to find the cells boundaries precisely. Nevertheless, it should be noted that some misclassification between normal and dystrophic plasma cells can be attributed to similar cells shape when even the human expert hardly recognizes the difference.
5 Conclusions
In this paper we have proposed an automatic differential white blood cells count system to assist expert in medical diagnosis. The proposed system segments the WBCs nucleus and cytoplasm and then identifies the cells types by using color, texture and shape properties. The experiments show good results in both segmentation and classification stage, considering the cells difference and the complex scenes, with an overall accuracy of 95.86%. These results shows that the white blood cells identification depend on both thenucleus and cytoplasm segmentation and the choice of discriminative characteristics. This approach could be generalized to a greater number of cells types by introducing new discriminative features.
References
Arslan, S., Ozyurek, E., Gunduz-Demir, C., (2014), „A Color and Shape Based Algorithm for Segmentation of White Blood Cells in Peripheral Blood and Bone Marrow Images‟, Journal of the International Society for Advancement of Cytometry, Vol 85No.6, pp.480–490.
Baghli, I., Nakib, A., Sellam, E., Benazzouz, M., Chikh, A., Petit, E., (2014), „Hybrid framework based on evidence theory for blood cell image segmentation‟, Proceeding of SPIE Medical Imaging 2014 Biomedical applications in Molecular, Structural, and Functional Imaging, Vol 9038. DOI: 10.1117/12.2042142.
Beucher, S., (1982), „Watersheds of functions and picture segmentation‟, IEEE International Conference on Acoustics, Speech, and Signal Processing, DOI: 10.1109/ICASSP.1982.1171424. Benazzouz, M., Baghli, I., Benomar, A., Ammar, M., Benmouna, Y.,Chikh, M.A., (2016), „Evidential Segmentation Scheme of Bone Marrow Images‟, Advanced in Image and Video Processing Journal, Vol 4 No.1,
http://scholarpublishing.org/index.php/AIVP/article/view/1924
Benazzouz, M., Baghli, I., Benomar, A., Benmouna, Y., Ammar, M., (2015), „Automated Identification of Plasma cell in Bone Marrow images‟,
https://hal.archives-ouvertes.fr/hal-01466770
Benazzouz, M., Baghli, I.,Chikh, M.A., (2013), „Microscopic Image Segmentation Based on Pixel Classification and Dimensionality Reduction‟, International Journal of Imaging Systems and Technology, Vol 23 No.1, pp.22-28.
Breiman, L., (2001), „Random Forests‟, Machine Learning, Vol 45 No.1, pp.5–32. Berkley Statistics, Random Forests (version 2004). [online]
https://www.stat.berkeley.edu/~breiman/RandomForests/cc_home.htm
Chu, R., Zeng, X., Han, L. Wang, M., „Subimage Cosegmentation in a Single White Blood Cell Image‟ in IEEE 2015 : Computational Intelligence, Communication Systems and Networks International Conference, DOI: 10.1109/CICSyN.2015.36.
Cseke, I., (1992), „A Fast Segmentation Scheme for White Blood Cell Images‟, Proceedings of the IAPR International conference, IEEE, Pattern Recognition, DOI: 10.1109/ICPR.1992.202041. Gillespie, A.R., Kahle, A.B., Walker, R.E., (1986), „Color Enhancement of Highly Correlated Images. I. Decorrelation and HSI Contrast Stretches‟, Remote Sensing of Environment, Vol 20, pp.209-235.
Gonzales, R.C., Wintz, P., (1977), Digital Image Processing, Addison-Wesley, Reading, MA, pp.103-112 and 309-317.
Haralick, R.M., Shanmugam, K., Dinstein, I., (1973), „Textural Features for Image Classification‟, IEEE Transactions on Systems, Man and Cybernetics, Vol SMC-3 No.6, pp.610-621.
Huang, D.C., Hung, K.D., (2012), „Leukocyte Nucleus Segmentation and Recognition in Color Blood-smear Images‟ in I2MTC 2012: The Instrumentation and Measurement Technology Conference, IEEE international.
LaFleur-Brooks, M.,(2008), Exploring Medical Language: A Student Directed Approach, 7th ed., St. Louis, Missouri, US: Mosby Elsevier.
Lindblad, J., (2002), Development of Algorithms for Digital Image Cytometry, Comprehensive Summaries of Uppsala Dissertations from the Faculty of Science and Technology 789,Uppsala University, Sweden.ISBN 91-554-5497-6.
Madhloom, H.T., Kareem, S.A.,Ariffin, H., (2013), „A robust Extraction and selection Method for the Recognition of Lymphocytes versus Acute Lymphoblastic Leukemia‟, Proceeding IEEE 2013, International Conference on Advanced Computer Science Application and Technologies, Vol 36 No.4, pp.2149-2158.
Madhloom, H.T., Kareem, S.A.,Ariffin, H., (2012), „An Image Processing Application for the Localization and Segmentation of Lymphoblast Cell Using Peripheral Blood Images‟, Journal of Medical Systems, Vol 36 No.4, pp.2149-2158.
Madhloom, H.T., Kareem, S.A., Ariffin, H., Zaidan, A.A., Alanazi, H.O.,Zaidan, B.B., (2010), „An Automated White Blood Cell Nucleus Localization and Segmentation using image Arithmetic and Automatic Threshold‟, Journal of Applied Sciences, Vol 10 No.11, pp.959-966.
Otsu, N., (1979), „A Threshold Selection Method from Gray-Level Histograms‟, IEEE Transactions on Systems, Man, and Cybernetics, Vol. 9, No. 1, pp.62-66.
Prinyakupt, J., &Pluempitiwiriyawej, C. (2015).Segmentation of white blood cells and comparison of cell morphology by linear and naïve Bayes classifiers.BioMedical Engineering OnLine, 14, 63.http://doi.org/10.1186/s12938-015-0037-1
Putzu, L., Di Ruberto, C., (2013), „White Blood Cells identification and Counting from Microscopic blood Image‟, International Journal of Medical, Health, Biomedical, Bioengineering and Pharmaceutical Engineering, Vol 07 No.1.
Ramoser, H., Laurain, V., Bischoft, H., Ecker, R., (2005), „Leukocyte segmentation and classification in blood-smear images‟, Proceedings of the 2005 IEEE Engineering in Medicine and Biology 27th Conference.
Rezatofighi, S.H., Soltanian-Zadeh, H., (2011), „Automatic recognition of five types of white blood cells in peripheral blood‟, Journal of Computerized Medical Imaging and Graphics, Vol 35 No.4, pp.333-343.
Sabino, D.M.U., Costa, L.F., Rizzatti, E.G., Zago, M.A., (2004), „A texture approach to leukocyte recognition‟, Real-Time Imaging Journal, Vol 10, No.4, pp.205-216.
Soha, J.M., Schwartz, A.A., (1978), „Multispectral histogram normalization contrast enhancement‟, Proceeding of the 5th Canadian Symposium on Remote Sens., Victoria, BC, Canada, pp.86-93. Sun, T., (2009), Atlas of Hematologic Neoplasms, 1st ed., Springer US.
Theera-Umpon, N., Dhompongsa, S., (2007), „Morphological Granulometric Features of Nucleus in Automatic Bone Marrow White Blood Cell Classification‟, IEEE Transactions on Information Technology in Biomedicine, Vol 11, No.3.