HAL Id: hal-00559422
https://hal.archives-ouvertes.fr/hal-00559422
Preprint submitted on 25 Jan 2011
HAL is a multi-disciplinary open access
archive for the deposit and dissemination of
sci-entific research documents, whether they are
pub-lished or not. The documents may come from
teaching and research institutions in France or
abroad, or from public or private research centers.
L’archive ouverte pluridisciplinaire HAL, est
destinée au dépôt et à la diffusion de documents
scientifiques de niveau recherche, publiés ou non,
émanant des établissements d’enseignement et de
recherche français ou étrangers, des laboratoires
publics ou privés.
traps and color centers related to the radiation-induced
optical losses
Franck Mady, Mourad Benabdesselam, Yasmine Mebrouk, Bernard Dussardier
To cite this version:
Franck Mady, Mourad Benabdesselam, Yasmine Mebrouk, Bernard Dussardier. Radiation effects in
ytterbium-doped silica optical fibers: traps and color centers related to the radiation-induced optical
losses. 2010. �hal-00559422�
Abstract—Radiation effects in ytterbium-doped silica optical fibers are still poorly studied despite their importance in space-based applications as optical inter-satellite links. We investigate such effects by coupling thermally stimulated luminescence and optical absorption measurements. Connections between traps populated by X ray irradiations and the radiation-induced optical absorption (RIOA) are established. The color centers responsible for RIOA are proved to correspond to reduced forms of defects related to dopants. Holes released upon reduction processes are shown to be trapped on defects of the silica matrix.
Index Terms— Optical communications, Radiation effects,
Thermally Stimulated Luminescence, Ytterbium-doped silica optical fibers.
I. INTRODUCTION
HE radiation-induced degradation of rare-earth-doped fiber amplifiers or lasers has become a crucial concern for the space industry. Radiation effects on erbium (Er)-doped fibers (EDF) has been quite widely investigated for about 10 years (see e.g. [1],[2]) because EDF amplifiers constitute the standard technology for optical communications at 1550 nm. By comparison, the radiation resistance of ytterbium-doped fibers (YDF) is still much less explored (see e.g. [3]), although YDF provide a solution of choice to make the high output power fiber lasers required for optical inter-satellite links (OISL). Considering the poor attention paid so far in the study of radiation effects on YDF, this work focuses on this problem. The original techniques and procedures we present could be followed for Er-doped fibers.
The performances of irradiated YDF are reduced due to the formation of color centers which absorption bands spread from ultra-violet (UV) to visible and have significant tails overlapping the near-infra-red (NIR) absorption spectrum of Yb3+ ions. This results in excess optical losses, notably at pump and gain wavelengths. Basically, color centers are formed due to the ionization of the valence band or of pre-existing centers associated with band-gap energy levels, as optically active ions, e.g. ytterbium (Yb), defects, dopants....
Manuscript received July 2, 2010.
Authors are with the University of Nice-Sophia Antipolis, Laboratoire de Physique de la Matière Condensée (LPMC), Centre National de la Recherche Scientifique (CNRS), UMR 6622, Nice, France (corresponding author: +33 492 076 330; fax: +33 492 076 754; e-mail: mady@unice.fr).
Since carriers released upon ionization are trapped on other defects, one has still to elucidate whether the color centers correspond to the ionized centers (i.e. reduced or oxidized centers), or on the contrary to populated traps.
In order to advance this basic question, we follow an original approach based on the coupling of thermally stimulated luminescence (TSL) and optical absorption measurements. TSL peaks reveal the trapping levels populated by irradiation. On one hand, some of these traps are found to be connected to the radiation-induced optical absorption (RIOA), because thermal detrapping from these levels is accompanied by RIOA recovery. On the other hand, our experiments demonstrate that populated traps are not the RIOA color centers that correspond to the reduced form of centers related to the core dopants (ytterbium or aluminum). Holes released in the reduction process will be shown to be trapped on intrinsic defects of the silica matrix.
II. MATERIALS AND METHODS
A. Samples
At LPMC, we have a long experience in fabricating silica optical fibres by modified chemical vapour deposition (MCVD) and solution-doping techniques [4]. We therefore have the capacity to fabricate samples on demand, notably to test the radiation response in the presence of each single dopant, e.g. rare-earth or aluminium (Al). This also allows us to follow the defects related to the RIOA from the commercial substrate tube down to the fiber, via the preform stage.
Samples consist of ~4 mm radius and 1-2 mm thick slices of fiber preforms. They have a central doped core (doped MCVD-deposited silica layers) surrounded by the cladding (undoped deposited layers plus substrate tube). Samples with Yb-free aluminosilicate core (referred to as AS), Yb-doped Al-free silicate core (S:Yb), Yb-doped alumino-silicate cores (AS:Yb) and Yb-free germanosilicate core (GS) have been considered, as well as fibers drawn from the AS:Yb preforms.
B. Methods
Samples were irradiated with X rays (45 kV) at ~0.25 krad(SiO2) min-1 in a 30-50 krad dose range. UV radiations
from a deuterium lamp were also used to check sub-gap excitation processes. Then, interferential filters allowed us to tune the photon energy (for instance 5.4 and 4.95 eV).
Radiation effects in ytterbium-doped silica
optical fibers: traps and color centers related to
the radiation-induced optical losses
Franck Mady, Mourad Benabdesselam, Yasmine Mebrouk and Bernard Dussardier
Absorption measurements have been performed with a Varian Cary 500 spectrophotometer. The RIOA is calculated as the difference between the preform core transmission before and after irradiation (not dimensioned). We note RIOA to discriminate between our measurements and the so-called radiation-induced attenuation (RIA) measured in dB/m. TSL measurements have been done with a laboratory-made apparatus which has already given rise to numerous publications (see e.g. [5]). Below we remind the reader of the TSL basics (see e.g. [6] for details).
C. TSL principle and benefits
As already mentioned, irradiation is responsible for electron-hole pair generation and ionization of pre-existing centers. Free electrons or holes released in bands are trapped on defect gap levels. After radiation exposure, one has therefore ionized centers and populated traps. Then, the sample is heated up at constant rate (1 °C s-1). Trapped carriers are progressively released by the thermal stimulation. If a detrapped carrier recombines with an ionized luminescent center of opposite polarity, characteristic photons are emitted. The TSL signal corresponds to these photons, collected by an optical multi-channel analyzer (OMA).
As the temperature increases linearly, carriers are released from traps of increasing depths. Plots of the spectrally-integrated TSL intensity as a function of temperature thus exhibit peaks. In principle, each trapping level gives rise to a single peak (the deeper the trap, the higher the peak temperature). The TSL analysis provides two types of characterizations at once. First, the TSL peak plots reflect the non-luminescent traps populated by the radiation. Second, the characteristic emissions shown by the TSL spectra reveal the luminescent centers that have been ionized. By emptying traps and recombining carriers, the TSL readout resets the radiation effects while pointing out the traps and luminescent centers altered by the radiation. TSL is therefore a powerful method to investigate ionizing dose effects. It is at least as efficient as photo-luminescence-like techniques often used to characterize the formation of luminescent centers [3].
III. TSLFEATURES OF PREFORMS AND FIBERS
The typical TSL peak plots obtained after X irradiation from two AS:Yb preforms and fibers and from the GS preform are shown in Fig. 1. TSL plots have been normalized with respect to their maximum because fiber and preform samples have different shapes and volumes so intensity comparisons are not relevant. At this stage, the existence (or not) of peaks and the position of these peaks are pretty informative.
The AS:Yb preforms of Fig. 1(a) and (b) have been made from different commercial substrate tubes (tubes 1 and 2 respectively) but according to the same drawing process. The silica of tube 2 is known to be of much higher quality than that of tube 1. This was clearly confirmed by TSL measurements. Tube 1 exhibits a large TSL signal similar to that of the preform (Fig. 1(a)), revealing a large amount of defects. The TSL of tube 2 was found to be very weak, close to the noise level (not visible in Fig. 1(b)).
Irradiations and TSL readout normally affect both core and cladding regions of preforms or fibers. In Fig. 1(a), the TSL of the AS:Yb preform from tube 1 is obviously dominated by the signal brought by the poor quality tube which is found again in the preform cladding. We therefore cut a small sample out of the AS:Yb preform core to examine the TSL of this tube-free region. In the corresponding plot of Fig. 1(a), the continuously increasing luminescence above 400°C is not TSL signal. It corresponds to the black body radiation from the resistive sample furnace which increases as T(K)4. TSL signals from other samples combining core and cladding parts were intense so the black body contribution to the total light is not visible. By contrast, the TSL from the core alone was found to be weak, exceeded by the black body radiation above 400 °C. The same problem appeared for the AS:Yb preform from tube 2 in Fig 1(b). Its TSL plot has been cut off at 400°C for clarity.
TSL measurements reveal three complex peaks probably made up of sub-peaks: one in the 100-125°C range (hereafter referred to as peak 1), one around 225-250°C (peak 2), and one between 400 and 450°C (peak 3). This shows that the ionizing radiation populates three distinguishable groups of
0 50 100 150 200 250 300 350 400 450 500 0.0 0.2 0.4 0.6 0.8 1.0 3 2 Preform (core)
Preform (core + cladding)
Tube 1
No
rmali
zed TSL intensity
AS:Yb, from tube 1
Fiber
Black body radiation
(a)
1 0 50 100 150 200 250 300 350 400 450 500 0.0 0.2 0.4 0.6 0.8 1.0 0 50100 150 200 250 300 350 400 450 500 0.0 0.2 0.4 0.6 0.8 1.0 Temperature (°C) N o rm al iz ed T S L i n te n si ty GS, from tube 1Preform (core + cladding)
Temperature (°C)
Normal
ized TSL
intensit
y
AS:Yb, from tube 2
Fiber
(b)
Fig. 1. Spectrally-integrated TLS intensity as a function of temperature for (a) AS:Yb from tube 1, preform and fiber (b) AS:Yb from tube 2, preform and fiber. Inset: TSL plot from a GS preform made from tube 1 exhibiting the same peak groups as AS:Yb samples. Main peaks are numbered in (a).
trapping levels. When peaks 1 and 3 are markedly present in the substrate tube, they are still predominant in the AS:Yb preform and fiber. For the AS:Yb preform from tube 1, peak 2 appears when considering the preform core only. Its intensity is then rather comparable to that of peak 1. Peak 3 may be present in the core, but hidden by the black body emission. Contrary to tube 1, tube 2 has negligible TSL. The TSL signals of Fig. 1(b) are therefore mainly related to the MCVD-deposited silica layers, as for the core sample in Fig. 1(a). The TSL of the AS:Yb preform from tube 2 is very similar to that of the core of the AS:Yb preform from tube 1 (similar peaks 1 and 2, weak TSL signal and >400 °C region altered by the black body radiation). In the absence of the large TSL brought by the tube, the effect of the fiber drawing process is also clear in Fig. 1(b): the fiber TSL peaks exhibit a better resolution than that of the preform and sub-peaks of the complex structure of peaks 1-3 appear partially. It seems that some traps present in the preform have been annealed by the drawing process. Note that Peak 3 is strongly present in the fiber, even if it could not be observed in the preform.
If peak 2 is only observed for MCVD-deposited silica layers, its presence is not due to the core dopants, namely Yb or Al. As seen from the inset of Fig. 1(b), the Yb-free and Al-free GS preform is characterized by the same TSL peaks 1-3 as AS:Yb samples. In fact, the 3 main TSL peaks are observed in tube 1 and all fibers and preforms independently of the presence of Al, Yb or Ge. We therefore conclude that the ionizing radiation populates intrinsic silica matrix defects.
At last, let us mention that irradiation of AS:Yb samples with UV photons at 5.4 and 4.95 eV produce the same TSL peaks and thus populate the same traps as X irradiation, even if relative peaks intensities are modified. This confirms that sub-gap ionization mechanisms are at play. Various experiments allowed us to demonstrate that Yb3+ ions are responsible for this sub-gap absorption, but this point is not discussed in detail in this extended summary.
IV. THE RIOA AND ITS THERMAL RECOVERY
A. Degradation and core darkening
The optical transmission of preform samples were measured before and after irradiation (right before the TSL readout) in order to obtain the RIOA. Fig. 2 displays the RIOA obtained for the AS:Yb preform made from tube 1 after the sample was given a 15 and a 30 krad(SiO2) X ray dose. The measurement
at 15 krad(SiO2) has been made in the core and in the cladding
for comparison. RIOA plots obtained for the AS:Yb preform made from tube 2 have similar shapes, showing a bit more of radiation-induced core absorption in the visible region for the same doses. The core RIOA differs from that of cladding. First, degradation is much more important in the core. Second, radiation-induced absorption bands are cleary specific in the core where they strongly affect the visible and NIR regions. This specific core absorption is precisely responsible for the performance degradation of fiber amplifiers and lasers.
When the dose exceeds ~30 krad(SiO2), the visible part of
the RIOA becomes apparent to the naked eyed because the preform cores darken. The photos shown in Fig. 2 well
illustrate the darkening is specific to the core. The core consists of MCVD-deposited silica layers, just as the surrounding cladding which remains transparent. Darkening is therefore due to the presence of the core dopants, Yb or Al. Actually, photographs of Fig. 2 demonstrate that darkening is obtained either in the Yb-free aluminosilicate (AS) or the Al-free Yb-doped silica (S:Yb) core. Of course, RIOA patterns measured in these cores are different. Nevertheless, they both have significant band-tails in the NIR region and the fact remains that the presence of each single dopant, Yb or Al is able to produce degradation.
B. Thermal recovery
After reading out the TSL of the AS:Yb samples at 1°C s-1 up to 600°C we observe that: (i) further TSL readouts do not provide any TSL signal, unless the sample is re-irradiated, (ii) the optical transmission of the non-irradiated sample cores is totally recovered. This indicates that: (i) a single TSL readout empties all the traps responsible for the 3 main TSL peaks, and (ii) The core recovery follows the trap emptying.
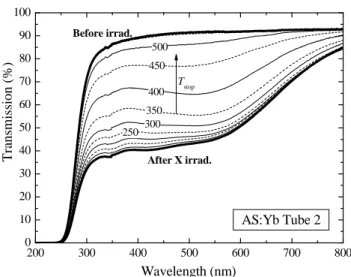
Thermal recovery was examined according to the following procedure: after the optical transmission of the pristine AS:Yb preform core was measured, AS:Yb samples were irradiated with X rays. The transmission of the irradiated core was measured and then the sample was heated up to Tstop = 100 °C
at 1°C s-1. The new core transmission was measured after cooling at room temperature. Then, the sample was heated up to Tstop = 150°C and the new core transmission was measured,
etc… The partial recovery of the core transmission within 50 °C brackets was monitored by considering Tstop = 200,
250,… up to 600°C. Fig. 3 presents the results of this experiment and shows the progressive recovery at the successive Tstop values.
The difference between each couple of consecutive transmission plots gives the recovered transmission within each 50 °C bracket as a function of wavelength. The values
200 300 400 500 600 700 800 0 5 10 15 20 25 S:Yb 15 krad, cladding 30 krad, core 15 krad, core Rad iati on-I nduced O p ti cal A b so rp tion Wavelength (nm) AS:Yb Tube 1 AS cores
Fig. 2. Radiation-induced optical absorption (RIOA) in the core and cladding of the AS:Yb preform sample made from tube 1. The vertical scale gives the difference, in points, between the optical transmission (in %) before and after irradiation. Insets: photographs of the AS and S:Yb preform samples after X irradiation (dose ~50 krad(SiO2)).
obtained for three selected UV, visible and NIR wavelengths (310 or 350, 550 and 800 nm) are plotted in figure 4. They are given in % of the total RIOA at the respective wavelengths.
Two peaks of thermal recovery exist for the core transmission of AS:Yb samples. A main peak located around 450°C and a secondary one at ~250 °C. These recovery peaks are in very good correspondence with TSL peaks 2 and 3 observed for the same samples (Fig. 1). There is strong evidence that detrapping from traps related to the TSL peak #2 and 3 leads to RIOA recovery. By contrast, release from traps associated with the TSL peak at ~100 °C (peak 1) does not induce significant recovery.
V. DISCUSSION
Irradiation populates traps, thus allowing the observation of TSL peaks, and induces RIOA. The TSL readout results in detrapping and perfect recovery of the optical transmission. If the connection of RIOA with populated traps is established, only the traps of TSL peaks 2 and 3 are directly involved in degradation. Our experiments show that populated traps correspond to intrinsic silica defects, present in the core and cladding of alumino-silicate (AS, Yb-doped or not) samples. However, RIOA and darkening require Yb or Al doping since only the core of AS:Yb, AS or S:Yb samples darkens. In addition, the 3 typical traps are also populated by irradiation in the germanosilicate (GS) sample which is not observed to darken, even at high doses. As a consequence, populated traps are not the color centers responsible for the RIOA. The latter therefore correspond to pre-existing centers ionized by irradiation. If each populated trap was a color center with characteristic RIOA bands, thermal annealing of a given band would correspond to detrapping from the associated trap and the location of recovery peaks would be strongly dependent on wavelength. By contrast, recovery plots of Fig. 4 consist of the two same peaks, regardless of the RIOA wavelength, indicating that detrapping from trap groups 2 and 3 contributes similarly to RIOA annealing at any wavelength. As a consequence: (i) RIOA annealing is due to recombination on ionized centers upon carrier detrapping from traps 2 and 3, (ii) traps of TSL peaks 2 and 3 are of the same nature. The TSL spectra, not presented in this summary, show that TSL from AS:Yb samples contain the luminescence of Yb3+ ions. We conclude that Yb3+ ions are altered by radiation to produce Yb2+ ions with related absorption patterns and trapped holes. Thus, we are dealing with hole traps. These traps provide receptor sites for carriers released by ionization. Their presence is therefore a main concern for the radiation resistance of Al- or Yb-doped silica, as that of YDF. The RIOA is due to the creation of Yb- or Al- related centers that cannot be removed. Controlling the presence of the receptor traps is then an important route of YDF radiation hardening. The ability to follow the evolution of traps from the tube to the fiber is then crucial.
REFERENCES
[1] M. Caussanel, O. Gilard, M. Sotom, P. Signoret, and J. Gasiot, “Extrapolation of radiation-induced EDFA gain degradation at space dose rate”, Electron. Lett., vol. 41, pp. 168-170, 2005
[2] S. Girard et al., “ Proton- and gamma-induced effects on erbium-doped
optical fibres”, IEEE Trans. Nucl. Sci., vol. 54, pp. 2426-2434, 2007 [3] B. Tortech et al., “Radiation effects on Yb- and Yb/Er-doped optical
fibres: A micro-luminescence study”, J. Non Cryst. Sol., vol. 355, pp. 1085-1088, 2009
[4] B. Dussardier, W. Blanc, and G. Monnom, “Luminescent ions in silica-based optical fibers”, Fiber and Integr. Opt., vol. 27, pp. 484-504, 2008 [5] M. Benabdesselam, A. Petitfils, F. Wrobel, F. Mady, and J.E. Butler,
“Thermal quenching investigation in CVD diamond by thermally stimulated conductivity and luminescence”, J. Appl. Phys., vol. 103, 114908, 2008
[6] F.Mady, D. Lapraz, and P. Iacconi, “Dimensionless study of the total response of thermally stimulated luminescence”, Rad. Meas., vol. 43, pp 180-184, 2008 200 300 400 500 600 700 800 0 10 20 30 40 50 60 70 80 90 100 500 450 400 250 350 Before irrad. Transmis sion (% ) Wavelength (nm) AS:Yb Tube 2 After X irrad. 300 Tstop
Fig. 3. Optical transmission of the AS:Yb preform sample (from tube 2) as a function of wavelength, before irradiation, after X irradiation and then after heating up the sample from room temperature to the Tstop temperatures
indicated on plots. 0 100 200 300 400 500 600 0 5 10 15 20 25 30 0 100 200 300 400 500 600 0 5 10 15 20 25 30 AS:Yb Tube 2 Temperature (°C) T he rm al re co ve ry (% ) 800 nm 550 nm 350 nm 800 nm 310 nm The rm al re co ve ry (% ) Temperature (°C) AS:Yb Tube 1 550 nm
Fig. 4. Thermal recovery of the core transmission for the AS:Yb preform from tube 1 and tube 2 (inset) at three selected wavelengths as a function of temperature. For clarity, plots are displayed as scatter graphs but rather correspond to histograms. For instance, the ordinate of a point at 400 °C should be understood as the percentage of annealed absorption between 350 and 400 °C at the indicated wavelength.