HAL Id: cea-02145955
https://hal-cea.archives-ouvertes.fr/cea-02145955
Submitted on 3 Jun 2019
HAL is a multi-disciplinary open access
archive for the deposit and dissemination of
sci-entific research documents, whether they are
pub-lished or not. The documents may come from
teaching and research institutions in France or
abroad, or from public or private research centers.
L’archive ouverte pluridisciplinaire HAL, est
destinée au dépôt et à la diffusion de documents
scientifiques de niveau recherche, publiés ou non,
émanant des établissements d’enseignement et de
recherche français ou étrangers, des laboratoires
publics ou privés.
Crystal growth and doping control of HgBa2CuO4+δ,
the model compound for high-T superconductors
A. Legros, B. Loret, A. Forget, P. Bonnaillie, G. Collin, Pierre Thuéry, A.
Sacuto, D. Colson
To cite this version:
A. Legros, B. Loret, A. Forget, P. Bonnaillie, G. Collin, et al.. Crystal growth and doping control
of HgBa2CuO4+δ, the model compound for high-T superconductors. Materials Research Bulletin,
Elsevier, 2019, 118, pp.110479. �10.1016/j.materresbull.2019.05.004�. �cea-02145955�
1
Crystal growth and doping control of HgBa
2CuO
4+δδδδ, the model compound forhigh-T
csuperconductors
A. Legros a,d, B. Loret a,d,f, A. Forget a, P. Bonnaillie b, G. Collin e, P. Thuéry c, A. Sacuto f, D. Colson a,*
a SPEC, CEA, CNRS UMR 3680, b SRMP, CEA, DMN, and c NIMBE, CEA, CNRS, Université Paris-Saclay, 91191 Gif sur Yvette Cedex,
France
d Department of Physics, University of Sherbrooke, Sherbrooke, QC J1K 2R1, Canada
e LPS, CNRS UMR 8502, Université Paris-Saclay, 91405 Orsay, France
f Laboratoire Matériaux et Phénomènes Quantiques, 10 rue A. Domon et L. Duquet, 75205 Paris Cedex 13, France
ABSTRACT
A self-flux method to grow very high quality single crystals of the superconducting HgBa2CuO4+δ mercury cuprates is reported. The single crystals are platelet-shaped, with surfaces of high optical quality and good crystallographic properties. Annealing
enables optimization of Tc up to Tcmax = 94 K. With adequate treatment, the doping level of the crystalline samples can be finely
controlled in a wide under- and over-doped range. Preliminary structural characterization from single crystal X-ray diffraction
data is given for different doping levels. The signature of under- and over-doping for both pure and gold-substituted crystals
has been identified from micro-Raman spectroscopy measurements.
Keywords: superconductors; crystal growth; magnetic properties; X-ray diffraction; Raman spectroscopy.
1. Introduction
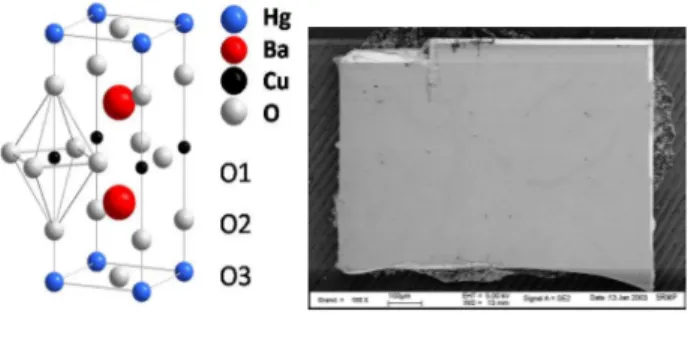
Since the discovery of the high-Tc superconductors (HTSC) in 1986 [1], mercury cuprates HgBa2Can–1CunO2n+2+δ, where n is the number of CuO2 layers, play a peculiar role as being the structurally simplest cuprates with the highest Tc values, up to 133 K (160 K under 30 GPa) for HgBa2Ca2Cu3O8+δ (Hg-1223) [2-5].The HgBa2CuO4+δ compound (Hg-1201) with only one CuO2 plane per tetragonal unit cell (space group P4/mmm, Fig. 1, left), and the highest Tc value of all single-layer cuprates,
2
is an ideal candidate to clarify the relationship between the crystallographic structure and the electronic properties, so as to improve the comprehension of high-Tc superconductivity mechanisms and reach still higher Tc values. Unfortunately, few single crystal studies have been performed, notwithstanding some progress in Hg-1201 crystal growth in the last decades [6-13]. Here we report a self-flux method to grow single crystals of Hg-1201 cuprate. The surfaces of the crystals synthesized are extremely clean, with high optical quality and good crystallographic properties (Fig. 1, right). Optimization of Tc, up to Tcmax(94 K), is possible through annealing, a wide range of doping levels in the under- and over-doped regimes being accessible through adequate heat treatments as previously described on powders [14-16]. Crystals elaborated by the same method have previously been used in Raman studies [17,18].
Fig. 1. Schematic representation of the crystal structure of tetragonal HgBa2CuO4+δ (left) and scanning electron microscopy (SEM) view of a single crystal of HgBa2CuO4+δ (right). The doping process consists in inserting oxygen on the O3 site, which is thus partially occupied (δ occupancy). The surfaces have high optical quality, and the crystallographic axes are easily identified (a axis along the edges, c axis perpendicular to the platelet).
As already signalled in a recent communication about Hg-1223 [19], these mercury compounds are very attractive, but they are complex oxides and their synthesis remains a challenge, in particular due to the toxicity of mercury oxide HgO and the necessity to control the volatility of its decomposition products. The present synthesis procedure allows the synthesis of large crystals of pure cuprates and the easy separation of the sample from the flux, thus providing high quality crystals with clean surfaces. It also has the advantage to be less expensive and more simple to operate than the technique using gold foil [6,7,8].
2. Experimental
The starting mixtures for crystal growth were prepared using HgO (99%), BaO (99.5%), and CuO (99.995%) oxides, as well as gold powder (99.95%) in some experiments. All manipulations of oxides were carried out in an Ar-gas-filled glove
3
box. The reagents were weighted, mixed and ground, giving powders (2 g) with the nominal compositions indicated in Figure
2. The best results were obtained by using the composition labelled K. For samples with gold, 2 g of oxides with the
composition K were mixed with 250 mg of gold powder.
The mixtures were directly placed in alumina crucibles and sealed in evacuated quartz tubes (13 mm in diameter, 70
mm in length). For the sake of safety, the tubes were enclosed in stainless steel containers. Heat treatments were carried out in
vertical tubular furnaces. Crystal growth was most favoured at temperatures close to 995 °C. Typical growth conditions were
as follows: the sample was heated at 750 °C for 10 h, then further heated to 995 °C at 100 °C/h and soaked for 1 h. The
temperature was afterwards lowered to 800 °C at a rate of 5-20 °C/h, and the furnace was cooled down to room temperature at
200 °C/h. The chemical composition of the crystals has been determined at several locations on the surface with a Camebax
SX50 electron microprobe. The analysed volume is of a few (µm)3.
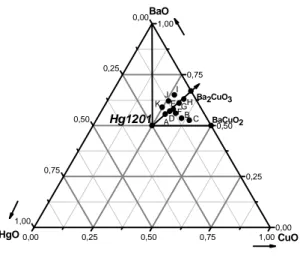
0,00 0,25 0,50 0,75 1,00 0,00 0,25 0,50 0,75 1,00 0,00 0,25 0,50 0,75 1,00 HgO BaO K BaCuO2 Ba2CuO3 CuO H G E Hg1201 I J ADF BC
Fig. 2. Phase diagram for HgO-BaO-CuO in air. Our study has identified a region of low melting compositions for application of the nonstoichiometric melt method. A composition close to “K” is favorable for synthesizing Hg-1201 crystals.
We have obtained nine samples with controlled doping levels, corresponding to different annealing treatments (see
below, paragraph 3.3, for details). These nine crystals are divided into three categories: (i) under-doped samples: UD55 (Tc = 55 K), UD62 (62 K), UD72 (72 K, gold-substituted), UD73 (73 K), UD88 (88 K, gold-substituted); (ii) optimal sample: OP93
(Tcmax = 93 K) and (iii) overdoped samples: OD89 (89 K), OD72 (72 K, gold-substituted) and OD65 (65 K, gold-substituted).
Single crystal X-ray diffraction data were collected at 150(2) K on a Nonius Kappa-CCD area detector diffractometer
4
large synthesized crystals. The unit cell parameters were determined from ten frames, then refined on all data. The data
(combinations of ϕ- and ω-scans giving a complete data set up to θ = 35°, with a minimum redundancy of 10 for 90% of the reflections) were processed with HKL2000 [21]. Absorption effects were corrected empirically with the program SCALEPACK
SCALEPACK [21].The structures were refined by full-matrix least-squares on F2 with SHELXL-2014 [22]. All atoms were refined with anisotropic displacement parameters and no restraint was applied, except for atom O3 which was refined
isotropically with restraints on its displacement parameter. The occupancies of atoms Hg1 and O3 was refined, but the small
quantity of gold present on the mercury site in the gold-substituted samples was not introduced.
Measurements of DC magnetic susceptibility down to 20 K were carried out by using a SQUID magnetometer
(Cryogenic Limited S600) in a field of 10 Oe. The field was applied in the c-axis direction, perpendicularly to the largest face
of the crystalline platelet. The classical zero field cooled (ZFC) procedure was used. The field was applied at the lowest
temperature and the ZFC magnetization was recorded as a function of increasing temperatures up to T > Tc. The Tc attributed to the different samples has been determined as the temperature corresponding to the middle of the superconducting transition.
Raman experiments have been carried out at room temperature using a JY-T64000 spectrometer in single grating
configuration fitted with a 1800 grooves/mm grating and a Thorlabs NF533-17 notch filter to block the stray light. The
spectrometer was equipped with a nitrogen-cooled back-illuminated CCD detector. The 532 nm excitation line from a diode
pumped solid state laser was used. An Olympus microscope with an objective of magnitude ×50 produced a laser spot of a few micrometers. Raman measurements have been performed in backscattering geometry. Crystals were fixed on their edge in such
a way as to align the electric field polarizations of the incident and scattered light along the cristallographic c-axis (z direction).
The incident and scattered light wave vectors are parallel to the a-axis (x direction). In Porto’s notation [23], this corresponds
to the x(zz)x configuration. Each Raman spectrum has been obtained in one frame, repeated twice to eliminate cosmic spikes,
with an acquisition time of 120 s. The resolution is approximately 1 cm-1.
3. Results and discussion
3.1. Crystal Growth
A low melting region in the pseudo-ternary HgO–BaO–CuO phase diagram was determined, and crystal growth was
achieved in a melt with an excess of BaO and CuO (see Experimental Section). In our experimental conditions, the interesting
5
been investigated. In order to determine a suitable growth temperature for the compositions labelled A to K, samples were
heated to temperatures between 950 and 1000 °C and then cooled down at 5–20 °C/h. The experiments have revealed that a
step at 750 °C ensures complete reaction by minimizing the soaking time. The composition most favourable to the growth of
crystals was that labelled K, for which 16.2 mol% HgO and 59:24.8 mol% BaO:CuO were mixed.
After the growth stage, most crystals are usually found at the bottom of the crucible in the frozen flux, from which
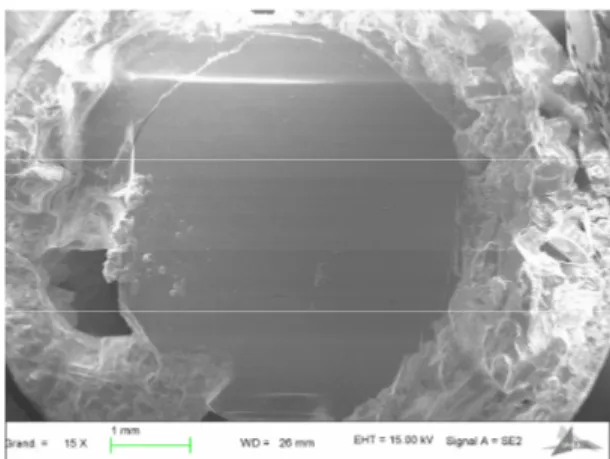
they are then mechanically separated; some large crystals may be found in the more favourable cases (Fig. 3). Fig. 1 shows
one typical, extracted platelet-shaped crystal, with well-developed {001} faces and a size of 0.7 × 0.5 × 0.05 mm3. With small cooling rates of 5 °C/h, thicknesses up to 0.3 mm have also been obtained.
Fig. 3. Single crystal of HgBa2CuO4+δ of 4 × 5 mm2 formed at the bottom of the crucible and surrounded by frozen flux (SEM).
A remarkable point is that the crystallographic axes of the crystalline platelets are easily identifiable (a axis along the
edges, c axis perpendicular to the platelet largest face), as in the Hg-1223 phase [16]. The chemical analysis of as-grown,
gold-free crystals, performed with a scanning electron microscope equipped with an electron microprobe, revealed a slight
under-stoichiometry of ∼0.94 in mercury, the mercury content being homogeneous in each crystal. No flux component was detected. In order to increase the doping level of the CuO2 layers as in the Au-substituted Hg-1223 compound and thus access more easily the over-doped regime, we have elaborated other crystals by substituting Hg by Au, through addition of gold powder
among starting reagents [24]. Chemical analyses carried out on the single crystals thus obtained showed that the average
composition is (Hg0.93Au0.04)Ba2CuOz. The distribution in gold is very homogeneous within each crystal and from one crystal
6
sub-stoichiometry (Hg + Au) ≈ 0.97, which is within the resolution limit of the device and indicates a good agreement with the
expected formula.
Microprobe analyses in depth along a line of 110 µm of a cut and polished gold-free crystal (see below, the electronic
micrograph) have been performed (Fig. 4). The sum of the atomic percentages of Hg, Ba, Cu and O equals 100. The atomic
percentage for the Al atom is below the limit of detection. These quantitative data thus show no contamination inside the crystal
by the alumina crucible and no carbon as impurity on the mercury site.
Fig. 4. Composition profile for the elements Hg, Ba, Cu, Al and O inside a Hg-1201 crystal, as indicated on the scanning electron micrograph.
3.2. Single crystal X-ray diffraction
The crystal structures of five samples of free (UD55, UD62, UD73, OP93 and OD89) and four samples of
gold-substituted Hg-1201 (UD72, UD88, OD72 and OD65) were refined from single crystal X-ray diffraction experiments. Atomic
coordinates are given in Table 1, and crystal data and values of refined parameters in Tables 2 and 3. Although this structural
7
of mercury led to a much-improved refinement quality and, more importantly, a much more acceptable displacement parameter
for this atom, abnormally large values being found for full occupancy [6]. These occupancies are in the range of 0.933(2)–
0.9720(12) and, as a general trend, they decrease when the amount of oxygen in the sample increases, the lower value being
for OD89. The possible presence of disordered mercury atoms in an amount depending on the temperature and atmosphere of
annealing has been discussed previously for Hg-1223 compounds,19 and the same phenomenon may be present here.
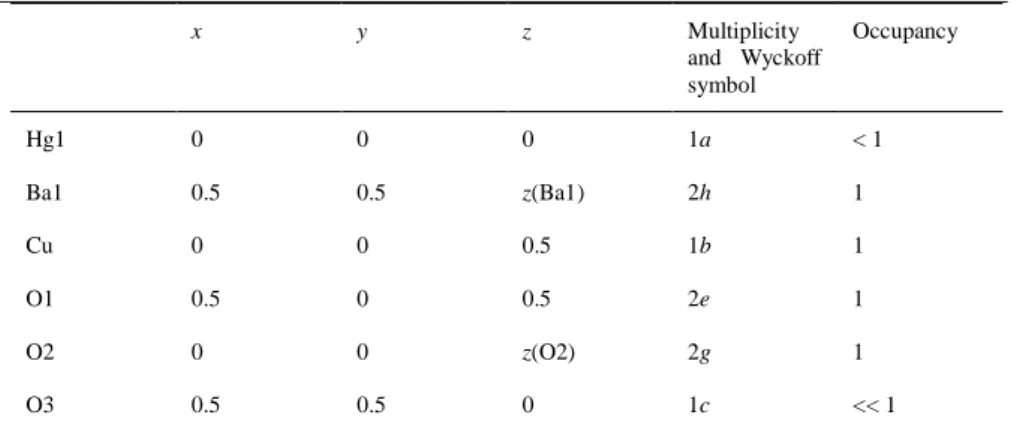
Table 1. Atomic Positions in HgBa2CuO4+δ.
x y z Multiplicity and Wyckoff symbol Occupancy Hg1 0 0 0 1a < 1 Ba1 0.5 0.5 z(Ba1) 2h 1 Cu 0 0 0.5 1b 1 O1 0.5 0 0.5 2e 1 O2 0 0 z(O2) 2g 1 O3 0.5 0.5 0 1c << 1
The occupancy parameter for atom O3, at (½ ½ 0), can only be obtained with a large uncertainty, due to the low
associated electronic density and the presence of several heavy atoms in the structure. The corresponding electronic density
appears however very clearly in the Fourier difference maps for the most oxygenated samples OP93 and OD89. In the former,
refinement proceeds smoothly, provided that O3 is refined isotropically (anisotropic refinement being highly unstable) and,
since the refined displacement parameter of O3 is close to the equivalent isotropic displacement parameter of O1, this has been
used as a restraint for all other samples, for which free refinement gave unreasonable values. When taking into account the
large standard deviations, the refined O3 occupancies in the series of gold-free samples agree roughly with the values calculated
from the relation between Tc/Tcmax and the number of carriers in the CuO2 plane (Table 2) [25]. Except for the as-grown crystal
UD73, we can note a decrease of the a parameter with the doping level, which is common in HTSC compounds (Table 2)
[8,16]. For all gold-substituted samples, no significant electronic density is found at (½ ½ 0), the oxygen content at this site
8
Table 2. Crystal Data, Refined Parameters and Occupancies for pure Hg-1201 Samples.UD55 UD62 UD73 OP93 OD89
Tc (K) (mid-transition) 55 62 73 93 89 a (Å) 3.8850(2) 3.8799(2) 3.8824(1) 3.8781(1) 3.8759(1) c (Å) 9.5048(4) 9.5084(5) 9.5092(4) 9.4988(4) 9.4796(4) R1 0.010 0.010 0.020 0.013 0.017 wR2 0.025 0.021 0.052 0.032 0.036 z(Ba1) 0.30129(3) 0.30087(3) 0.30039(4) 0.29876(3) 0.29707(5) z(O2) 0.2063(4) 0.2064(4) 0.2072(6) 0.2084(5) 0.2091(7) pa) 0.09 0.096 0.109 0.16 0.183 p/2 (O3 content) 0.045 0.048 0.055 0.08 0.092 Occupancy(O3) 0.007(13) 0.020(14) 0.08(2) 0.11(3) 0.16(2) Occupancy(Hg1) 0.9500(16) 0.9489(18) 0.940(2) 0.934(2) 0.933(2)
a) Electron hole concentration p in the CuO2 planes of HgBa2CuO4+δ [25].
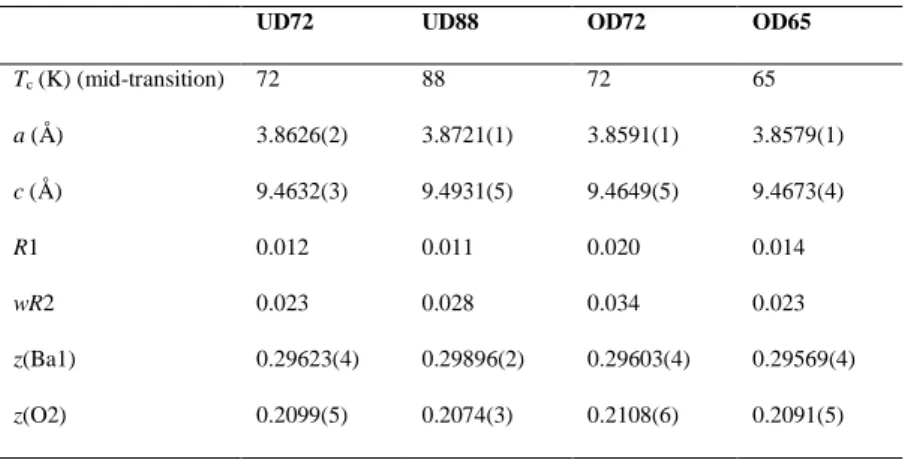
Table 3. Crystal Data, Refined Parameters and Occupancies for gold-substituted Hg-1201 Samples.
UD72 UD88 OD72 OD65
Tc (K) (mid-transition) 72 88 72 65 a (Å) 3.8626(2) 3.8721(1) 3.8591(1) 3.8579(1) c (Å) 9.4632(3) 9.4931(5) 9.4649(5) 9.4673(4) R1 0.012 0.011 0.020 0.014 wR2 0.023 0.028 0.034 0.023 z(Ba1) 0.29623(4) 0.29896(2) 0.29603(4) 0.29569(4) z(O2) 0.2099(5) 0.2074(3) 0.2108(6) 0.2091(5) 3.3. Magnetic Measurements
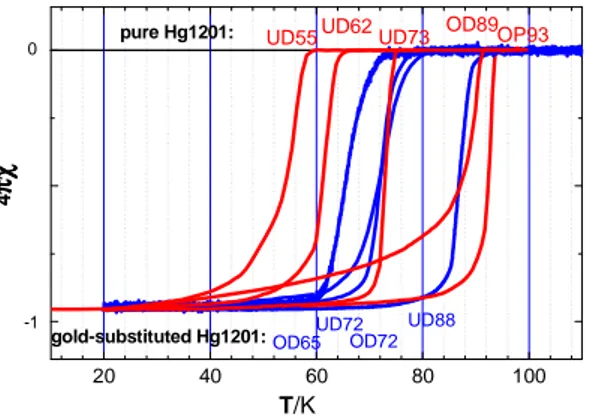
Magnetic measurements show that all the as-grown samples are under-doped with a Tc (midpoint) around 70 K (UD73) and a fairly sharp transition (∆Tc < 4 K) as shown in Fig. 5. In order to increase Tc to Tcmax, single crystals have been annealed under molecular oxygen flux at 325 °C. The crystals were placed in a mixture of HgO, BaO and CuO oxides to
prevent a departure of mercury from the samples during the 10 days heat treatment. After annealing, Tc increases up to 93 K (OP93) with a narrow transition width of 5 K confirming the good homogeneity of the oxygen content in the sample. In order
9
to access the under-doped region, we also developed a procedure of annealing under vacuum. As-grown crystals have been
annealed under a vacuum of 6.0 10–7 mbar at 400 °C during 4 days, or at 450 °C during 2 days. These thermal treatments result in a decrease of Tc from 70 K to 62 K (UD62) and 55 K (UD55), respectively, as shown in Fig. 5. Over-doping the crystals under oxygen high pressure (80 bars) at 300 and then 280 °Cduring 3 days gives sample OD89, with a Tc of 89 K.
Fig. 5. Temperature-dependence of the normalized magnetic susceptibility of under-doped (UD), optimal (OP) and over-doped (OD) crystals of pure (red) and gold-substituted (blue) HgBa2CuO4+δ.
Magnetic transitions of Hg1–xAuxBa2CuO4+δ gold-substituted crystals (Au-Hg-1201 hereafter) have also been determined. The Au-Hg-1201 as-grown crystals have a Tc of 88 K (UD88) which is much higher than the Tc value for pure Hg-1201 (Tc = 72 K) elaborated in the same conditions. Several crystals have been annealed under a vacuum of 6.0 10–7 mbar at 400 °C during 5 days. This treatment considerably decreases Tc, from 88 K to 72 K (UD72). Inversely, over-doping and decrease of Tc from 88 K to 72 K (OD72) follow treatment under oxygen flux at 325 °C during 8 days. To achieve an even larger over-doping of the Au-Hg-1201 samples, some as-grown crystals have been annealed under a vacuum of 6.0 10–7 mbar at 400 °C during 4 days and then under oxygen flux at 300 °C for 10 days. In this case Tc decreases from 88 K (UD88) in the under-doped regime to 65 K (OD65) in the over-doped regime.
3.4. Raman spectroscopy
All crystals have been characterized by micro Raman spectroscopy which reveals for the first time the specific Raman
features of the under-doped, optimally and over-doped pure or gold-substituted Hg-1201 compounds. HgBa2CuO4+δ has a very simple structure with a single CuO2 plane as a mirror plane. As a consequence, Raman spectroscopy is blind to the normal
20 40 60 80 100 -1 pure Hg1201: UD72 UD55UD62 OD72 OD65 OP93 UD73 T/K 4 πχπχπχπχ UD88 OD89 gold-substituted Hg1201: 0
10
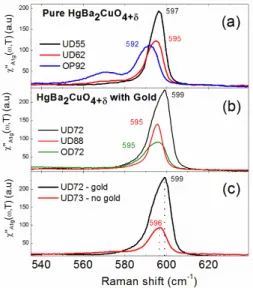
vibrational modes related to the CuO2 plane for selection rule reasons [26-28]. Solely, the A1g vibrational mode related to the vertical motion of the apical oxygen O2 is observable in the spectra of pure Hg-1201 (Fig. 6a).
Fig. 6. Raman spectra of pristine and gold-substituted Hg-1201 single crystals for several doping levels.
The O2 mode is located at 597 cm–1 for UD55. As the oxygen doping increases, the O2 mode softens in frequency and becomes broader. At the optimal doping (OP93) it is located at 592 cm–1 and it is accompanied by a new feature located around 570 cm–1. We interpret the softening and the broadening of the O2 mode as the consequence of the enhancement of the charge transfer between the Hg–O and CuO2 plane induced by oxygen atoms insertion at the O3 site during the doping process. In this scenario, the new feature corresponds to the extra oxygen vibrational mode related to the O3 site brought by doping.
Remarkably, the O2 vibrational mode stiffens in frequency in the gold substituted crystals with respect to the free gold ones,
This is shown in Fig. 6c where a shift of 3 cm–1 toward high frequencies is detected for the O2 mode in Au-Hg-1201 with respect to the pristine one for nearly the same doping level (UD73). Importantly, no extra feature around 570 cm–1 related to the O3 site occupancy is detected in Au-Hg-1201 crystals even in the over-doped regime (Fig. 6b). This suggests that the Au
substitution in Hg-1201 favors the hole doping in the CuO2 plane without necessarily introducing a large amount of oxygen atoms on the O3 site of the Hg–O plane. As a consequence, a weaker amount of oxygen content is required to reach the optimal
11
4. Conclusions
We propose an original procedure for the elaboration of high quality submillimetre platelet crystals of superconducting
HgBa2CuO4+δ. The remarkable points are that the surfaces of the crystals are extremely clean with high optical quality and the crystallographic axes are easily identifiable. An annealing method allowing fine control of the oxygen content in under- and
over-doped samples is also described. Raman measurements reveal the interplay between the Hg/Au substitution and the
oxygen insertion in the hole doping process of the Hg-1201 crystals, in perfect agreement with the X-ray diffraction
measurements. It is notable that this crystal growth method can be applied to other compounds for which there exists no phase
diagram and/or the growth in air is forbidden because of volatile components.
References
[1] J.G. Bednorz, K. Müller, Zeit. Phys. B 64 (1986) 189-193.
[2] S.N. Putilin, E.V. Antipov, O. Chmaissem, M. Marezio, Nature 362 (1993) 226-228. [3] A. Schilling, M. Cantoni, J.D. Guo, H.R. Ott, Nature 363 (1993) 56-58.
[4] C.W. Chu, L. Gao, F. Chen, Z.J. Huang, R.L. Meng, Y.Y. Xue, Nature 365 (1993) 323-325.
[5] M. Nunez-Regueiro, J.-L. Tholence, E.V. Antipov, J.-J. Capponi, M. Marezio, Science 262 (1993) 97-99.
[6] A. Bertinotti, V. Viallet, D. Colson, J.-F. Marucco, J. Hammann, G. Le Bras, A. Forget, Physica C 268 (1996) 257-265.
[7] A. Bertinotti, D. Colson, J.-F. Marucco, V. Viallet, G. Le Bras, L. Fruchter, C. Marcenat, A. Carrington, J. Hammann, Ed. Narlikar, Nova Science Publisher (NY) 23 (1997) 27-85.
[8] V. Viallet-Guillen,. Synthèse, études structurales et physico-chimiques de monocristaux d’oxydes supraconducteurs HgBa2Can–1CunO2n+2+δ. PhD Thesis, Orsay, (1998).
[9] P. Bordet, F. Duc, S. Le Floch, J.-J. Capponi, E. Alexandre, M. Rosa-Nunes, S. Putilin, E.V. Antipov, Physica C 271 (1996) 189-196. [10] M. Pissas, B. Billon, M. Charalambous, J. Chaussy, S. Le Floch, P. Bordet, J.-J. Capponi, Supercond. Sci. Techn. 10 (1997) 598-604. [11] D. Pelloquin, V. Hardy, A. Maignan, B. Raveau, Physica C 273 (1997) 205-212.
[12] D. Pelloquin, A. Maignan, A. Guesdon, V. Hardy, B. Raveau, Physica C 265 (1996) 5-12.
[13] X. Zhao, G. Yu, Y.C. Cho, G. Chabot-Couture, N. Barisic, P. Bourges, N. Kaneko, L. Lu, E.M. Motoyama, O.P. Vajk., M. Greven, Adv. Mater. 18 (2006) 3243-3247.
[14] J.-F. Marucco, V. Viallet, A. Bertinotti, D. Colson, A. Forget, Physica C 275 (1997) 12-18. [15] A. Yamamoto, W.Z. Hu, F. Izumi, S. Tajima, Physica C 351 (2001) 329-340.
12
[16] A. Yamamoto, W.Z. Hu, S. Tajima, Phys. Rev. B 63 (2001) 024504-024509.[17] B. Loret, S. Sakai, S. Benhabib, Y. Gallais, M. Cazayous, M.-A. Measson, R.D. Zhong, J. Schneeloch, G.D. Gu, A. Forget, D. Colson, I. Paul, M. Civelli, A. Sacuto Phys. Rev. B 96 (2017) 094525-094531.
[18] B. Loret, S. Sakai, Y. Gallais, M. Cazayous, M.-A. Méasson, A. Forget, D. Colson, M. Civelli, A. Sacuto, Phys. Rev. Lett. 116 (2016) 197001-197006. [19] B. Loret, A. Forget, J.-B. Moussy, S. Poissonnet, P. Bonnaillie, G. Collin, P. Thuéry, A. Sacuto, D. Colson, Inorg. Chem. 56 (2017) 9396-9399. [20] R.W.W. Hooft, COLLECT, Nonius BV, Delft: The Netherlands (1998).
[21] Z. Otwinowski, W. Minor, Methods Enzymol. 276 (1997) 307-326. [22] G.M. Sheldrick, Acta Crystallogr., Sect. C 71 (2015) 3-8.
[23] D.L. Rousseau, R.P. Bauman, S.P.S. Porto, J. Raman Spectr. 10 (1981) 253-290.
[24] P. Bordet, S. Le Floch, J.-J. Capponi, C. Chaillout, M.F. Gorius, M. Marezio, J.-L. Tholence, P.G. Radaelli, Physica C 262 (1996) 151-158. [25] M.R. Presland, J.L. Tallon, R.G. Buckley, R.S. Liu, N.E. Flower, Physica C 176 (1991) 95-105.
[26] G. Burns Introduction to group theory with application, Materials sciences series, IBM Thomas J. Watson Research Center: Yorktown Heights, New York, 1977.
[27] W. Guyard, M. Cazayous, A. Sacuto, D. Colson, Physica C 460-462 (2007) 380-381. [28] M.C. Krantz, C. Thomsen, Hi. Mattausch, M. Cardona, Phys. Rev. B 50 (1994) 1165-1170.