HAL Id: hal-00814975
https://hal.inria.fr/hal-00814975
Submitted on 18 Apr 2013
HAL is a multi-disciplinary open access
archive for the deposit and dissemination of
sci-entific research documents, whether they are
pub-lished or not. The documents may come from
teaching and research institutions in France or
abroad, or from public or private research centers.
L’archive ouverte pluridisciplinaire HAL, est
destinée au dépôt et à la diffusion de documents
scientifiques de niveau recherche, publiés ou non,
émanant des établissements d’enseignement et de
recherche français ou étrangers, des laboratoires
publics ou privés.
An automatic building reconstruction method: a
structural approach using high resolution satellite
images
Florent Lafarge, Xavier Descombes, Josiane Zerubia, Marc Pierrot-Deseilligny
To cite this version:
Florent Lafarge, Xavier Descombes, Josiane Zerubia, Marc Pierrot-Deseilligny. An automatic
build-ing reconstruction method: a structural approach usbuild-ing high resolution satellite images.
Interna-tional Conference on Image Processing (ICIP), Nov 2006, Atlanta, United States. pp.1205 - 1208,
�10.1109/ICIP.2006.312541�. �hal-00814975�
AN AUTOMATIC BUILDING RECONSTRUCTION METHOD : A STRUCTURAL APPROACH
USING HIGH RESOLUTION SATELLITE IMAGES
Florent Lafarge
1,2, Xavier Descombes
1, Josiane Zerubia
1 1Ariana Reseach Group - INRIA/I3S
2004, routes des Lucioles, BP93
06902 Sophia Antipolis, Cedex France
[email protected]
Marc Pierrot-Deseilligny
2 2Institut G´eographique National
2/4 avenue Pasteur
94165 Saint-Mand´e, Cedex France
[email protected]
ABSTRACT
We present an automatic 3D city model of dense urban areas from high resolution satellite data. The proposed method is developed us-ing a structural approach : we construct complex buildus-ings by merg-ing simple parametric models with rectangular ground footprint. To do so, an automatic building extraction method based on marked point processes is used to provide rectangular building footprints. A collection of 3D parametric models is defined in order to be fixed onto these building footprints. A Bayesian framework is then used : we search for the best configuration of models with respect to both a prior knowledge of models and their interactions, and a likelihood which fits the models to the Digital Elavation Model. A simulated annealing scheme allows to find the configuration which maximizes the posterior density of the Bayesian expression.
1. INTRODUCTION
For the last decade, the automatic 3D reconstruction of urban areas has become a topic of interest. Faced with the urbanization devel-opment, 3D-models with connected planar facets are used in various applications such as the computing of electromagnetic wave propa-gation or the creation of virtual realities. Several automatic methods giving satisfactory results, such as perceptual organization [1], para-metric models [2] or polyhedral approach [3], have been developed using aerial images.
Nowadays, this problem is tackled by another kind of data : the sub-metric satellite images. The main advantages of satellite data com-pared to aerial images are a high swath width and ground coverage. However, such data have a ”relatively low” resolution and a ”low” signal to noise ratio to deal with 3D reconstruction problems. For example, our satellite data have4 pixels per square meter contrary to
aerial data used in [3] which have about140 pixels per square
me-ter. Those drawbacks do not allow to robustly use standard methods developed for the aerial image case. The main alternative consists in proposing methods based on an important prior knowledge concern-ing urban structures.
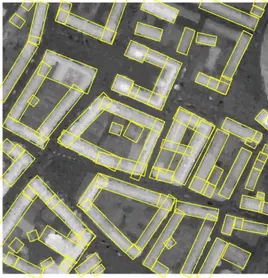
An automatic building extraction method [4] based on marked point processes is used to provide rectangular building footprints. It con-sists in extracting the building outlines through a configuration of rectangles from Digital Elevation Models (DEM) which are altimet-ric descriptions of urban areas. Figure 1 shows the result using a DEM provided from multiple stereo pairs (3-views) of PLEIADES simulations (0.5 meter resolution - B/H=0.2) by the French Geo-graphic Institute (IGN) and computed by an algorithm based on [5]. Our goal is then to construct a 3D city model from the DEM and
Fig. 1. Building extraction result from a Digital Elevation Model
associated rectangular building footprints. To do so, a structural ap-proach is used : buildings are reconstructed by merging simple urban structures. The last ones are defined through a collection of 3D para-metric models with rectangular ground footprint. This approach is preferred since it is less complex, more robust to satellite data and more adapted to rectangular building footprints. Such an approach has been used in [6] based on a restricted grammar of symmetric models in a peri-urban area context from aerial data.
Using a Bayesian framework, the method is based on the definition of a density which contains both a prior knowledge on the build-ings, taking into account the interactions existing between neighbor-ing models, and a data term which fits the models to the DEM. A Markov Chain Monte Carlo technique coupled with a simulated an-nealing is used to find the configuration of models which maximizes this density.
2. MODEL COLLECTION
2.1. Notations Let us consider:
• S, a set of sites and I = {x(s)/s ∈ S}, a set of intensities
• R, the object space of a rectangle which is defined by five
parameters : its center(xc, yc) and its length, width and
ori-entation(L, l, φ). • C ∈ RN
, the rectangle configuration representing the build-ing footprints associated withI and computed by the method
described in [4] (N represents the number of rectangles). • Si, the subset ofS whose sites are inside the rectangle i ∈ C. • D = {x(s) ∈ I/s ∈ Si, i ∈ C}, the set of data
• T , the state space and θ = (θi)i∈C ∈ T , a configuration of
modelsM.
• fθi, the function fromSitoR which associates the roof
alti-tude of the model defined byθito each site ofSi.
2.2. Choice of the model collection
Figure 2 shows the proposed collection of 3D parametric models with rectangular ground footprint, denoted byM = (Mm)m∈[1,13].
It is composed of13 models which are parametrically simple and
al-Fig. 2. Collection of modelsM (top views and 3D views) - D, the
dimension of the models -P , the parameters of the models
low to represent a majority of the common urban structures. For example,M1andM5represent respectively flat roofs and
dissym-metric two-planes roofs. The13 proposed models have continuous
state spaces with various dimensions (between1 and 4 without
tak-ing into account rectangular base parameters). Hg andHcare
pa-rameters of the roof height which correspond to the getter of roof
height and the roof top height respectively.α, β, γ and δ are
param-eters of the roof form. They belong to[0, L], [0,L
2], [0, l] and [0, l 2]
respectively. More details about these models are available in [7]. 3. DENSITY FORMULATION
Let us consider the measurable space(T , B(T ), µ(.)) associated to
the measureµ(.) (see [7] for a detailed description of µ(.)). We
consider the random variableΘ distributed in T which follows an
unnormalized densityh(.) against µ(.). h(.) is actually the
poste-rior density of a configurationθ of models, given D. In a Bayesian
framework, this density can be obtained as follows :
h(θ) = h(θ/D) ∝ hp(θ)L(D/θ) (1)
A requirement is to be able to build both a prior densityhp(θ) and a
likelihoodL(D/θ). In the following, these two terms are detailed.
3.1. Likelihood
Let us considerDi, the partial data of rectanglei defined as D = S
i∈CDi.L(Di/θi) represents the probability of observing Di
know-ing the objectθi. By considering the hypothesis of conditional
inde-pendence (it means we disregard the overlapping of rectangles), the likelihood can be expressed as:
L(D/θ) =Y i∈C L(Di/θi) = Y i∈C exp(−kfθi− xki) (2) k.kiis the norm defined from the function space ofSitoR by :
kf ki= 1 card(Si) X s∈Si |f (s)| (3)
So, the likelihood is linked to the Z-error of theL1 norm between
the DEM and the parametric modeling defined by the configuration
θ. The L1norm is preferred to theL2norm since the DEM is neither
exact nor accurate. TheL2norm is too sensitive to the DEM errors.
3.2. Prior density
The prior term allows to favor some configurations and penalize other ones. Some interactions between objects are defined thanks to a neighborhood relationshipν (see Figure 3). The existence of a
(a) (b)
Fig. 3. Neighborhood relationshipν - (a) : non neighboring
rectan-gles (b) : neighboring rectanrectan-gles
neighborhood is very important. It allows to consider the problem from a structural point of view by merging models (i.e. by consider-ing a buildconsider-ing as an association of rectangles instead of seeconsider-ing it as a unique rectangle). ǫ defines the neighborhood width. It has been
set up to one meter, that is a distance which tolerates small errors concerning the rectangle linking up and is smaller than the average width of a street. The prior density derives from different Gibbs en-ergies developed in the following. It is given by:
3.2.1. Getter of roof height adjustment
The getter of roof heights of buildings are dependent on neighboring urban structures. It is important to define an interaction term which favors the getter of roof height alignment between neighboring rect-angles. This term has to be:
• attractive for similar getter of roof heights (i.e. with a
differ-ence lower than half a floor)
• repulsive for different getter of roof heights (i.e. with a
dif-ference between half a floor and one floor)
• neutral for distant getter of roof heights (i.e. with a difference
higher than one floor)
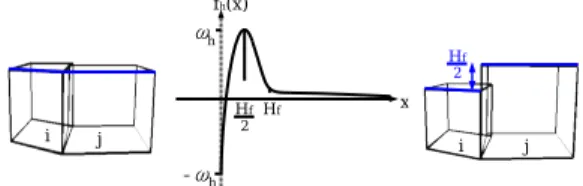
To do so, we define the energy termUhas follows: Uh(θ) =
X
iνj
fh(|Hgi− Hgj|) (5)
wherefhis a real value function specified in [7] (see Figure 4),
which depends onωh, a positive constant potential andHf, a
con-stant which represents a floor height (in practice, we takeHf = 3
meters).
Fig. 4. left : favored configuration center :functionfhright :
pe-nalized configuration
3.2.2. Roof top linking up
It is important to develop an interaction which favors roof top linking up between neighboring buildings while respecting the possibility of roof top discontinuity. We propose an interaction which attracts the roof top extremities of neighboring buildings when the roof top height differs from less than a floor height (see Figure 5). The asso-ciated energy is modeled as follows:
Ur(θ) = X
iνj
ωrdc(ei, ej) (6)
whereeiis the point (inR3) corresponding to the roof top extremity
of the modelθiandωr, a positive constant potential. dc(., .) is the
function corresponding to the distance related to theL2-norm in R3
if|(Hci+ Hci) − (Hcj + Hcj)| < Hf and0 if not.
Fig. 5. left : penalized configuration right : favored configuration
4. OPTIMIZATION
We want to find the configuration which maximizes the densityh(.).
We search for the Maximum A Posteriori estimatorθM AP: θM AP= arg max
θ
h(θ) (7)
This is a non convex optimization problem in a high and variable dimension spaceT since the models of collection M are defined by
a different number of parameters.
A stochastic optimization based on a Reversible Jump Markov Chain Monte Carlo method [8] [9] is well adapted to this problem. It is an optimization method derived from Markov Chain Monte Carlo tech-niques which allows to deal with variable dimension state spaces. It consists in simulating a discrete Markov Chain(Θt)t∈NonT of
invariant measureπ (specified by the density h(.)) which performs
small jumps between spaces of variable dimensions. One of the main advantages of such a sampler is that the chain asymptotically con-verges towardsπ for all initial configuration Θ0.
In practice, a simulated annealing is used : the densityh(.) is
sub-stituted byh(.)Dt1 whereDt is a sequence of temperatures which
tends to zero ast tends to infinity. At the beginning of the
algo-rithm (i.e. when the temperature is high), the process is not really selective : it allows to explore the density modes. When the tem-perature decreases, configurations which have a high density will be favored. Although a logarithmic decrease is necessary to ensure the algorithm convergence, temperature decreases geometrically in practice, in order to reduce the computing time. More details about the optimization process are available in [7].
5. RESULTS
In most cases, using energy models implies parameter tuning. Those parameters correspond to weights of the various energy termsωh
andωr, which are chosen by trial and error.
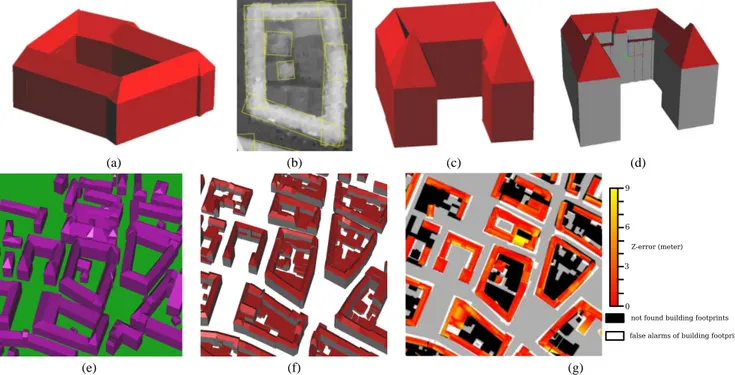
Figure 6-a/c presents two examples of building 3D reconstruction associated respectively with the data (Figure 6-b) and the 3D ground truth provided by the French Geographic Institute (Figure 6-d). The result presented in the figure 6-a is satisfactory compared to the as-sociated data. We can see the importance of the prior knowledge through getter of roof height alignments and roof top linkings up. The proposed modeling in the figure 6-c does not allow to represent some details [7]. However, the global shape is respected and the gen-eralization level is acceptable for satellite data.
Figure 6-e shows the result obtained from Amiens downtown DEM (see Figure 1). It is a satisfactory result with respect to the 3D ground truth (Figure 6-f). The main drawback is the presence of artefacts due to a non optimal rectangle overlapping and roof top linking up impossibility in some specific places. Figure 6-g represents the asso-ciated error map which provides three pieces of information. First, it provides the not found areas of the building extraction (in black). They correspond to low flat buildings of inner courtyards that the building extraction method [4] cannot detect. Then, we can see the false alarms of building extraction (in white - rate : 12%), mainly
located around the reference building footprint (due to a “drooling” DEM on the building contours which generates wider rectangles). Finally, it provides Z-errors between the reconstruction result and the 3D ground truth (red to yellow). The corresponding Root Mean Square Error (RMSE) of common building footprints is3.2 meters.
This value is satisfactory for a fully automatic method using2.5
(a) (b) (c) (d)
(e) (f) (g)
Fig. 6. (a)-(b) : example of reconstructed building and the associated data (c)-(d) : example of reconstructed building and the associated 3D ground truth c IGN (e)-(f)-(g) : Result on a downtown corresponding to figure 1 - the associated 3D ground truth c IGN - the associated
evaluation map
6. CONCLUSION
Results obtained by the new method proposed in this paper show that the use of a structural approach based on a parametric model collection is well adapted to deal with satellite data in an automatic context. The obtained 3D reconstructions, and especially the roof reconstructions, are satisfactory : a majority of urban structures is close to reality. The proposed prior knowledge allows to compen-sate for the low quality of data.
However, the main drawback is the presence of artefacts due to a non optimal rectangle overlapping and roof top linking up impossi-bility at some locations. A solution would consist in using polygo-nal building footprints by morphing the rectangle configuration into polygon configuration. In the future, we should work on this prob-lem.
7. ACKNOWLEDGMENTS
This first author would like to thank the French Geographic Institute (IGN) and the French Space Agency (CNES) for partial financial support during his PhD. The authors thank the French Space Agency (CNES) for providing PLEIADES simulations.
8. REFERENCES
[1] R. Nevatia and K. Price, “Automatic and interactive modeling of buildings in urban environments from aerial images,” in ICIP, New York, 2002.
[2] U. Weidner and W. Forstner, “Fowards Automatic Building Re-construction from High Resolution Digital Elevation Models,”
Journal of Photogrammetry and Remote Sensing, vol. 50(4), pp.
38–49, 1995.
[3] C. Baillard and A. Zisserman, “A plane-sweep strategy for the 3D reconstruction of buildings from multiple images,” in 19th
ISPRS Congress and Exhibition, Amsterdam, 2000.
[4] M. Ortner, X. Descombes, and J. Zerubia, “Building extraction from Digital Elevation Model.,” in ICASSP, Honk Kong, Apr 2003.
[5] S. Roy and I.J. Cox, “A maximum-flow formulation of the n-camera stereo correspondence problem,” in ICCV, Bombay, Jan 1998.
[6] F. Fuchs and H. Le Men, “Efficient subgraph isomorphism with a-priori knowledge. application to building reconstruction for cartography,” Lecture Notes in Computer Science, , no. 1876, Springer, 2000.
[7] F. Lafarge, X. Descombes, J. Zerubia, and M.P. Deseilligny, “A parametric model for automatic 3D building reconstruction from high resolution satellite images,” Research Report 5687, INRIA, september 2005.
[8] P.J. Green, “Reversible Jump Markov Chains Monte Carlo com-putation and Bayesian model determination,” Biometrika, vol. 57, pp. 97–109, 1995.
[9] C.P. Robert and G. Casella, Monte Carlo Statistical Methods, Springer-Verlag, New York, 1999.
![Figure 2 shows the proposed collection of 3D parametric models with rectangular ground footprint, denoted by M = (M m ) m∈ [1,13]](https://thumb-eu.123doks.com/thumbv2/123doknet/13098271.385848/3.918.99.429.343.835/figure-proposed-collection-parametric-models-rectangular-footprint-denoted.webp)