HAL Id: hal-03120933
https://hal.archives-ouvertes.fr/hal-03120933
Submitted on 6 May 2021HAL is a multi-disciplinary open access archive for the deposit and dissemination of sci-entific research documents, whether they are pub-lished or not. The documents may come from teaching and research institutions in France or abroad, or from public or private research centers.
L’archive ouverte pluridisciplinaire HAL, est destinée au dépôt et à la diffusion de documents scientifiques de niveau recherche, publiés ou non, émanant des établissements d’enseignement et de recherche français ou étrangers, des laboratoires publics ou privés.
Distributed under a Creative Commons Attribution| 4.0 International License
numerical study
A.-M. Leclerc, P. Jean-Baptiste, D. Texier, D. Broc
To cite this version:
A.-M. Leclerc, P. Jean-Baptiste, D. Texier, D. Broc. Density-induced water circulations in atoll coral reefs: A numerical study. Limnology and Oceanography Bulletin, American Society of Limnology and Oceanography, 1999, 44 (5), pp.1268-1281. �10.4319/lo.1999.44.5.1268�. �hal-03120933�
1268
Density-induced water circulations in atoll coral reefs: A numerical study
A.-M. Leclerc
1, P. Jean-Baptiste, D. Texier
2Laboratoire des Sciences du Climat et de l’Environnement, Unite´ Mixte de Recherche CEA-CNRS, Baˆt 709, Orme des Merisiers, 91191 Gif-sur-Yvette CEDEX, France.
D. Broc
CEA/DRN/DMT/SEMT/TTMF, CEN Saclay, 91191 Gif-sur-Yvette CEDEX, France.
Abstract
Groundwater flow in an idealized atoll platform is simulated with CASTEM 2000, a computer code developed at the CEA (Commissariat a` l’Energie Atomique). Darcy’s law and a coupled solute transport equation (diffusion–dispersion–convection) is solved by the mixed-hybrid finite-element method. Inward and upward circulations of oceanic water are shown to occur. These steady-state circulations result from temperature and, to a lesser extent, salinity gradients. Inclusion of a karstified dolomitic horizon, ob-served at the base of the carbonate structure of certain atolls, is necessary to account for the negative vertical temperature gradient indicated by field data. The position of the platform in relation to the oceanic temperature and salinity distributions exerts a significant control on the interstitial hydraulic regime. The effect of a secondary karstic layer closer to sea surface is also modeled. In this case, calculations show that the near-surface carbonate edifice is deprived of a significant portion of the flow. Finally, an upper limit on the possible flow rate through the platform is calculated. This upper estimate is shown to be independent of the possible uncertainties on the hydraulic conductivity of the system. Corresponding upper limits on the nutrient fluxes of PO32 and NO are evaluated. A comparison with2
4 3
current import and export data for the surface ecosystem indicates that in every case, nutrient fluxes hardly reach a few percent of the exports. Therefore, the deep oceanic nutrient pool brought to the surface by thermally driven interstitial circulation is only a minor nutrient source for the reef ecosystem.
The composition and circulation of interstitial waters in the porous carbonate framework of coral reefs are central to our understanding of reef development and geological evo-lution. Atoll reef hydrology is also of prime importance to the management of fresh groundwater for communities on these islands.
Hydrogeological studies of coral reefs were spurred by the American and French underground nuclear tests in Pacific atolls (Buddemeier and Holladay 1977; Wheatcraft and Bud-demeier 1981). Cores drilled in atolls revealed that coral reefs are complex porous media with both horizontal and vertical heterogeneity over a wide range of spatial scales, including cracks, karsts, and strata of composite materials with different permeabilities. The occurrence of large dolo-mitized horizons also led geologists to suggest that reefs should be regarded as hydrologically active environments, as dolomitization requires the passage of large volumes of seawater in order to supply the necessary magnesium (Bud-demeier and Oberdorfer 1986).
1Corresponding author.
2Present address: University of Reading, Department of
Meteo-rology, Earley Gate, P.O. Box 243, Reading RG6 6BB, U.K.
Acknowledgments
We thank the Programme National pour les Re´cifs Coralliens (PNRCO) for financial support and the Laboratoire de Transferts Thermiques et Me´canique des Fluides (CEA) for providing us with computing facilities. We thank Jean-Pierre Gattuso for his fruitful remarks about the nutrient budget and Bernard Boudreau and two other anonymous reviewers for their helpful comments. This is con-tribution LSCE-0070.
The first strong evidence of large groundwater convective cells was obtained by Kohout (1967), not in an atoll, but in the Floridian carbonate platform. There, thermal springs dis-charge warm, chemically altered seawater from vents and seepage zones. These fluids apparently originate from the ocean around the Floridian Plateau. While percolating to-ward the interior of the platform, the water is heated geo-thermally from 108C to 408C; subsequently, it moves moves upward and is discharged as warm springs (Fanning et al. 1981). In contrast to the usual situation in most geological deposits, the vertical temperature gradient is negative (tem-perature decreasing with depth). Both vertical and horizontal thermal fields suggest that cold dense water flows inland. There, reduction of the fluid density produced by geothermal heating generates upward convective circulation. A similar distribution of water temperatures was observed in Eniwetok and Bikini atolls drill holes (Swartz 1958) and in Mururoa atoll (Sornein and Guy 1993). This suggests an analogous circulation scheme to the Florida case and confirms the hy-pothesis of hydraulic exchange between coral reefs and the surrounding oceanic waters. Samaden et al. (1985) per-formed numerical simulations of thermohydraulic ground-water flow in Eniwetok atoll and succeeded in reproducing the observed thermal field inside the reef.
Atoll hydrology studies indicate that the movement of in-terstitial waters can occur as a consequence of a variety of both steady and transient forcings. These include flows that result from external temperature and salinity gradients or from geothermal heating by the underlying basaltic basement but also tidal pumping, wave setup, etc. (Buddemeier and Oberdorfer 1988). Large-scale steady-state convective flow
Fig. 1. Simplified geologic cross section of Mururoa atoll.
further depends on system geometry, on the boundary con-ditions, and on the overall hydraulic conductivity. However, the relative influence of these various conditions remains poorly understood. This paper aims at clarifying their role in the flow through an atoll structure by using computer modeling. For this purpose, the groundwater flow in an ide-alized atoll is simulated with the CASTEM 2000 computer code, developed at the CEA (Commissariat a` l’Energie Ato-mique).
The motivation behind this study is to test the endoup-welling hypothesis, proposed by Rougerie and Wauthy (1986). By analogy to coastal upwellings, this theory sug-gests that nutrients are transported through the atoll by groundwater flow to the surface ecosystem. We evaluate whether this supply is quantitatively sufficient to sustain the biological productivity of atoll surface ecosystems. The first stage of the hydraulic study solves the thermohydraulic cou-pling inside a homogeneous platform. A high hydraulic con-ductivity karstic layer at the base of the carbonate is then integrated into the model. This layer is needed to reproduce the thermohydraulic regime of the platform. The effect of salinity is added to this second configuration. The growth of an atoll is simulated by thickening the platform, and the influence of a second karstic layer is assessed. Finally, these results are used to obtain an upper limit on the nutrient fluxes arising from the upward motion of the pore water in the reef.
Equations and modeling
Description of the carbonate platform—Carbonate
plat-forms contain successive layers of calcareous slab, calcite, more or less indurated and karstified dolomite, etc. Thus, the hydraulic conductivity measured on small-scale samples in laboratories may not represent the overall hydraulic conduc-tivity. The hydraulic conductivity of these carbonates was estimated both from computer calculations and from field pump tests to be approximately 1024 m s21 (Guille et al.
1993; Buigues 1997). The carbonate hydraulic conductivity is then allowed to vary in the neighborhood to this reference value. The carbonate platform lies upon a basaltic bedrock (Fig. 1) , which has a hydraulic conductivity almost three orders of magnitude lower than that of the carbonate (Sa-maden et al. 1985; Guille et al. 1993).
Henry et al. (1996) modeled Mururoa atoll with both of the geological domains to evaluate water residence time in-side the volcanic bedrock and to check that velocities were small enough to prevent any hazardous radioactive leakage. The flows were restricted essentially to the inside of the very permeable carbonate layer. Hydraulic flow does occur inside
the basaltic bedrock, but its magnitude is too small to induce significant circulations in the upper carbonate medium, at least compared to the circulations induced by the ocean ther-mal gradient and the geotherther-mal flux. Fluxes of chemical species that may transit through the basalt toward the upper carbonate rock will also be negligible, as long as the con-centrations in the basalt interstitial waters are not high enough to compensate for the low hydraulic conductivities and velocities. As the hydraulic conductivity ratio of the ba-salt to the carbonate is on the order of 0.001, neglecting the basalt is justified if solute concentrations in the basalt are not more than three orders of magnitude higher than in the carbonate. As far as nutrients (NO , PO ) are concerned,2 32
3 4
this condition is valid (Rougerie and Wauthy 1993); thus, the basalt can be considered impervious, as was also as-sumed in many other hydrological modeling studies (Her-man et al. 1986; Oberdorfer et al. 1990; Underwood et al. 1992).
The platform hydrology is influenced by the layered den-sity structure of the surrounding ocean. In the Polynesian oceanic environment, the first hundred meters below the sur-face constitute a mixed layer where temperature and salinity are almost homogeneous (.278C and .36 of salinity). Tem-perature and salinity then decrease quite rapidly down to 500 m depth (thermocline and halocline); below 500 m, both decrease only slightly and reach, respectively, 68C and 34.5 at.800 m depth (Kessler and Monbet 1984). Using Millero and Poisson (1981), we calculated that neglecting salinity variations leads to an.30% error in the ocean density gra-dient between the surface and the base of the system. So as to take the system complexity progressively into account, we first considered only thermally induced density gradients that are the dominant driving force of the system and account for the effect of salinity on water density at a later stage.
Governing equations—The carbonate rock of atolls is a
saturated porous medium. Groundwater flow therein is gov-erned by five equations: (1) a hydraulic equation, Darcy’s law, giving the velocity
p rw
W W
WU 5 2K ¹
1
r g 1 r ¹z ;2
0 0
(2) Boussinesq’s approximation for the incompressibility condition (i.e. we neglect the compressibility of water except in the gravity term),
W W ¹·U 5 0;
(3) a thermal equation with three terms,
]T W W W W
r Cm pm]t 5 ¹·(l¹T) 2 r C U·¹T ;w pw |}}}}z | |}}}}z | |}}}}}}z |
transient diffusion convection
(4) a transport equation for any solute with three terms,
⇒
]S W W W W
f]t 5 ¹· D ¹S
1
2
2 U·¹S |}}z | |}}}}}z | |}}}z | transient diffusion–dispersion advection where DL 0 0 ⇒ D 5 0 DT 0 0 0 DT DL5 fD 1 a zUze L DT5 fD 1 a zUze T
and (5) a linear equation of state for seawater density:
r 5 r0(12 bT 1 gS).
In these equations, UW is the Darcy (or filtration) velocity (m s21), p the pressure of the interstitial fluid (N m22), g the gravity (m s22), r
0 the water density at the reference
tem-perature (kg m23),rwthe water density as a function of tem-perature and salinity (kg m23), z the vertical coordinate (m),
K the hydraulic conductivity (m s21), T the temperature of the medium (8C), t the time (s),l the thermal conductivity of the saturated medium (J s21 m21 8C21),rmCpm 5 frwCpw 1 (1 2f )rsCps the heat capacity of the saturated medium (J m23 8C21), rwCpw the water heat capacity (J m23 8C21),b the water coefficient of thermal expansion (8C21), S the
salinity (no unit),f the total porosity (%),D⇒ the diffusion– dispersion tensor (m2s21),g the water coefficient of
expan-sion due to salinity (no unit), DLthe longitudinal dispersion coefficient (m2s21), D
T the transverse dispersion coefficient (m2s21), D
e the effective diffusion coefficient (m2 s21), aL the longitudinal dispersivity (m), aT the transverse disper-sivity (m), and zUz the norm of the Darcy velocity (m s21).
The equation of state introduces coupling between the hy-draulic flow, the temperature field, and the salinity field by making temperature and salinity appear in the hydraulic equation. Hence Darcy’s law becomes
p
W W
WU 5 2K ¹
1
r g 1 (1 2bT 1 gS)¹z .2
0
When only thermohydraulic coupling is taken into ac-count, the behavior depends only on the filtration Rayleigh number (Straus 1974), a dimensionless parameter:
KbT Lr C0 w pw
Ra5
l
where L is a reference length, characterizing the size of the system, and T0a reference temperature. The Rayleigh
num-ber characterizes the ratio between convection and diffusion, with higher Rayleigh number values indicating an increase in the convection-to-diffusion ratio.
The numerical model—The calculations are performed
with CASTEM 2000, a computer code developed by the Department of Mechanics and Technology (DMT) at the CEA (Commissariat a` l’Energie Atomique). Originally de-vised to solve structure mechanics, its fields of application now range from nuclear reactor hydraulics to groundwater problems (Paille`re and Dabbene 1997). In our study, the above-stated equations are solved with a mixed-hybrid finite-element method. This budget-based formulation respects in-trinsically the incompressibility of the fluid and the conti-nuity of mass fluxes through the element interfaces
(Dabbene 1998). Such a method is particularly well suited for heterogeneous media. The term mixed means that pres-sures and velocities are calculated simultaneously when solving Darcy’s law, whereas the classical finite-element method solves pressure first by injecting Darcy’s law into the mass conservation equation and calculates the velocity field afterward. The hybrid aspect consists of assigning flux continuity at the element interfaces through an additional matrix equation (hybridation), unlike classical finite-element methods (Chavent and Roberts 1991; Mose´ et al. 1994).
Although only a steady flow regime is sought, the model runs in a transient state. The thermal equation and the equa-tion of transport are solved implicitly, in turn, at each iter-ation, with a centered scheme for the discretization of the convection term. A two-dimensional representation is as-sumed to provide sufficient description of the thermohy-draulic behaviour of the atoll and suitable orders of magnitude for the flow rates. A few two-dimensional axi-symmetrical simulations confirmed this hypothesis. Except in the first calculations presented in this study, two types of geological domains are considered: the carbonate rock and zones of higher hydraulic conductivity (karsts), both of which are treated as homogeneous and isotropic porous me-dia. The model has physical dimensions close to those of a transversal cross section of Mururoa atoll at its broadest ex-tent. The mesh of a one-layer homogeneous carbonate is represented in Fig. 2A along with its dimensions.
No lagoon simulation is performed in this study. The atoll surface is entirely flat, exactly at sea level and is, ideally, submerged under a few centimeters of seawater.
Main forcings and boundary conditions—Transient
ef-fects, like tides or wave setup, certainly dominate the near-surface hydrology. Rigorous modeling of the steady-state hy-drologic regime of the carbonate platform would require temporal averaging of these transient stresses. In the car-bonate body, with a hydraulic conductivity of 1024 m s21,
hydraulic effects (velocity oscillations) are quickly damped with depth (Leclerc et al. 1998), but in highly permeable zones, oscillatory changes in velocity direction may result in a high apparent dispersivity. However, this question is not addressed in the present study.
In their study of Mururoa, Henry et al. (1996) assert that the heat flow at the interface between the basalt and the carbonate structure is close to 47 mW m22 with no large
lateral variations, and they use 50 mW m22in their computer
simulations. In order to maximize the flow rates, an over-estimated, constant heat flow of 75 mW m22is assigned to
the lower boundary of the platform. The boundary condi-tions for the mathematical problem are summarized in Fig. 2B. Ocean temperature and salinity profiles were measured by Kessler and Monbet (1984). The oceanic pressure values assigned are hydrostatic pressures, determined by the sim-plified temperature and salinity profiles and by the seawater equation of state. The numerical values of the other physical parameters, as taken from the literature, are given in Table 1.
The homogeneous platform case
As a first step, the carbonate matrix is modeled assuming that it is completely homogeneous and isotropic, so as to
Fig. 2. (A) Two-dimensional mesh of the carbonate domain; (B) boundary conditions: oceanic temperatures, salinities, and hydrostatic pressures are assigned on the reef flank and at the surface (respectively, Tocean(z), Socean(z), Pocean(z), Tsurface, Ssurfaceand Psurface5 Patmosphere. Zero
flux conditions (i.e.¹WV·nW 5 0, 2l T·nW 5 0, 2¹W D⇒¹WS nW 5 0) are imposed at the bottom and across the central symmetry axis except a
geothermal fluxG at the lower boundary (G 5 2l T nW).W¹
Table 1. Numerical values of the physical parameters. Symbol Numerical value
g r0 K l rmCpm rwC *pw b f g De aL aT 9.81 m s22 1,000 kg m23 1024m s21 3 J s21m218C21 4.193 106J m238C21 4.193 106J m238C21 2.13 10248C21 10 % 7.23 1024— 1029m2s21 200 m 40 m
*Heat capacities of the porous medium and of the water were identically chosen for simplification. This has no impact on the steady-state regime. identify the main governing parameters of the system. Sa-linity is not taken into account, either in this section or in the calculations of the next section.
The first calculation is made with no coupling between hydraulic and thermal regimes (b 5 0, Ra 5 0). Velocities are zero throughout the carbonate body, and heat transfers are purely diffusive. The outermost section of the platform is cooled by the ocean with more or less vertical isotherms (Leclerc et al. 1998), whereas most of the platform is heated by the geothermal flux, with horizontal isotherms and tem-perature increasing with depth. This temtem-perature field does not fit the temperature measurements made in bore holes in
Mururoa, where temperatures decrease with depth until the top of the volcanic rocks is reached (Guille et al. 1993).
When thermohydraulic coupling is taken into account, in-ward and upin-ward circulations occur (Fig. 3A). The cold oce-anic temperature profile disturbs the thermal field much fur-ther inside the platform by means of convective transfer. In this case, the temperature gradient becomes negative at the periphery of the platform but not in the central part, because the velocities in this region remain very low. A significant proportion (22%) of the water penetrating the platform base through the flanks seeps back out to the ocean through the upper part of the flanks. At the level of the thermocline, a high temperature gradient zone, higher velocities are ob-served, both inward and outward. This feature is particularly important when mass and chemical budgets are computed.
The flow with coupling (Fig. 3A) is driven by tempera-ture-induced density gradients. The ocean cools the periph-ery of the platform, while the central part is heated up, not only by the geothermal flux but also by the warm surface temperature (288C). These boundary conditions make the system unconditionally unstable (Ormond and Genthon 1993; Catalgirone and Bories 1985) and lead to a convection cell for any value of the Rayleigh number, i.e. warm water at the center is lighter, moves upward by buoyancy, and is replaced by cold oceanic water circulating laterally. Al-though most hydrological studies of natural systems attribute the circulation to the geothermal flux, the combination of the cold outer boundary conditions and the inner heat sources, geothermal flux from below, and heat supply from the
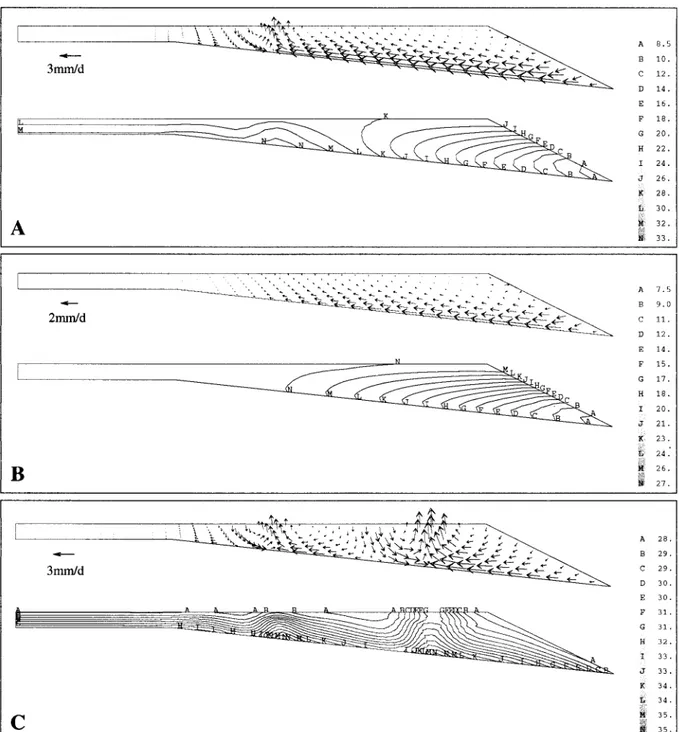
sur-Fig. 3. Simulated velocity and temperature fields for a hydraulic conductivity K5 1024m s21, (A) with both a geothermal heat flux
and an oceanic vertical temperature gradient, (B) with a zero geothermal flux condition, (C) with a uniform oceanic thermal boundary condition. The length of the arrows is proportional to the Darcy velocity. The letter for each isotherm refers to a temperature defined on the scale at the right hand side of the figure.
face is the actual cause of the flow. Each factor is sufficient to maintain its own convection cell. Figures 3B and C give velocity and temperature fields in the two cases: zero geo-thermal flux in Fig. 3B and uniform oceanic temperature with a geothermal flux in Fig. 3C. Velocities in both cases are on the same order of magnitude and globally directed inward, even though internal convection cells can be seen in both thermal and velocity fields in Fig. 3C (geothermal flux only). The geothermal flux accelerates the flow; the net
in-ward mean flow rate per unit of surface through the atoll flank is 4.4 3 1029 m s21 with a zero geothermal flux and
8.6 3 1029 m s21 with a flux of 75 mW m22, i.e. the heat
flux almost doubles the flow rate in the case of a homoge-neous platform. Without any geothermal flux, the negative temperature gradient, found in field data, is well depicted, which shows that the ocean temperature profile maintains a strong influence on the platform thermal regime. With the additional geothermal flux, a positive temperature gradient
Fig. 4. Velocity and temperature fields for different hydraulic conductivities: K5 1023m s21(A) and K5 1025m s21(B). The length
of the arrows is proportional to the Darcy velocity. In case A, the maximum velocity is 9 mm d21, whereas it is only 0.8 mm d21in case
B. These figures should be compared to the maximum velocity of 3 mm d21obtained for K5 1024m s21(see Fig. 3A).
is obtained. This does not correspond to the measurements, pointing to the limits of the homogeneous model.
The coupling between the thermal and hydraulic fields depends on the hydraulic conductivity K because the Ray-leigh number, Ra, is proportional to K. Figures 4A and B illustrate velocity and temperature fields with K 5 1023 m
s21(Ra3 10) and K 5 1025m s21(Ra/10). When the
Ray-leigh number is multiplied by 10, the velocities are much greater. The region of the platform where the temperature gradient is positive is restricted to the very central part, and convection cells are seen even in this area, due to the high Rayleigh number. Conversely, when K is divided by 10, the velocities are smaller, and the isotherms are less affected.
In summary, these results with a homogeneous reef show that density-driven flows occur inside atoll carbonate plat-forms, in agreement with previous work by Samaden et al. (1985) and Henry et al. (1996). These flows result from the thermal boundary conditions (assigned temperatures and geothermal flux) and from coupling between hydraulic and thermal regimes. However, whereas the homogeneous model is a first step in understanding the main physical phenomena, it fails to reproduce temperature profiles similar to field data.
Influence of a high hydraulic conductivity karst feature
The long history of atoll islands (several million years) means that they are subject to deep diagenetic modifications (dissolution, cementation, dolomitization, etc.). In Mururoa and Fangataufa atolls, field observation and geological cor-ing show two karstic layers (Buigues 1982; Guille et al. 1993): one at the calcite-dolomite interface and one at the base of the dolomite layer, just above the carbonate-basalt transition zone. Because of its special position and its greater thickness, the latter layer plays a key role in the hydrological behavior of this system.
In the following, this karstic layer is modeled as a high hydraulic conductivity, 50-m-thick, porous layer. Its actual hydraulic conductivity is unknown, but an order of magni-tude value can be estimated. As large metric voids are ex-pected, the validity of Darcy’s law approach in this layer must be verified. Freeze and Cherry (1979) and De Marsily (1981) set the limits on the Darcian approach using a simple criterion, specifically the Reynolds number for porous me-dia. This number depends on the Darcy velocity U, fluid
Fig. 5. Velocity and temperature fields obtained with a karstic layer added at the base of the carbonate platform (hydraulic conductivities
K5 1024m s21in the carbonate platform and K5 1 m s21in the karstic layer). The longest arrows in the karstic layer correspond to a
velocity of 4 mm d21. The letter for each isotherm refers to a temperature defined on the scale at the right hand side of the figure.
Fig. 6. Velocity variation in the karstic layer with the logarithm of the hydraulic conductivities ratio. The hydraulic conductivity of the carbonate body is kept constant while the conductivity of the karstic layer is increased, showing that the velocity through the system reaches an asymptotic value.
density r, fluid viscosity m, and the average pore diameter
l, i.e.
Url Re5 .
m
The flow is laminar and Darcian if Re is below a value of between 1 and 10. Between 10 and 100, a laminar, nonlinear transition regime occurs in which Darcy’s law is no longer valid. Above 100, the flow is turbulent. Velocities obtained in the karstic layer in the following study are never higher than 6 3 1027 m s21 whatever the karst hydraulic conduc-tivity; thus, the maximum Reynolds number is on the order of Re 5 (6 3 1027 3 1000 3 1)/(1023) 5 0.6, indicating Darcian flow.
In the reference case of a homogeneous platform, the highest velocities are observed at the base of the platform.
Adding a more permeable layer at this location helps oceanic water penetrate the atoll more easily (Fig. 5). Velocities in-crease with karst hydraulic conductivity until an asymptotic state is reached (Fig. 6). In fact, transmissivity that is the product of hydraulic conductivity and flow width is the crit-ical parameter (Leclerc et al. 1998). As water enters the karstic layer and then flows upward into the massive car-bonate, the system is equivalent to two porous media that are connected in series, and the domain with the lowest transmissivity controls the flow in both domains. Once the transmissivity of the karst is greater than that of the carbon-ate body, any increase in its hydraulic conductivity will have no further effect on either the velocity or temperature field. The platform region with negative vertical temperature gradient widens progressively with hydraulic conductivity, indicating that convective heat transfer is effective on a larg-er scale (Fig. 7). For a karst hydraulic conductivity above approximately 1021 m s21, the isotherms are horizontal and
negative vertical temperature gradients occur in the whole domain, which matches the field data. This means that the hydraulic conductivity of the lower karst in Mururoa is equal to or greater than this critical value.
Furthermore, the occurrence of the karstic layer implies that the flow rate in the platform is independent of the car-bonate body hydraulic conductivity. When the nominal per-meability K 5 1024m s21 is multiplied by 10 in the CAS-TEM 2000 simulations, the flow rate reaching the atoll surface remains almost unchanged (increased by a factor of 1.04). The physical explanation is quite straightforward: if the hydraulic conductivity is low, it controls the velocity in the system, but when the hydraulic conductivity increases, the velocity increases until it reaches a maximum value for which the weight of the water columns inside and outside the reef are equal (horizontal isothermal lines). At this stage, any further increase in the hydraulic conductivity of the sys-tem will have no effect on the velocity. The existence of this asymptotic behavior is important because it means that it will be possible to derive an upper limit for the nutrient transport from the deep ocean to the surface of the platform, whatever the uncertainty in the hydraulic conductivity of the system.
Fig. 7. (A) Mururoa atoll vertical temperature profiles measured in the ocean (A1), in bore holes under the atoll rim (A2), and under the lagoon (A3) (after Guille et al. 1993). (B) Computed vertical temperature profiles for different values of the karst hydraulic con-ductivity, keeping a platform hydraulic conductivity of 1024m s21:
(B1) oceanic temperature profile used in the simulations; B2) ulated temperature profile with a homogeneous platform; (B3) sim-ulated temperature profile with a karstic horizon of hydraulic con-ductivity K5 1023m s21; (B4) same as B3 with K5 1022m s21
in the karstic layer; and (B5) same as B3 with K5 1021m s21in
the karstic layer.
We have seen in the previous section that the first ap-proach using a homogeneous platform does not reproduce the temperature field data; conversely, including a highly permeable zone at the base of the platform, as usually ob-served in atolls, gives better agreement between calculations and measurements. In the following, the model has fixed hydraulic conductivities of 1024 m s21 in the massive
car-bonate and 1 m s21 in the karstic layer. The latter value is
beyond the reasonable conductivity values reported for any geological system, but it yields the maximum theoretical ve-locities and flow rates through the platform, which are need-ed for our calculation of a nutrient budget.
Influence of salinity
In the above sections, the density gradients that drove the hydraulic flow resulted from temperature differences only. However, differences in seawater salinity also induce density variations. Whereas tropical ocean temperature decreases with depth, so that the density increases, salinity changes in the opposite direction, i.e. it decreases from 36 at the ocean surface to 34.5 at 800 m depth (Kessler and Monbet 1984). The latter tends to diminish water density with depth. These two effects are competitive, but temperature effects are dom-inant, and therefore, the water column is stable. However, the effect of salinity is not negligible and has to be integrated into the model in order to obtain more realistic estimates of flow rates.
As presented earlier, solute transport is governed by an
equation with diffusion, dispersion, and advection terms. Ex-perimental dispersivity values are uncertain, and measure-ments give unclear results, depending on the experimental conditions, i.e. laboratory or field measurements and de-pending on the time scale (De Marsily 1981). Field disper-sivities are up to the order of a hundred meters, and high values have been used for numerical simulations (Freeze and Cherry 1979). The values chosen for dispersivity, reported in Table 1 (aL5 200 m,aT5 40 m), are at the upper limit of realistic values within the uncertainty range of experi-mental results, while still providing solution stability.
Coupling between hydraulics and solute transport is im-plemented as in the previous configuration with a high hy-draulic conductivity karstic layer. All hyhy-draulic and thermal parameters are identical, as well as the thermal boundary conditions. The pressure assigned to the ocean side now in-cludes both temperature and salinity effects. Solute transport parameters are given in Table 1. A stratified salinity field results (Fig. 8). Temperature and velocity fields are close to those obtained with thermohydraulic coupling only. The main difference is in the distribution of the flow rates reach-ing the surface. With thermohydraulic couplreach-ing, normal ve-locities at the surface are high at the center and low else-where. The inclusion of salinity tends to attenuate the difference between normal velocities at the center and at the periphery of the platform.
The effect of including salinity is complex. If only salinity effects were considered (in the absence of temperature gra-dients), the flow would be inverted and velocities would be directed downward and outward. In such a case, solute from the high salinity surface water (S5 36) diffuses downward from the surface into the carbonate. Thus, interstitial waters at the atoll center become more saline than in the ocean and, as no thermal gradients are present to moderate this effect, interstitial waters are heavier and slip oceanward. Hence, we could imagine that salinity effects slow down the flow rate. In reality, the model shows that the flow rate is 35% higher than without salinity coupling. This means that, although the density gradient in the ocean is smaller, salinity still signif-icantly accelerates the flow. Physically, the role of salinity can be understood as follows: waters that are the least saline (i.e. the lightest) enter the platform through the deep, highly permeable layer. With unchanged temperature and velocity fields, low salinity water accumulates inside the platform, resulting in a weight imbalance between the internal and the external water columns. This disequilibrium is compensated by an increase in the velocity that cools the internal water and re-equilibrates the system.
Impact of the platform thickness
Atoll construction history closely follows sea-level chang-es. During high sea-level stands, reefs grow vertically in order to remain in the euphotic zone. During low sea-level periods, lateral accretion forms the oceanward slope (Ebren 1996). In addition, subsidence of the oceanic floor is super-imposed on the effect of sea-level evolution. Although atolls have various shapes and sizes, the average trend is a plat-form thickness that increases with atoll age. Platplat-form
thick-Fig. 8. Intensity (A) and direction (B) of the velocity field, temperature (C), and salinity (D) fields with a karstic layer. In A, the length of the arrows is proportional to the Darcy velocity. The direction of the velocities (B) clearly shows that oceanic water enters the platform mainly by the karstic layer and then moves upward through the platform toward the lagoon and partly back to the ocean. In C and D, the letter for each isoline refers to temperatures and salinities defined on the scales at the righthand side of the figure. In this reference case, the following parameters are used: thickness of 800 m, Kcarbonate5 1024m s21, Kkarst5 1 m s21, geothermal fluxG 5 75 mW m22, thermocline
and halocline withDT 5 228C and DS 5 1.5.
Fig. 9. Configurations used to study the influence of the plat-form thickness.
ness is a major parameter of atoll hydrology because it fixes the position of the porous carbonate platform with respect to ocean T and S gradients. Oceanic temperature and salinity profiles, the key driving forces for flow in atolls are rather
similar all over the tropical ocean, so that atoll thickness becomes the controlling parameter. Atoll carbonate platforms have thicknesses between a few hundred and a few thousand meters, depending on their age. This section reports on the effect of platform thickness, H, in the 100–3,200-m range.
Atoll geometry is conserved in CASTEM 2000 calcula-tions (Fig. 9), except at low values of the platform thickness. As the horizontal section in the central part of the platform is only 200 m thick for the standard platform (H5 800 m), this section disappears at H5 600 m, and the atoll geometry becomes triangular. In nature, this corresponds to a fringing reef.
Figure 10 displays the variation of the average flow ve-locity reaching the surface as a function of the height of the platform for three different values of the geothermal flux (75, 25 and 0 mW m22). The break in the three curves between
500 m and 600 m is due to the change in geometry noted earlier (Fig. 9).
thick-Fig. 10. Mean flow rate (m s21) through the reef surface as a
function of the platform thickness for different geothermal fluxes. The squares, stars and crosses correspond to the calculation points.
Fig. 11. Velocity field in the carbonate platform with two karstic horizons. The hydraulic conductivity of the upper karst is K5 1022
m s21. All other parameters are as in Fig. 8. Oceanic water entering the platform by the lower karstic layer is partially diverted to the ocean
through the upper karst. The length of the arrows is proportional to the Darcy velocity.
ness, then increases again until it reaches an asymptotic val-ue. This can be explained by the combined effects of the two thermal driving forces of the flow, the geothermal flux and the oceanic temperature gradient. CASTEM 2000 cal-culations show that the flow rate is reduced when the oceanic temperature gradient is increased because the geothermal heat flux has proportionally less influence. For low values of platform thickness (H 5 100–200 m), the temperature gradient in the ocean is low and a high circulation is main-tained by the geothermal flux. For thick platforms, the oce-anic temperature gradient, that only operates at thermocline depths (H5 100–500 m), does not play a significant role, and the flow rate reaches an asymptotic value, depending on the geothermal flux. For a 75 mW m22geothermal heat flux,
the maximum flow rate is approximately 83 1029m s21for
a platform about 4,000 m thick. This numerical value can be considered as the maximum hydraulic flow circulating in the platform for several reasons. First, atoll carbonate plat-forms are seldom more than 2,000 m thick so that the as-ymptotic value is not actually reached. In addition, a greater platform hydraulic conductivity would not significantly in-crease the velocities. Finally, the geothermal heat flux was kept constant for each of the three curves in Fig. 10, whereas in reality, it is thought to decrease with atoll age, and this would further reduce the flow rate.
Hydraulic scheme with two karsts
As explained above, Mururoa and Fangataufa atolls con-tain two karstic horizons. In the previous sections, only the main horizon, located at the base of the carbonate platform, was taken into account. The hydraulic behavior of this still simple system is now well understood; ocean water pene-trates the permeable karstic zone and moves upward through the lower hydraulic conductivity platform. The occurrence of a second karstic layer connected to the ocean is expected to modify this hydraulic regime.
The previous domain is adapted to include a second karst-ic horizon. The upper karst is located 250 m below sea level. As it is smaller and less porous than the main karst at the carbonate base, its chosen hydraulic conductivity value is smaller, i.e. K5 1022m s21. Figure 11 displays the velocity
field obtained for a 50-m-thick upper karst, located between 200 m and 250 m below sea-level.
The main karst still allows a substantial penetration of seawater into the platform, but the upper karst short circuits the flow. More than half of the flow (ø60%) moves back to the ocean through this alternative route. As the transmissiv-ity of the upper karst is higher than that of the upper car-bonate cap, its presence favors fluid exit.
The geometrical and hydrological characteristics of the upper karst influence the flow reaching the surface. In par-ticular, its position within the platform, referenced to the distance between the top of the karst and the sea surface, is one of the parameters. Figure 12 shows the flow rate reach-ing the surface in relation to the position of the upper karstic layer, keeping the same width and the same hydraulic con-ductivity. The karst is inclined downward, toward the ocean, proportional to its distance to the surface. The flow rate is minimal when the upper karst is around 200 m below sea level. When the upper karst is closer to the base of the plat-form, the flow rate circulating through this karst is lower, and the corresponding water supply to the atoll surface in-creases proportionately. The upper limit of the flow rate in the lagoon (3.15 3 1029 m s21) is reached when the upper
and lower karsts join.
When the upper karst is close to the surface, the flow rate also increases. A smaller proportion of the flow is diverted through the upper karst. This can be explained by looking at the directions of the velocities (Fig. 8) for the standard case with only one karstic layer when both temperature and salinity effects are considered. In the middle of the platform, a few hundred meters below the surface, velocities are
clear-Fig. 12. Mean flow rate (m s21) versus the position of the upper
karstic horizon. The horizontal axis indicates the distance in meters between the upper karst and the ocean surface. The upper limit of
the flow rate is reached when the upper and lower karsts coincide. Fig. 13. Typical PO and NO oceanic vertical concentration
32 2
4 3
profiles in the tropical Pacific (Bainbridge 1982).
Table 2.SP and SN fluxes relevant to reef ecosystems in mmol m22d21.
Nutrient imports and exports SN SP References
Imports
Atmospheric deposition (for remote areas) Surface tropical ocean*
10–100 1,900 0.1–0.3 300 Schlesinger (1991) Rougerie (1995)
Bacterial fixation 10,000–20,000 — Goering and Parker (1972) Webb et al. (1975) Wiebe et al. (1975) Endoupwelling (upper limit) 22 1.5 This work
Exports
Nutrient exports 1,000–20,000 0–500 Webb et al. (1975) Furnas et al. (1990)
Charpy-Roubaud et al. (1990) Pilson and Betzer (1973) Andrews and Muller (1983)
* Total nutrients available in a slab of water 0.5 m thick traveling over a 500-m-wide reef at a speed of 1 cm s21.
ly directed oceanward, whereas they are more or less vertical at the top of the platform.
In all the calculations reported in this section, the veloc-ities in the upper karst are directed oceanward, so that the upper karst always deprives the reef surface of a significant portion of the flow. Transport of chemical species can be modified profoundly by this short-circuited circulation.
Nutrient fluxes
The nutrient budget of the reef ecosystem is still in debate. Our aim in this section is to apply the CASTEM 2000 model to estimate the upper limit of nutrient supply by interstitial circulation within the reef and discover whether it is signif-icant compared to the net nutrient export. As we saw in the previous section, the introduction of a second karstic layer
results in a deviation of a significant part of the upward flow. Therefore, our standard configuration with only one karstic layer at the base of the carbonate edifice maximizes the nu-trient supply to the surface ecosystem.
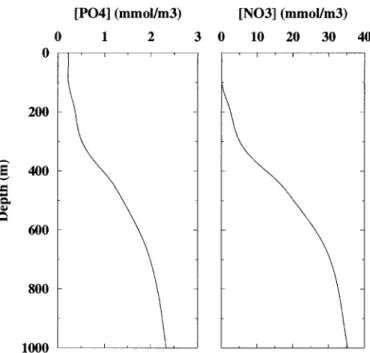
Ocean surface concentrations of nutrients (N and P) seem, at first, too low to maintain the biological productivity of the surface ecosystem that, in fact is a net exporter of nitro-gen to the ocean (Table 2). However, deeper ocean layers, below 500 m, are much richer. Figure 13 shows typical NO and PO2 32 concentrations in the Tropical Pacific ocean
3 4
from the Geosecs program (Bainbridge 1982). From an early suggestion of hydraulic upward circulations, Rougerie and Wauthy (1993) hypothesized that nutrients could be trans-ported upward from the mid ocean layers through the car-bonate platform (endoupwelling concept). This explanation was challenged by Tribble et al. (1994), who argued that the
Fig. 14. Simulated PO32and NO concentration fields (in mmol m2 23) for the reference case (see Fig. 8). The letter for each isoline
4 3
refers to a value defined on the scale at the right hand side of the figure.
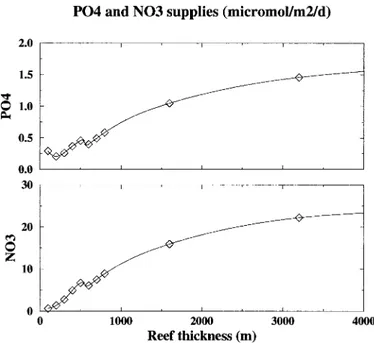
Fig. 15. Calculated PO32and NO supply to the reef surface,2
4 3
expressed inmmol m22d21, versus the carbonate platform thickness
(in meters).
reef ecosystem does not require large extraneous nutrient fluxes and that its production can be balanced by the uptake of nutrients from ocean surface water (even though oligotro-phic), nitrogen fixation, and efficient recycling. High
con-centrations of nutrients in interstitial waters, one of the main arguments in favor of the endoupwelling hypothesis, could simply be the result of organic matter remineralization. However, as inward and upward circulations do occur in the carbonate platform, as demonstrated above, they will carry nutrients up to the surface ecosystem. This is all the more important as ocean nutrient concentrations are relatively high at the depth where circulating waters enter the reef at the base of the carbonate platform. Nevertheless, the occurrence of this phenomenon does not automatically ensure the nec-essary nutrient supply to the surface ecosystem.
The velocity fields obtained in the previous calculations are now used to solve the inert transport (convection–dif-fusion–dispersion) of PO32 and NO using CASTEM 2000.2
4 3
Figure 14 gives PO32and NO concentration fields in mmol2
4 3
m23 for the standard case (thickness of 800 m, thermocline
and halocline, G 5 75 mW m22, DT 5 228C, DS 5 1.5,
Kcarbonate 5 1024 m s21, Kkarst 5 1 m s21). Interstitial waters
have average nutrient concentrations of 1.7 mmol m23
PO32 and 25.6 mmol m23 NO , which shows a significant2
4 3
enrichment compared to seawater; the average concentra-tions would be, respectively, 0.64 mmol m23and 7.3 mmol
m23if pore water was normal seawater.
In a previous section, the flow rate was determined as a function of the platform thickness. Figure 15 gives the cor-responding supply ofPO32and NO to the surface (in2 mmol
4 3
m22 d21) versus the thickness of the platform. The jump at
600 m corresponds to the change in geometry (from a fring-ing reef to a barrier reef) that was noted earlier.
in-creases with platform thickness, even though the flow rate per square meter at the surface decreases (Fig. 10) because the enrichment in nutrients with depth is sufficient to coun-terbalance the slight decrease in hydraulic flow rate. For thicker platforms, the total supply in nutrients regularly fol-lows the flow rate increase. The total supplies of nutrients for the standard case (800 m thick) are, respectively, 4.053 1022 mmol s21for PO32 and 6.2 3 1021mmol s21 for NO2
4 3
for the whole reef surface, corresponding to fluxes of 0.6
mmol m22 d21and 8.9 mmol m22 d21, respectively. The
nu-trient supply corresponding to the maximum hydraulic flow rate estimated previously for a 3,200-m-thick platform is 1.5
mmol m22 d21 for phosphate and 22.2 mmol m22 d21 for
nitrate. Table 2 summarizes the nutrient budget for the sur-face ecosystem. Bacterial fixation appears as the major source of nitrogen with an order of magnitude consistent with the exports figures. The figure corresponding to the ocean supply is the amount of nutrients in a surface seawater slab, 0.5 m thick, circulating above a reef flat, 500 m wide, at a velocity of 1 cm s21 and with concentrations of 0.35
mmol m23ofSP and 2.2 mmol m23ofSN (Rougerie 1995). These figures suggest that the surface ocean has the capa-bility of being the main source of phosphate, although they are merely indicative, as this nutrient stock is only poten-tially available to the ecosystem.
The major conclusion of this numerical study is that the input of nutrients due to the endoupwelling process is far too low to play a significant role in the nutrient budget of atolls. Even assuming unrealistically high hydraulic conduc-tivity does not help boost the nutrient supply, as the velocity rapidly reaches an asymptotic value.
However, these fluxes are sufficient to bring enough mag-nesium over geological time to explain dolomitization. Mod-eling inert transport of magnesium (53 mol m23in the ocean)
with a carbonate porosity of 10% suggests that the quantity of magnesium necessary to dolomitize an 800-m-thick plat-form is delivered in 0.8 million years. This figure is fully compatible with geological time constraints.
Conclusion and summary
This modeling study shows that inward and upward cir-culation of water of oceanic origin occurs through the mas-sive carbonates of atoll platforms. Consistency between neg-ative temperature gradients, measured interstitial waters compositions, and calculated thermal profiles is obtained when a karstic permeable layer is included at the base of the calcareous edifice in the model. Salinity increases flow rates by 35% over the case with no salinity effects. The study also shows that platform thickness is one of the parameters con-trolling the hydraulic velocities. When the growth of an atoll is simulated, increasing platform thickness beyond the depth of the ocean thermocline produces increasing velocities, and these tend toward an asymptotic value.
The hydrology of the platform is very sensitive to hetero-geneities. When a second highly permeable layer is included in the model, a significant proportion of the flow entering the platform through the lower karstic horizon is diverted back to the ocean through this upper horizon.
An upper limit on the nutrient supply to the surface can be calculated by our model. With no prejudice either in favor of or against the endoupwelling hypothesis, the conclusion of our study is that they quantitatively fail to bring an amount of nutrients to the surface ecosystem that is signif-icant in its nutrient budget, although hydraulic circulations are sufficient to explain dolomitization on geological time scales.
References
ANDREWS, J.,ANDH. MULLER. 1983. Space–time variability of nu-trients in a lagoonal patch reef. Limnol. Oceanogr. 28: 215– 227.
BAINBRIDGE, A. E. 1982. Geosecs. Pacific expedition, v. 3: Hydro-graphic data. National Science Foundation, Washington, D.C. sta. 265.
BUDDEMEIER, R. W.,AND G. HOLLADAY. 1977. Atoll hydrology: Island groundwater characteristics and their relationship to dia-genesis, p. 167–173. In Third International Coral Reef Sym-posium. I.S.R.S., Miami.
,ANDJ. A. OBERDORFER. 1986. Internal hydrology and geo-chemistry of coral reefs and atoll islands: Key to diagenetic variations, p. 91–111. In J. Schroeder and B. Purser [eds.], Reef diagenesis. Springer Verlag.
, AND . 1988. Hydrogeology and hydrodynamics of coral reef pore waters, p. 485–490. In Proceedings of the 6th International Coral Reef Symposium, v. 2. Australia.
BUIGUES, D. 1982. Se´dimentation et diagene`se des formations car-bonate´es de l’atoll de Mururoa (Polyne´sie Franc¸aise). Ph.D. thesis, Universite´ de Paris-Sud.
. 1997. Geology and hydrogeology of Mururoa and Fanga-taufa, French Polynesia, p. 433–451. In H. L. Vacher and T. M. Quinn [eds.], Geology and hydrogeology of carbonate is-lands. Developments in sedimentology 54, chapter 13. Elsevier. CATALGIRONE, J.,ANDS. BORIES. 1985. Solutions and stability cri-teria of natural convective flow in an inclined porous layer. J. Fluid Mechanics 155: 267–287.
CHARPY-ROUBAUD, C., L. CHARPY,ANDJ. CREMOUX. 1990. Nutri-ent budget of the lagoonal waters in an open cNutri-entral South Pacific atoll (Tikehau, Tuamotu, French Polynesia). Mar. Biol.
107: 67–73.
CHAVENT, G.,ANDJ. E. ROBERTS. 1991. A unified physical presen-tation of mixed, mixed hybrid finite elements and standard fi-nite difference approximations for the determination of veloc-ities in waterflow problems. Adv. Water Resources 14: 329– 348.
DABBENE, F. 1998. Mixed-hybrid finite elements of transport of pol-lutants by underground water. In 10th International Conference of Finite Elements in Fluids. Tucson, Arizona.
DEMARSILY, G. 1981. Hydroge´ologie quantitative. Masson. EBREN, P. 1996. Impact des variations rapides du niveau marin sur
le de´veloppement des atolls au Quaternaire: Mururoa (Poly-ne´sie Franc¸aise). Dynamique re´cifale et diagene`se des carbon-ates. Ph.D. thesis, Universite´ de Provence.
FANNING, K. A., R. H. BYRNE, J. A. BRELANDII, P. R. BETZER, W. S. MOORE, R. J. ELSINGER,ANDT. E. PYLE. 1981. Geothermal springs of the West Florida continental shelf: Evidence for do-lomitization and radionuclide enrichment. Earth Planet. Sci. Lett. 52: 345–354.
FREEZE, R. A., AND J. A. CHERRY. 1979. Groundwater. Prentice-Hall.
FURNAS, M., A. MITCHELL, M. GILMARTIN, AND N. REVELANTE. 1990. Phytoplankton biomass and primary production in
semi-enclosed reef lagoons of the central Great Barrier Reef, Aus-tralia. Coral Reefs 9: 1–10.
GOERING, J.,ANDP. PARKER. 1972. Nitrogen fixation by epiphytes
on sea grasses. Limnol. Oceanogr. 17: 524–531.
GUILLE, G., G. GOUTIE` RE, AND J. SORNEIN. 1993. Les atolls de Mururoa et de Fangataufa, v. I. Ge´ol. Pe´trol. Hydroge´ol. Mas-son.
HENRY, P., C. GUY, P. DUDOIGNON, J. SORNEIN,ANDY. CARISTAN. 1996. A convective model of water flow in Mururoa basalts. Geochim. Cosmochim. Acta 60: 2087–2109.
HERMAN, M. E., R. W. BUDDEMEIER, AND S. W. WHEATCRAFT. 1986. A layered aquifer model of atoll island hydrology: Val-idation of a computer simulation. J. Hydrol. 84: 303–322. KESSLER, M.,AND Y. MONBET. 1984. Centrale ETM. Avant-projet
Tahiti. Re´sultats des e´tudes de site. Technical report, V. 1, p. 439 and 454. IFREMER/DIT.
KOHOUT, F. A. 1967. Ground-water flow and the geothermal regime of the Floridan plateau. Trans. Gulf Cost Assoc. Geol. Soc. 17: 339–354.
LECLERC, A.-M., D. BROC, P. JEAN-BAPTISTE, AND J. RANCHER.
1998. Steady-state intertitial circulations in an idealized atoll reef and tidal transients in a deep borehole by computer sim-ulation, p. 249–259. In G. F. Camoin and P. J. Davies [eds.], Reefs and carbonate platforms in the Pacific and Indian oceans, v. IAS Spec. Publs. 25. Blackwell Science.
MILLERO, F. J.,ANDA. POISSON. 1981. International one-atmosphere equation of state of seawater. Deep-Sea Res. 28A: 625–629. MOSE´, R., P. SIEGEL, P. ACKERER,ANDG. CHAVENT. 1994.
Appli-cation of the mixed hybrid finite element approximation in a groundwater flow model: Luxury or necessity? Water Resourc-es RResourc-es. 30: 3001–3012.
OBERDORFER, J. A., P. J. HOGAN, ANDR. W. BUDDEMEIER. 1990.
Atoll island hydrogeology: Flow and freshwater occurrence in a tidally dominated system. J. Hydrol. 120: 327–340. ORMOND, A.,ANDP. GENTHON. 1993. 3-D thermoconvection in an
anisotropic inclined sedimentary layer. Geophys. J. Int. 112: 257–263.
PAILLE` RE, H., AND F. DABBENE. 1997. Initiation a` la simulation nume´rique en me´canique des fluides a` l’aide de
CAS-TEM2000. Recueil d’exemples commente´s. Technical Report DMT 97/308, CEA/DRN/DMT.
PILSON, M.,AND S. BETZER. 1973. Phosphorus flux across a coral
reef. Ecology 54: 581–588.
ROUGERIE, F. 1995. Nature et fonctionnement des atolls des
Tua-motu (Polyne´sie Franc¸aise. Oceanol. Acta 18: 61–78. ,ANDB. WAUTHY. 1986. Le concept d’endo-upwelling dans le fonctionnement des atolls-oasis. Oceanol. Acta 9: 133–148. , AND . 1993. The endo-upwelling concept: From
geothermal convection to reef construction. Coral Reefs 12: 19–30.
SAMADEN, G., P. DALLOT,ANDR. ROCHE. 1985. Atoll d’Eniwetok. Syste`me ge´othermique insulaire a` l;e´tat naturel. La Houille Blanche 2: 143–151.
SCHLESINGER, W. 1991. Biogeochemistry, an analysis of global change. Academic Press.
SORNEIN, J., AND C. GUY. 1993. Hydro-ge´ochimie et circulation naturelle dans un atoll. Rev. Sci. Tech. Direct. Appl. Militaires
7: 37–47.
STRAUS, J. M. 1974. Large amplitude convection in porous media. J. Fluid Mechanics 64: 51–63.
SWARTZ, J. 1958. Bikini and nearby atolls, Marshall Islands. Geo-thermal measurement on Enewetak and Bikini atolls. U.S. Geol. Surv. Prof. Paper 260U: 711–739.
TRIBBLE, G., M. ATKINSON, F. SANSONE,ANDS. SMITH. 1994. Reef metabolism and endo-upwelling in perspective. Coral Reefs
13: 199–201.
UNDERWOOD, M. R., F. L. PETERSON, AND C. I. VOSS. 1992. Groundwater lens dynamics of atoll islands. Water Resources Res. 28: 2889–2902.
WEBB, K., W. DUPAUL, W. WIEBE, W. SOTTILE,ANDR. JOHANNES. 1975. Enewetak (Eniwetol) Atoll: Aspects of the nitrogen cycle on a coral reef. Limnol. Oceanogr. 20: 198–210.
WHEATCRAFT, S. W.,AND R. W. BUDDEMEIER. 1981. Atoll Island hydrology. Ground Water 19: 311–320.
WIEBE, W., R. JOHANNES, AND K. WEBB. 1975. Nitrogen fixation
in a coral reef community. Science 188: 257–259.
Received: 4 December 1997 Accepted: 22 February 1999 Amended: 15 March 1999