HAL Id: hal-02930778
https://hal.uca.fr/hal-02930778
Submitted on 10 Nov 2020
HAL is a multi-disciplinary open access archive for the deposit and dissemination of sci-entific research documents, whether they are pub-lished or not. The documents may come from teaching and research institutions in France or abroad, or from public or private research centers.
L’archive ouverte pluridisciplinaire HAL, est destinée au dépôt et à la diffusion de documents scientifiques de niveau recherche, publiés ou non, émanant des établissements d’enseignement et de recherche français ou étrangers, des laboratoires publics ou privés.
In-situ measurements of magmatic volatile elements, F,
S, and Cl, by electron microprobe, secondary ion mass
spectrometry, and heavy ion elastic recoil detection
analysis
Estelle Rose-Koga, Kenneth Koga, Jean-Luc Devidal, Nobumichi Shimizu,
Marion Le Voyer, Célia Dalou, Max Döbeli
To cite this version:
Estelle Rose-Koga, Kenneth Koga, Jean-Luc Devidal, Nobumichi Shimizu, Marion Le Voyer, et al.. In-situ measurements of magmatic volatile elements, F, S, and Cl, by electron microprobe, secondary ion mass spectrometry, and heavy ion elastic recoil detection analysis. American Mineralogist, Min-eralogical Society of America, 2020, 105 (5), pp.616-626. �10.2138/am-2020-7221�. �hal-02930778�
High precision in-situ measurements of volatile F, S and Cl by electron 1
microprobe, secondary ion mass spectrometry, and elastic recoil detection 2
analysis: a comparative study with application to melt inclusions 3
4
Estelle F. Rose-Koga1, Kenneth T. Koga1, Jean-Luc Devidal1, Nobumichi Shimizu2, 5
Marion Le Voyer3, Celia Dalou4, Max Döbeli5. 6
(1) Université Clermont Auvergne, CNRS UMR6524, IRD, OPGC, Laboratoire Magmas et Volcans,
7
F-63000 Clermont-Ferrand, France
8
(2) Woods Hole Oceanographic Institution, Dpt Geology & Geophysics, MA, USA
9
(3) Smithsonian Institution, National Museum of Natural History, PO Box 37012, MRC 119,
10
Washington, DC 20013, USA
11
(4) Centre de Recherches Pétrographiques et Géochimiques, UMR7358, CNRS - Université de
12
Lorraine, BP20, 54501 Vandoeuvre-lès-Nancy Cedex, France
13
(5) Laboratory for Ion Beam Physics, ETH Zürich, Zürich, Switzerland
14 15 16
Abstract 17
Electron probe and ion probe are the two most used instrument for in situ analysis of 18
halogens in geological materials. The comparison of these two methods on widely 19
distributed glass standards (ex: MPI-DING) is needed. We report analyses of F, S and 20
Cl concentrations in 3 geological glass samples (EPMA) and 10 referenced standards 21
(EPMA and SIMS). F and Cl absolute abundances have been determined 22
independently for three of the standards (ML3B-G, ATHO-G and KE12), via elastic 23
recoil detection analysis (ERDA), to certify the accuracy of the cross-calibration 24
EPMA-SIMS. The detection limits for EPMA are a 150 µg.g-1 for F, 20 µg.g-1 for S 25
and Cl and for SIMS < 48 µg.g-1 for F, < 3 µg.g-1 for S and <19 µg.g-1. On SiO2-26
rich glass-standards, F and Cl measurements by ERDA highlight a matrix effect 27
during SIMS analysis of F and Cl. With the ERDA independantly measured value, we 28
therefore propose an alternative calibration function to correct this matrix effect on 29
the SIMS measurements of F, S and Cl. The application of F and Cl measurements on 30
arc melt inclusions shows that over a wide range of H2O degassing, F/Cl remains 31
constant for a given series of inclusions from a single volcano, suggesting F/Cl ratios 32
are unchanged during volcanic degassing. 33
34
Keywords: F, Cl, SIMS, EPMA, ERDA, melt inclusion 35
36
Introduction 37
The behavior of trace volatile elements (magmatic volatile components other 38
than H2O and CO2) in magmas has inspired many scientific contributions in the past 39
decades (e.g. Baker et al., 2005; Wallace, 2005; Behrens and Gaillard, 2006; Fischer, 40
2008; Aiuppa et al., 2009 and reference therein). For an extensive review of the 41
interest of halogens in Earth Sciences see Hanley and Koga, 2018 (in special volume 42
by Harlov and Aranovich, 2018 and reference therein). In short, the interests go from 43
partition coefficients of F, Cl and S between minerals and melt or fluid (e.g. Dalou et 44
al., 2012; Zajacz et al., 2012; Bernini et al., 2012; Wu and Koga, 2013; Van den 45
Bleeken & Koga, 2015; Kusebauch et al., 2015; Joachim et al., 2017; Iveson et al., 46
2018), to tackling mantle source compositions of these elements using melt inclusions 47
(e.g. Straub et al., 2003; Bouvier et al., 2010; Le Voyer et al., 2010; Helo et al., 2012; 48
Rose-Koga et al., 2012, 2014, 2017; Métrich et al., 2014; Cabral et al., 2014; Hartley 49
et al., 2014; Jackson et al., 2015a) or using glasses (e.g. Kendrick et al., 2012; 50
2014a,b; 2015; Jackson et al., 2015b) or minerals (olivine: Broadley et al., 2019), to 51
measuring the diffusion rate of volatile elements to assess magma ascent rates (e.g. 52
Llyod et al., 2014; Ferguson et al., 2016; Ruth et al., 2018) and assessing magma 53
degassing (e.g. Bureau et al., 2000; Edmonds et al., 2001; Balcone-Boissard et al., 54
2010). 55
Bulk method for determining F and Cl contents in geological samples have improved 56
through the years and pyrohydrolysis followed by ion chromatography have improved 57
to reach detection limits of 0.2µg.g-1 (Michel and Villemant, 2003) even 0.1µg.g-1 58
(Blacone-Boissard et al., 2009), which remains a factor of 10 to 30 better than that 59
reported later with the same analytical tehnic by Marks et al. (2016; 10-20µg.g-1 for F 60
and 20-30µg.g-1 for Cl). Here we want to compare in-situ analytical technics for F 61
and Cl measurements because the study of smaller and smaller geological samples are 62
requiring intercalibration and comparison of the technics to make an educated 63
decision on which one to use to achieve the goal we have. 64
With recent advances of micro analytical techniques and melt inclusion studies, there 65
is a growing body of concentration measurements of relatively volatile, light-atomic-66
mass elements (H, B, C, F, S, Cl) in MORB glasses and primitive melts of subduction 67
zone magmas (e.g. Sisson and Layne 1993; Métrich et al. 1999; Hauri et al., 2002; 68
Wade et al. 2006; Le Voyer et al. 2008, 2010; Bouvier et al., 2008; Rose-Koga et al. 69
2012; see also references in Wallace 2005). Other volatile element, moderatly heavier, 70
such as Br have also been successfully measured by secondary ion mass spectrometry 71
(Cadoux et al., 2017). While C and H and to a lesser extend S are likely to suffer 72
degassing (Dixon et al. 1995), halogens such as F and Cl (and probably Br) are often 73
under-saturated in these primitive basaltic melts, indicating that they did not 74
experience any degassing or fractionation event (e.g. Carroll and Webster 1994; 75
Bucholz et al., 2013). 76
Among the difficulties contributing to the limited comparison of the preexisting data, 77
was, suprisingly, the lack of published comparison of S, Cl and F measurements of 78
standards between the two most used in situ analytical procedures: electron 79
microprobe (EPMA) and the ion probe (SIMS). Recently, a F, S and Cl comparison 80
between literature data obtain by EPMA and by SIMS (Le Voyer et al., 2019) 81
concluded that inter-laboratory comparisons agreed within 10% for F and to a variable 82
degree for S and Cl, and propose a quality controlled published-data summary table 83
(Table S2 available through the EarthChem Library, 84
http://dx.doi.org/10.1594/IEDA/111195). 85
Electron microprobes perform microanalysis of volatile elements, but the high 86
detection limits of this technique (tens to hundreds of ppm) place limitations on many 87
volatile studies (cf. Devine et al. 1995 and references therein). After a study 88
improving the F measurement by EPMA (Zhang et al., 2016), the inter-calibration of 89
EPMA and SIMS is timely and echoes conference abstracts about this recurrent 90
subject (e.g. Rose-Koga et al., 2008; Guggino and Hervig, 2010). This will be the 91
basis to push further the investigations for example of the degassing processes via 92
experimental approach and in situ melt inclusion studies. Also it is noted that F, S, 93
and Cl are among elements that LA-ICPMS can not measure (for measurements of 94
major elements in melt inclusions by LA-ICPMS and intercalibration with EPMA and 95
SIMS, see Pettke et al. 2004) and therefore their in-situ measurements in small 96
objects such as melt inclusions rely solely on the development of their measurements 97
by EPMA and SIMS, and their intercalibration. 98
Volatile-rich magmas are generally those of subduction zones. The current consensus 99
is that arc magmatism is triggered by a flux, of either a volatile-rich fluid, or a silicate 100
melt, derived from the subducting lithosphere (e.g. Gill 1981; Tatsumi and Eggins 101
1995), or a fluid somewhere between the two and termed supercritical fluid (Shen and 102
Keppler 1997; Bureau and Keppler 1999; Stalder et al. 2000). A large number of 103
observations on isotopic compositions of arc lavas attest the necessity of slab flux in 104
the constitution of lavas (e.g. Tatsumi and Eggins, 1995; Hanyu et al., 2012; Narvaez 105
et al., 2018). Therefore, the nature of this flux and its interaction with solid mantle or 106
with the subducting slab determines the element fractionation processes characteristic 107
of this geodynamic setting (e.g. for Iwate volcano, Japan; Rose-Koga et al., 2014). 108
In this paper we measure F, S and, Cl by SIMS on a set of 6 glasses from the WHOI 109
standard-set (ALV519-4-1, ALV1654-3, ALV1649-3, GL03-D51-3, GL07-D52-5, 110
EN113-46D-2) to create 3 working curves. We use our 3 SIMS working curves to 111
compare our SIMS measured values of 8 MPI DING glasses (ML3B-G, KL2-G, 112
StHs6/80-G, GOR128-G, GOR132-G, ATHO-G, T1-G, KE12) and of 2 basaltic 113
standards (VG2 and VG-A99) with our EPMA values. We also report independent 114
absolute F and Cl values from elastic recoil detection analysis (ERDA) of three MPI 115
DING glasses (KE12, ATHO-G and KL2G) which independently anchors our 116
calibration curves. Finally, we give an example of application for EPMA and SIMS 117
measurements of Cl and F in melt inclusions. 118
119
Standards and glass samples 120
All glasses and standards used have already been well documented elsewhere, 121
and we summarize here the essential points. The set of 6 basalt samples used in this 122
study for the SIMS analysis come from several sources (Table 1). The ALV 123
standards are fresh basaltic glasses sampled during Alvin dives over the Famous area 124
(ALV519-4-1: Shimizu 1998; Michael and Cornell 1998), and over the Galapagos 125
Spreading Center 85ºW (ALV1654-3 and ALV1649-3; Embley et al. 1988; Perfit et 126
al. 1998). GL standards are fresh basalt glasses from the Salas y Gomez seamount 127
area (GL03-D51-3 and GL07-D52-5; Simons et al. 2002). EN113-46D-2 is a fresh 128
basaltic glass from the Endeavor spreading center (Simons et al. 2002). 129
For the other glass samples and standards we used six basalts (KL2-G, from 130
Kilauea volcano, Hawaii; ML3B-G from Mauna Loa Volcano, Hawaii; VG2, aka 131
USNM 111240/52, from the Juan de Fuca Ridge (Jarosewich 2002); VG-A99, aka 132
A99, USNM 113498/1, from Kilauea volcano, Hawaii (Jarosewich et al. 1979); Alvin 133
2746-15, from 9-10ºN East Pacific Rise (Bowles et al. 2006); Alvin 2390-5, from the 134
Siqueiros Transform, (Sims et al. 2002)), one andesite, (StHs6/80-G, Mt. St. Helens, 135
USA, Jochum et al. 2000), two komatiites, (GOR128-G and GOR132-G both from 136
Gorgona Island, Jochum et al. 2000), a rhyolite, (ATHO-G, from Iceland, Jochum et 137
al. 2000), a quartz-diorite, (T1-G, from the Italian Alps, Jochum et al. 2000), two 138
obsidians, (Sletta, from Iceland, courtesy from O. Sigmarsson; and KE12 from 139
Eburru, Kenya; personnal communication of Malik and Bungard 1974 cited in Devine 140 et al. 1984). 141 142 Analytical procedures 143 EPMA analysis 144
Electron microprobe analyses were performed with a Cameca SX 100 145
equipped with four wavelength dispersive spectrometers (WDS) at the Laboratoire 146
Magmas et Volcans (Clermont-Ferrand). Major elements and volatiles were analyzed 147
in separate analytical sessions with the following detailed conditions. Major elements 148
in glasses were analyzed at an accelerating voltage of 15 kV, an 8 nA beam current 149
and a 20µm defocused beam. These analytical conditions are well suited for glasses 150
analyses; no geochemical instability (sodium loss principally) is detected even for 151
silica rich samples (e.g. Oladottir et al. 2011). 152
Chlorine, sulfur and fluorine analyses were performed at 80 nA and with a 5 to 153
20µm defocused beam together with the trace element acquisition program proposed 154
in the Cameca Peak Sight software. This quantification model takes into account the 155
matrix composition of the glass to calculate the traces element concentration. ZAF 156
data reduction was carried out by the means of the X-PHI model. The analytical 157
standards were: natural scapolite for the ClK line, fluorite for FK and VG-2 glass 158
for SK. Sulfur concentration in VG-2 glass is 1340 µg.g-1 ; this value corresponds 159
to the average of a compilation of published data (Dixon et al. 1991; Thordarsson et 160
al. 1996; Thornber et al. 2002). 161
162
Sulfur and chlorine
163
Because sulfur speciation (S6+ or S2-) induces changes in the SK spectral position 164
(Carroll and Rutherford 1988), prior to sulfur concentration measurement and for 165
every sample, the SK peak maximum was first located by using the regular 166
automatic routine of the Cameca SX 100 software. Then, if the measured peak 167
position differs from the one of the standard, the new value is changed in the analysis 168
setup. 169
The selection of the diffraction crystals is driven by the achievements of the highest 170
peak counts to reach very low detection limits and by looking at the region of the 171
spectrum with no interfering peaks. Thus, chlorine and sulfur were analyzed 172
successively by using a Large pentaerythritol (LPET) crystal. 173
174
Fluorine
175
The case of fluorine is more complex. This element can be measured either 176
with a W/Si multilayer crystal (PC1) or with a thallium acid phthalate crystal (TAP). 177
Multilayer crystal allows high precision and accuracy measurements together with 178
low detection limits. Unfortunately, for iron-bearing minerals or glasses, the FK 179
peak is strongly overlapped by the shoulder of a strong FeL line. Different studies 180
(Todd 1996 ; Witter and Kuehner 2004) have proposed an electron microprobe 181
method for analyzing F in Fe-bearing minerals and glasses using multilayer crystals 182
that overcomes the spectral interference. This method is based on the linear 183
relationship existing between the iron concentration of fluorine-free minerals (olivine 184
and pyroxenes essentially) and the number of counts at the FKpeak position in the 185
same fluorine-free minerals. Thus, the FeL contribution (i.e. the background) can be 186
easily deduced and quantified from the total iron concentration of the sample and 187
subtracted from the bulk FKa peak counts. However, the calibration curve of this 188
model is only found for the analysis of Fe2+-bearing minerals. In transition metals of 189
the first row, the L-spectra exhibit peak position shifts as a function of the oxidation 190
state (Fialin et al. 2001, 2004). The omission of the self-absorption induced shift of 191
the L peak between Fe2+ and Fe3+ could lead to the overestimation of the background 192
counts at FKa peak position and thus to an underestimation of the fluorine content. 193
The correction method established by Witter and Kuehner (2004) should be only 194
applied for pure Fe2+-bearing minerals and glasses. In order to overcome this problem, 195
we analyzed fluorine using TAP diffraction crystals although the detector is 196
significantly less efficient than PC1. To improve its counting statistics (precision and 197
detection limit), fluorine was measured simultaneously on 3 spectrometers according 198
to the Cameca multi-spectrometers counting routine. On top of the choice of the 199
detector, we tested CaF2 and Durango apatite standards for F calibration, and
200
concluded that CaF2 provides generally consistent results, most likely due to known F
201
X-ray excitation issue of apatatite (Stromer et al., 1993). 202
203
The challenge with traces elements analysis in glass is to find a compromise 204
between low detection limit, i.e. the used of high beam current, long counting time, 205
and limited beam damages. Volatile loss during the analysis is minimized through the 206
used of a protocol derived from the CSIRO-trace routine (Robinson and Graham 207
1992). The total counting time (peak and background) for a single analysis is 40 sec 208
and is divided as follow: 10 sec on peak and background for chlorine and sulfur but 209
60 sec on peak and background for fluorine (20 sec per spectrometer). Low detection 210
limit is achieved by increasing the number of analysis on the same point, thus by 211
improving the singal-to-noise ratio. After each analysis, the beam is shielded for 20 212
sec allowing the sample to cool down. Total volatiles concentration is calculated from 213
the sum of the counts from the successive iterations. With 15 kV accelerating voltage 214
and 80 nA beam current, for a total Cl and S peak counting time of 100 sec and 600 215
sec for F. Typical detection limits for F, Cl, and S were 150, 50 and 50 µg.g-1, 216 respectively. 217 218 SIMS analysis 219
Sample preparation for SIMS
220
The standards are mounted in high purified indium metal (e.g. Hauri et al. 221
2002; Le Voyer et al. 2008) in a 1 inch diameter aluminum ring, put in ultrasound in 222
pure ethanol then in distilled water for 10 minutes, respectively. Indium is used 223
because epoxy can contain significant amounts of volatiles that can degass during the 224
analysis and increase the background signal. The mount is dried carefully in an oven 225
overnight. The mount is finally gold coated before analysis and kept overnight in high 226
vacuum (low 10-8 torrs) until being inserted in the sample chamber. 227
228
Method
229
The measurements for the working curve calibrations were done on a set of 6 230
glass standards (Table 1), on the ion probe Cameca 1280 of Woods Hole 231
Oceanographic Institution (MA, USA). We used a Kohler illumination with a primary 232
beam current of 1.5 nA Cs+ primary positive beam, and negatively charged secondary 233
ions were extracted through a nominal accelerating potential of 10 kV. Due to 234
implantation of Cs+ ions and extraction of both negatively charged secondary ions and 235
electrons, positive charging of the sample surface must be compensated with the use 236
of an electron flood gun which delivers electrons to the sample surface. The isobaric 237
interference were filtered by an energy slit opening at 50 eV and the contrast aperture 238
at the cross over was large (400 µm). The entrance and exit slits are closed to achieve 239
a mass resolution of M/M=5800. 240
We presputtered the samples surface during 180 seconds while applying a 241
raster of 30×30 µm. The field aperture (of 8000) corresponds to an area of 15×15 µm, 242
is inserted into the image plane. This means that only the ions originating from the 243
central 15 µm of the flat-bottomed sputtered-crater are admitted into the mass 244
spectrometer. The elimination of stray ions sputtered from the crater walls and 245
desorbed from the sample surface results in very low volatile backgrounds (routinely 246
about 0.05–0.1 counts per second for the counting system at half mass positions with 247
the primary beam and the electron gun on). We counted 8 sec on 19F, 5 sec on 30Si, 5 248
sec on 32S and 8 sec on 35Cl. One analysis was composed of 2 blocks of 10 cycles and 249
took less than 15 min per spot. Intensities of 19F, 32S and 35Cl were collected 250
cyclically by an electron multiplier, processed through pulse-counting electronics and 251
normalized to 30Si for concentration calculations. 252
253
Calibration
254
Earlier studies that have involved Cs+ beam were performed on small format 255
SIMS (Cameca 6f, Hauri et al. 2002). But hydride interferences, such as SH-, are 256
difficult to effectively eliminate using the energy filtering technique (Shimizu et al. 257
1978)available on small format Cameca instruments (e.g., IMS 3f/4f/5f/6f). The high 258
mass resolution of the SIMS 1280 of WHOI is required to eliminate the 34S1H 259
interference on 35Cl (MRP>5120) without giving up transmission significantly (Fig. 260
1c). The SIMS calibration curves for F, S and Cl are shown in Fig. 2. They are 261
regressions of ion probe signals (x-axis) compared to known EPMA concentrations 262
(y-axis). The former is the intensity ratio of two elements times the SiO2 263
concentrations of each standards, the numerator of the ratio being the element of 264
interest and the denominator is a matrix element common to all samples (e.g. 265
19
F/30Si). Typically, here 19F, 32S and 37Cl are normalized against 30Si. This provides a 266
robust analysis little influenced by primary beam fluctuations or by ionization 267
efficiency changes owing to matrix effects (Shimizu and Hart, 1982). In fact, the 268
calibrations for F, S and Cl are free of significant matrix effects. The calibration curve 269
is determined at the beginning and at the end of each session to assure no significant 270
drift has taken place. 271
272
Detection limit
273
With the calibration curves of the standards, one usually attributes the Y-274
intercept of the linear regression to the detection limit (e.g. Ihinger et al. 1994). This 275
methods is not accurate enough and depends on the uncertainties of the regressed 276
data, the leverage of the data for the higher concentrations being potentially 277
unreasonable. Ideally, only the measurements of standards with F, S, and Cl 278
concentrations lower than the expected background can give the detection limit (see 279
Koga et al., 2003, for this procedure during low hydrogen concentration 280
measurements by SIMS). It was not a simple task to verify ppm-level abundance, and 281
we adapted calibration without explicitly identifying zero point count rate (Table 1). 282
Some studies have used adapted “blank” material such as San Carlos olivine and 283
synthetic forsterite (Hauri et al. 2002, Le Voyer et al. 2017). With what was available 284
to us we calculated detection limits 48 µg.g-1 for F, 3 µg.g-1 for S and 19 µg.g-1 for 285
Cl (Fig. 2). These values are close to the zero intercept and considering the error on 286
the y-intercept is as large as the value itself, the linear regression of the calibration 287
curve is equivalent to forcing the regressin through zero. The slopes between forcing 288
the linear regression through zero (red curve Fig. 2) and classic linear regression (blue 289
curve Fig. 4) is identical within error. A detection limit of <1 µg.g-1 for F, S, and Cl 290
was previously reported with a 6f ion probe (Hauri et al. 2002; <2 µg.g-1 for F; 291
Guggino and Hervig 2010). With a 1280 ion probe detection limits down to 0.2 µg.g-292
1 for S and Cl, and 0.1 µg.g-1 for F can be achieved with blank standards (Le Voyer 293
et al., 2019). Our analytical standard error ( over the 20 cycles) was typically 0.6 % 294
for F, S and Cl (1% Le Voyer et al., 2019) and the reproducibility on the standards 295
(2RSD) was 6.3, 3.5 and 5.2%, respectively (n=14, ALV519-4-1; comparable to 5.8, 296
7.6 and 10.8%, respectively, on in-run standard glass P1326-2, Helo et al., 2011; 7, 4 297
and 7%, respectively on glass VG2, Le Voyer et al., 2019). 298
299
Elastic Recoil Detection Analysis (ERDA) 300
ERDA is an absolute measurement independent from the two previous 301
methods (EPMA and SIMS). Absolute because it consists of a shock between the 302
nuclei of 2 atoms and the radii of the two nuclei (for example 19F and 127I) are known 303
with great precision, and therefore the ERDA method do not require any standard to 304
perform a measurement. ERDA has previously been used to measure hydrogen in 305
geological materials (e.g. Mosbah et al., 1990; Bureau et al., 2009) or to intercalibrate 306
with infrared spectroscopy measurements (e.g. Aubaud et al., 2009; Withers et al., 307
2012). The ERDA were made at ETH Zurich, in the Ion Beam Physics laboratory of 308
the Paul Scherrer Institut. We used a primary ion beam of heavy ion 127I at 12 MeV. 309
This iodine beam was produced by EN-tandem accelerator via cesium (Cs) sputtering 310
of AgI. For lower projectile energies Time of Flight-ERDA (ToF-ERDA) is a widely 311
used technique. The analytical protocol is only briefly explained in the following, full 312
details can be found in C. Kottler et al. 2006 (and reference therein). The beam hits 313
the polished plane of the sample with a low angle and the scattered element of choice 314
(F and Cl, here) are detected by the ToF-ERDA dectector at the fixed angle of 36º. 315
The recoil masses are identified by means of a coincident measurement of the particle 316
velocity and total energy. The recoil energy for 19F is 3.5 MeV and that of 35Cl is 5.3 317
MeV. Here a gas ionization chamber (GIC) instead of silicon detectors has been used 318
for energy measurements because silicon detectors suffer from considerable radiation 319
damages. This standard-free method gives absolute F and Cl concentrations. The 320
shape of the beam on the sample is a rectangle of 1 mm × 4 mm but only a small part 321
of it was actually targeting the sample, the rest was hitting the surrounding indium. A 322
classical ERDA graph displays a time of flight curve for each ion versus energy 323
(Kottler et al. 2006). These curves are processed to extract a spectrum for each 324
elements (Fig. 3a, b, c) 325
Results 327
There is a good general agreement on mafic standards for the measurements of F, S 328
and Cl between EPMA and SIMS above a certain treshold of concentrations, >150 329
µg.g-1 for F, and >20 µg.g-1 for S and >20 µg.g-1 for Cl (Fig. 4). For F<150 µg.g-1 330
SIMS can measure differences in F concentrations with a precision better than 10% 331
relative when EPMA has a precision equal to the measured value (Fig. 4a). The 332
performance of both EPMA and SIMS are in excellent agreement for Cl 333
measurements down to 20 µg.g-1 (Fig. 4c). But for S measurements, SIMS can 334
measure S concentrations below 10 µg.g-1 when EPMA will not measure resolvable 335
difference in standards with S<10 µg.g-1 (Fig. 4b). 336
The glass standards measured here have reported value that can vary up to a factor of 337
10 for certain elements (ex: Cl in StHs6/80; Table 2). Nonetheless, overall we note 338
that technical improvement of in-situ instruments make it possible to reach 339
interlaboratory agreements. Our EPMA and SIMS measurements most of the time 340
agree within error with the reported values published since 2006 (ex: Jochum et al., 341
2006), simply improving the precision in some cases. When they do not agree, we can 342
invoke millimeter scale heterogeneity of the standards. They have been reported for 343
trace elements in the ATHO-G rhyolite (MPI-DING; Borisova et al., 2010) and 344
cautious must apply when choosing your standards to perform micro-analysis. For 345
example it is clear from Table 2 that the ATHO-G piece that we have is very different 346
than the piece measured by SIMS in Jochum et al, 2006, and much closer to the 347
composition of that of Oskarsson et al. (1982) and this has nothing to do with the 348
quality of the analysis. In this respect, ATHO-G and StHs6/80-G appears to be 349
heterogenous for F, S and Cl depending on the pieces you have. Also the 2error we 350
report for our EPMA are 9 times out of 10 better than previously reported, 351
demonstrating that the proposed settings for halogen measurements by EPMA are 352
particularly well suited. 353
The ERDA results for F and Cl in ATHO-G, KE12 and KL2-G anchors independantly 354
the calibration curves for F and Cl. We note that the ERDA values for F and Cl of the 355
two SiO2-rich standards, are closer to the EPMA values than the SIMS values (Fig. 4a 356
and 4c), and the ERDA measurement on the basalt standard KL2-G was difficult to 357
assess because of the high detection limit of the ERDA. 358
359
Discussions 360
Precision and accuracy 361
The lowest concentrations we measured were samples 128 and GOR-362
132 for F and S and sample StHs for Cl (Table 2). While EPMA measurements tend 363
to level out around 10 µg.g-1 concentration for S (Fig. 4b), SIMS measurements are 364
precise to µg.g-1 level for S and Cl (Fig.4b and c). For F, S and Cl, SIMS 365
measurements always display smaller error bars (Fig. 4a, b, c). Samples with 366
concentration in S, Cl > 100 µg.g-1 are analyzed with similar precision with both 367
methods. Measurements of F remains up to 5 times more precise with SIMS than 368
EPMA on the basis of analytical precision based on counting statistics and for F 369
concentration above 100 µg.g-1. Because many standard values are still tied to EPMA 370
measured samples, it appears that the uncertainty of the slope and intercept (Fig. 2) 371
contributes to the final uncertainty similar to EPMA values (Table 2). Therefore, it is 372
strongly recommended to use SIMS when the interest of measurement is to detect 373
variations of concentration among similar samples with a high precision, while EPMA 374
can certainly provide a rapid, good assessment of trace volatile abundances above a 375
certain threshold. 376
377
Matrix effect 378
It is particularly notable that some measure values by SIMS (reported for ATHO-G 379
and KE12; Table 2) significantly differ from those of EPMA and ERDA. Fig. 4 also 380
shows that higher SiO2 glasses (e.g. ATHO and KE12) plot on the right side of the 381
1:1 line, outside of +/-20 % bound (a conservative external reproducibility range), 382
indicating SIMS measurements are higher than EPMA and ERDA. While such offset 383
is not present for mafic glasses which have similar SiO2 content as the calibration 384
standards. This offset is present for measurements of F, S and Cl. This systematic 385
disparity related to the composition of material analyzed is called matrix effect, in 386
which the secondary ion emission is influenced by change either structual or 387
compositional variation of the matrix. 388
The relative sensitivity factor (RSF) describes a bias of an elemental ratio introduced 389
by SIMS: RSF = (Ci/Cref)×(Iref/Ii), where Ci and Cref are the known atomic 390
concentration of mass i and mass ref, respectively and I denotes the measured signal 391
intensity. Essentially, the slope of the calibration function is a representative RSF of 392
several calibration standards. It should be noted that RSF cannot distinguish bias of 393
the signal of interest (e.g. IF, IS, and ICl) from the signal of reference (ISi). Fig. 5 shows
394
the value of RSF calculated for the samples of Fig. 4 as a function of SiO2, excluding
395
the EPMA data below detection limit. It appears that RSF is slightly negatively 396
correlated against SiO2, consistent with a presence of matrix effect for the high SiO2 397
samples. However, considering the scatter of RSF values, the appearent negative 398
correlation has only slight statistical significance. The data aquired here is not 399
sufficient to decern the exact role of the “matrix effect”. Because of such tendency, 400
van den Bleeken and Koga (2015) concluded from a similar analysis that as a first 401
order, one should be able to approximate the abundance of these element without 402
correction. 403
404
Choices of calibration method 405
Reference mass: concentration analysis by SIMS requires a ratio of the element of 406
interest (F, S, Cl here) over an element that constitute the matrix. For silicate glasses, 407
it is commonly Si is chosen (Shimizu and Hart). 30Si is commonly selected for its low 408
abundance permitting the use of electron multiplier detector. However, depending on 409
the SIMS facility, different reference mass is used. For example, 28Si detected with 410
Faladay cup can be used as the reference mass, as well as 18O- or 16O-. In general, 411
emission of negative oxygen atom is approximately 10 times better than Si but this 412
does not seems to result in significantly more stable signal. While it will require 413
further study to assess the advantages and disadvantages regarding the choices of the 414
reference mass, a comparison results from different SIMS labs concluded that it 415
would not influence the measurement significantly (in the electronic supplement, van 416
den Bleeken and Koga, 2015). 417
Calibration curves: a linear function that converts a SIMS intensity ratio to a 418
concentration can be expressed in following two ways. 419
[F, S, Cl ppm] = Coef x (I(F, S, Cl) / I (Si) ) x [SiO2] + Intercept (eq. 1) 420
[F, S, Cl ppm] = Coef x (I(F, S, Cl) / I (Si) ) + Intercept (eq. 2) 421
where, brackets indicates concentration and I(x) indicates SIMS intensity (i.e. count 422
rate) of mass x. Coef, and Intercept are constants determined by fitting the function 423
using known concentration standards. Among SIMS measurements reported, these 424
two equations were commonly used. The eq. 2 is sufficient for the measurement with 425
a good match of sample and standard matrices (i.e. similar SiO2 content). In the 426
current study, we adapted eq. 1, which corrects for variable SiO2 content (e.g. 50% 427
basalt and 70% rhyolite). However, it should be noted that the eq. 1 does not correct 428
for the matrix effect. 429
Recognising the weak correlations between SiO2 and RSF, we have explored a 430
potential modification of the working curve function in an aim to optimize the 431
accommodation of SiO2 viriation in silcate glass. Taking Cl as an example, the eq. 1 432
can be rearranged to show the relationship with RSF. 433
{[Cl] - [Intercept]}/{[SiO2]}×k = RSF×(ICl/ISi) eq. (1’)
434
Where k is a conversion factor for concentration ratio to atomic ratio, thus Coef = 435
RDF/k. Inspecting Fig. 5, we decided to explore two functional forms relating RSF 436 and SiO2. 437 RSF = a / [SiO2] + b (eq. 3) 438 RSF = c × [SiO2] + d (eq. 4) 439
Substitutig eq. 3 or eq. 4 into equ. 1’, the working calibration curve will be in 440
following form. 441
[Cl] = ak(ICl/ISi)+bk(ICl/ISi)[SiO2] +Intercept (eq. 5)
442
[Cl] = dk(ICl/ISi)[SiO2] + ck(ICl/ISi)[SiO2]2 + Intercept (eq. 6)
443
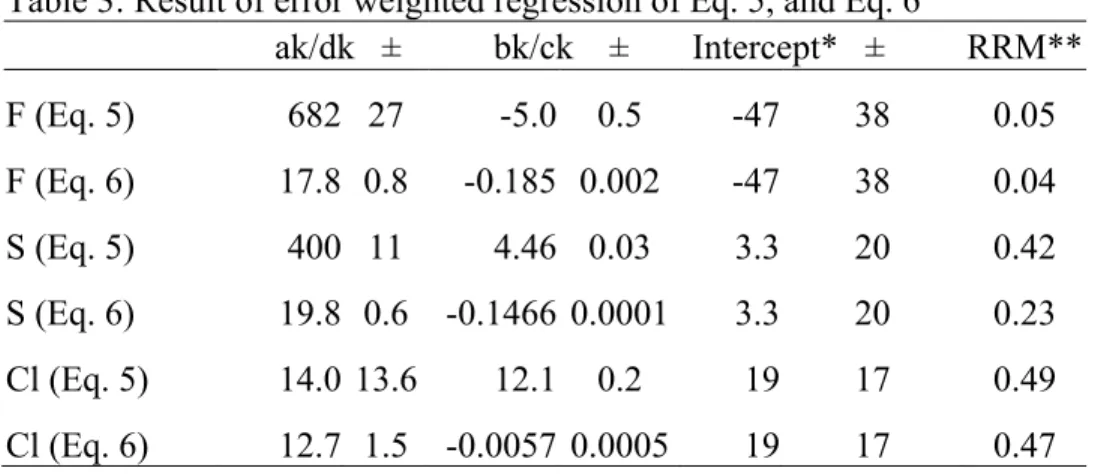
Table 3 shows the result of regression with above equations. For the regression, in 444
addition to six calibration standards, three high Si samples are added T1g, ATHO, and 445
KE12. Inspecting the results of the regression, eq. 6 consistently produced better fit, 446
although slight, than eq. 5. On top of this,‘ck’ term is significantly smaller than ‘dk’ 447
term in eq. 6. This suggest that the role of additional term in correcting the matrix-448
dependent calibration is minor. This conclusion is again consistent with that of van 449
den Bleeken and Koga (2015) in which authors concluded the use of eq. 1 is sufficient 450
to determine trace halogen concentration in a wide range of silicate glasses. Lastly, 451
recalculated concentration using eq. 6 is presented in Table 2, indicated as SIMS [eq. 452
6]. 453
454
Applications to arc lava olivine-hosted melt inclusions 455
Subduction zones have generally volatile-rich magmas. The magmas are produced by 456
mantle wedge melting induced by slab-derived fluids. Lava erupting from arc these 457
volcanoes are at least partially degassed. Olivine hosted-melt inclusions found in 458
these lavas, are silicate droplets trapped in a host-mineral (olivine here) are less 459
affected by degassing, and shielded from interaction with their surrounding in the 460
magma chamber and during magma ascent. Especially for the halogens Cl and F, at 461
pressure and temperature conditions of melt inclusion formation, they are less prone 462
(1) to degassing (if at all) than H2O (e.g. Carroll and Webster, 1994; Métrich and
463
Wallace, 2008), (2) to diffusing through the host-olivine (e.g. Bucholz et al. 2013; 464
Lloyd et al. 2013; Le Voyer et al. 2014). Recent experimental results have 465
determined F and Cl partition coefficients between melt and crystals (Dalou et al., 466
2014) and put forward that the large variation of F/Cl in arc melt inclusions resulted 467
from the composition, the amount of slab agent and the degree of melting. 468
Our recent melt inclusion data combined with litterature data show that although F/Cl 469
ratios in arc melt inclusions can vary between 0.1 and 4 (see fig 5A in Dalou et al., 470
2014), within each sample suite, for each volcano, F/Cl is relatively constant, over a 471
range of H2O abundance (Fig. 6). The F/Cl is normalized to the average F/Cl of each
472
arc, so that all constant F/Cl ratio gather around the unity value. This illustrates that 473
while H2O can vary due to degassing prior to (or after) the entrapment of melt
474
inclusions, pre-entrapment F/Cl values remain constant. The same conclusion can be 475
drawn with F/Cl plotted against CO2, F, or Cl. This systematics demonstrate either 1)
F and Cl remain in melt during degassing, a conclusion reached for example by 477
Bucholz et al., (2013) or 2) partitioning of F and Cl between fluid and magma is 478
identical (Wu and Koga, 2013; Dalou et al., 2014). While we focus on the 479
incompatible behaviors of Cl and F in basaltic melt, it should be noted that there 480
exists a number of studies and experimental work concerning Cl and F behavior in 481
evolved magmas, with specific application to volcanology and ore deposit formations 482
(e.g. Webster, 1990, 1992; Brenan, 1993; Giordano et al., 2004). Their results on 483
halogen partitioning in fluid - evolved melt systems show that Cl and F are strongly 484
partitioned into the fluid at crustal degassing conditions (Webster et al., 2018; Dolejs 485
and Zajacz, 2018). But even if the halogens appear to degas during magmatic 486
evolution in mid-to- shallow crust, Cl and F in primitive basalts, especially in melt 487
inclusions, appear to retain the information of magma genesis (Koga et al. 2009; 488
Bucholz et al., 2013; Rose-Koga et al., 2012, 2014) along with other lithophile trace 489
elements (such as REE). The subduction input/output mass balance calculations show 490
that nearly 100% of Cl coming in subduction is incorporated in arc magmatism, 491
compared to only about 50% of F (e.g. Straub and Layne 2003; Wallace 2005). 492
Therefore Cl and F are ideal tracers to identify the fractionation process between the 493
slab and the flux originating from it, especially since they are scarcely present in the 494
mantle (F reservoirs, see for example Koga and Rose-Koga, 2016; 2018). It is 495
generally considered that Cl shows an affinity to volatile-rich fluid and F shows an 496
affinity to silicate melt (e.g. Schilling et al. 1980). An experimental study on F 497
fractionation between aqueous fluid and mineral at pressures and temperatures 498
relevant to subduction zone settings, demonstrated for example the strong affinity of F 499
for the silicate phase (Wu and Koga, 2013). 500
Studies of halogens in magmatic products cover a wide range of applications. Studies 501
involving F and Cl measurements (and their ratios with trace elements) on arc 502
samples are able to decipher the transport vector (melt and/or fluid) from slab to 503
surface (e.g. Rose-Koga et al., 2014). Also F and Cl measurements combined with Pb 504
isotopes can bring new constraints on the source of OIB lavas (e.g. Peterson et al., 505
2014) or on the volatile contents of the mantle endmembers (e.g. Rose-Koga et al., 506
2017). Halogens combined with Sr isotopes can decipher between mantle source Cl-507
enrichment and brine assimilation (e.g. Reinhardt et al., 2018) 508
509
Implications 510
F and Cl measurments by EPMA and SIMS have a general good agreement on 511
standards glasses available to the scientific community (MPI-DING, Jochum et al., 512
2006). These are the two most common insturment for in situ halogen measurements 513
and finally there performance are analysed and compared. The F and Cl ERDA 514
measurements on 3 standards anchors independantly the EPMA-SIMS comparison 515
curves and gives absolute F and Cl concentrations for these standards. The ERDA 516
results also highlight the fact that there is a matrix effect on SIMS measurements of F 517
and Cl in high-SiO2 standard. We propose a new equation to correct this matrix effect 518
in the SIMS F and Cl data of high-SiO2 samples. 519
We can now use, indifferently EPMA or SIMS for F and Cl measurements, on a large 520
SiO2 range covering most of the geological samples. 521
522
Conclusions 523
An intercalibration of F, Cl and S measurements between EPMA and SIMS is 524
reported for 10 glass-standards. Both analytical methods are in excellent agreement 525
for standards with concentrations in these volatiles elements above 150 µg.g-1 for F 526
and above 20 µg.g-1 for S and Cl. However, SIMS has a lower detection limit and is 527
preferable in the case of low concentration samples. The ERDA measurements 528
independently confirms and anchors our data. This study revealed a shift between 529
acidic and mafic glass-standard on our ERDA data, thus requiring (1) cautious in the 530
choice of standard materials, and (2) separate SIMS calibrations with standards 531
covering the SiO2 range of the samples. An alternative is to use the equation 6 that we
532
propose to account for this matrix effect on the SIMS measurements of F, S and Cl. In 533
arc melt inclusions, F/Cl ratios of series of inclusion from single volcanoes, remain 534
constant over a large range of H2O concentration, suggesting these halogen do not 535
degass. On a broader point of view, halogens such as F and Cl (also Br and I), 536
associated with radiogenic isotopes and trace element ratios, are promising new 537
tracers of fluid and/or melt transport from their source regions and for degassing 538
processes. 539
540 541
Acknowledgement: EFR-K thank O. Sigmarsson for the Sletta sample. EFR-K and 542
KTK acknowledge support from Region Auvergne Rhone Alpes (SCUSI program). 543
This is Laboratory of Excellence ClerVolc contribution number xxx. 544
Figure caption 546
547
Fig. 1: Secondary ion spectra at nominal masses, 19 (a), 32 (b) and 35 (c) for a basalt 548
glass (ALV519-4-1) to illustrate the resolution of isobaric interferences at 549
M/M=5800 (10% definition). This basalt glass contains 90 µg.g-1 F, 950 µg.g-1 S, 550
and 45 µg.g-1 Cl (Helo et al., 2011; Table 1). 551
552
Fig. 2: SIMS calibration curves for abundances of (a) fluorine, (b) chlorine, (c) sulfur 553
in basalt glasses. The lines correspond to different fit. The red line is a linear 554
regression line forced through zero, the blue line is a classic linear regression line, the 555
y-intercept giving the detection limit of the analyzed element. Since any of those fit 556
are satisfactory within the error bar, we consider the calibrations are linear over 557
several orders of magnitude in S, Cl, F concentrations. 558
559
Fig. 3: Elastic recoil detection analysis (ERDA) spectra for oxygene 16O (a), fluorine 560
19
F (b) and chloride 35Cl (c). On the y-axis are reported the counts and on x-axis, the 561
mass. This is the example of the measurements done on the standard MPI-DING glass 562
KE12 (Jochum et al., 2006). 563
564
Fig. 4: concentrations of F (a), S (b) and Cl (c) measured by SIMS versus that 565
measured by EPMA (circles) and ERDA (square, when applies) in a log-log plot. 566
Standards are categorized according to their SiO2 contents into mafic, intermediate 567
and acidic. 568
Fig. 5: RSF (the relative sensitivity factor) is plotted against SiO2 concentration in 570
glass samples. RSF is determined for individual analysis of known samples. (a) RSF 571
of fluorine, (b) of sulfur, and ( c) of chlorine are shown here. There exist a slight 572
negative slope for all the panels however due to scatter of measurements, the trend is 573
not statistically significant. There are less number of RSF values as many of sulfur 574
concentrations are below EPMA detection limit and there were no independent way to 575
verify their concentrations. 576
577
Fig. 6: F/Cl ratio normalized to the average versus H2O concentrations in wt%.
578
Symbols are for olivine-hosted melt inclusions from different arcs (Sommata: Rose-579
Koga et al., 2012; Ecuador: Le Voyer et al., 2008; Narvaez et al., 2018; Shasta: Le 580
Voyer et al., 2010; Mariana: Shaw et al., 2012; Lesser Antilles: Bouvier et al., 2008, 581
2010; Vanuatu: Sorbadère et al., 2011). 582
Tables 584
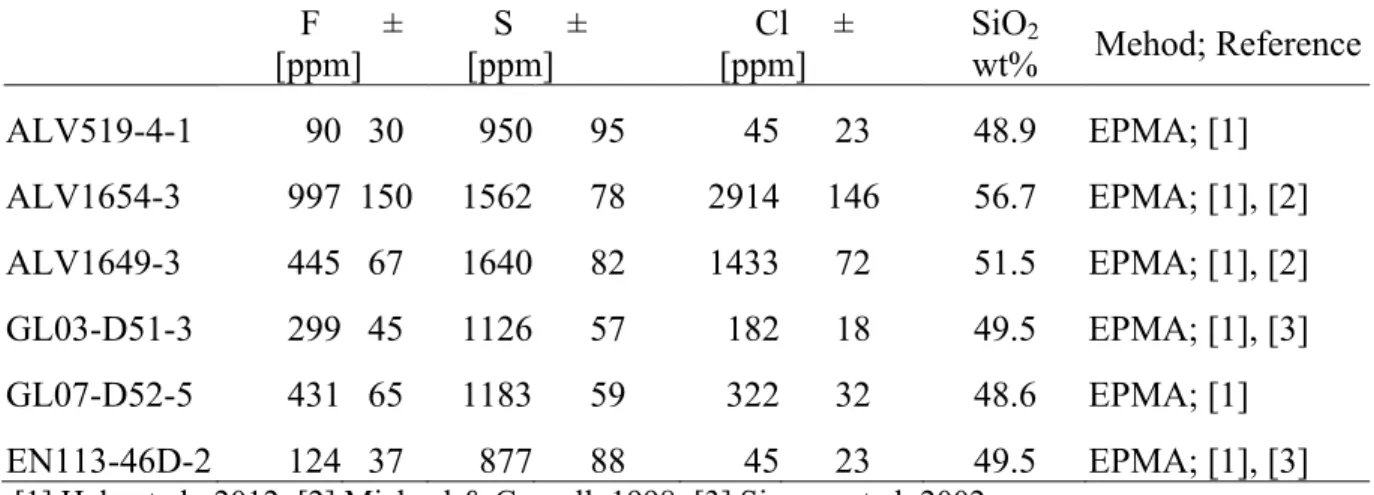
Table 1: F, S, Cl and SiO2 measurements in 6 basalt glasses with the corresponding
585
analytical methods and references. They are the glass-standards used for the 586
calibration on the WHOI SIMS. 587
Table 2: Report of F, Cl, S and SiO2 concentration measurements in 10 referenced
588
material (*) and 3 other basaltic glasses (± is 2. Analytical methods and references 589
are specified. 590
Table 3: Result of error weighted regression of Eq. 5, and Eq. 6 591 592 593 594 595 596 597 598 599 600 601
Table 1: F, S, Cl and SiO2 measurements in 6 basalt glasses with the corresponding
analytical methods and references. They are the glass-standards used for the calibration on the WHOI SIMS.
F ± [ppm] S ± [ppm] Cl ± [ppm] SiO2 wt% Mehod; Reference ALV519-4-1 90 30 950 95 45 23 48.9 EPMA; [1] ALV1654-3 997 150 1562 78 2914 146 56.7 EPMA; [1], [2] ALV1649-3 445 67 1640 82 1433 72 51.5 EPMA; [1], [2] GL03-D51-3 299 45 1126 57 182 18 49.5 EPMA; [1], [3] GL07-D52-5 431 65 1183 59 322 32 48.6 EPMA; [1] EN113-46D-2 124 37 877 88 45 23 49.5 EPMA; [1], [3] [1] Helo et al., 2012; [2] Michael & Cornell, 1998; [3] Simons et al. 2002.
Relative analytical error for F concentration >200 ppm is 15% and F<200 ppm is 30%. Relative analytical error for S concentration > 1000 ppm is 5% , between 100 to 1000 ppm is 10% and < 100 ppm is 50%.
Relative analytical error for Cl concentration >400 ppm is 5%, between 50 and 400 ppm is 10%, and Cl< 50 ppm is 50%.
Errors of these standards are assessed on the long term reproducibility. SiO2was measured by EPMA
Table 2: Report of F, Cl, S and SiO2 concentration measurements in 10 referenced
material (*) and 3 other basaltic glasses (± is 2. Analytical methods and references are specified.
F ±
[ppm] [ppm] S ± [ppm] Cl ± SiOwt% 2 Method; Reference
ML3B-G* 70 18 1.2 0.12 7.5 1.4 51.4 SIMS; [1] 100 100 110 33 EPMA; [1] 30 30 60 18 EPMA; [1] 64;57;69 71 30;20;30 14 5.2 0.1 36 1
EPMA; SIMS; PIGE; [2] SIMS; [WHOI this study]
61 11 5.1 0.2 32 2 SIMS; [eq. 6, this study]
48 68 17 13 32 21 50.7 EPMA; [LMV this study]
StHs6/80-G*
320 32 2.7 0.3 184 18 63.7 SIMS; [1]
40 40 210 42 EPMA; [1]
230 69 EPMA; [1]
139;122;155 2;2;2 EPMA; SIMS; PIGE; [2]
<d.l. 4.3 0.1 27 0.6 SIMS; [WHOI this study]
<d.l. 4.1 0.2 24 0.8 SIMS; [eq. 6, this study]
28 35 19 1 21 11 EPMA; [LMV this study]
T1-G* 321 32 2.6 0.3 113 14 58.6 SIMS; [1] 30 30 100 50 EPMA; [1] 130 65 EPMA; [1] 0.92 119 LA-ICPMS; [3] 1.94 LA-ICPMS; [3]
107;94;119 6;6;8 EPMA, SIMS, PIGE; [2]
274 39 6.0 0.2 175 8 SIMS; [WHOI this study]
207 29 5.7 0.2 135 14 SIMS; [eq. 6, this study]
154 47 20 8 158 7 57.5 EPMA; [LMV this study]
GOR128-G*
25 3 4.3 0.4 11.7 1 46.1 SIMS; [1]
30 30 50 35 EPMA; [1]
40 50 EPMA; [1]
<d.l. 8.3 0.2 38 0.9 SIMS; [WHOI this study]
<d.l. 8.4 0.3 33 1.7 SIMS; [eq. 6, this study]
4 8 15 10 38 19 45.5 EPMA; [LMV this study]
GOR132-G*
22 2 1.8 0.2 6.2 1 45.5 SIMS; [1]
50 50 30 30 EPMA; [1]
50 75 EPMA; [1]
<d.l. 5.7 0.2 30 0.6 SIMS; [WHOI this study]
<d.l. 5.8 0.3 27 1.0 SIMS; [eq. 6, this study]
4 8 11 13 24 17 44.3 EPMA; [LMV this study]
VG2*, aka USNM 111240/52 334 14 50.6 SIMS; [4] 1348 124 291 104 EPMA; [5] 1365 58 316 38 EPMA; [5] 1340 160 EPMA; [6] 1305 135 EPMA; [7] 1200 160 270 80 EPMA; [8]
1416 72 303 112 EPMA; [9]
1500 EPMA; [10]
243 36 1441 55 325 15 SIMS; [WHOI this study]
223 26 1352 66 249 28 SIMS; [eq. 6, this study]
210 66 1343 23 306 13 EPMA; [LMV this study]
VG-A99*, aka A99, USNM 113498/1 170 60 EPMA; [6] 135 100 229 80 EPMA; [5] 765 158 220 48 227 40 EPMA; [5] 177 42 212 62 EPMA; [9] 96 63 EPMA; [7] 200 100 EPMA; [11] 709 47 51.1 SIMS; [4] 976 8 EPMA; [12] 175 116 205 60 EPMA; [13]
799 104 141 5 220 10 SIMS; [WHOI this study]
734 76 132 6 170 18 SIMS; [eq. 6, this study] 597 49 130 11 210 10 EPMA; [LMV this study]
Sletta 3306 340 28 18 2075 64 EPMA; [LMV this study]
KL2-G*
177 28 7.7 1.3 22.4 4.5 50.3 SIMS; [1]
90 54 40 32 EPMA; [1]
320 320 60 18 EPMA; [1]
114;101;128 2;2;4 EPMA, SIMS, PIGE; [2]
114 20 9.1 0.3 45 1 SIMS; [WHOI this study]
104 14 8.9 0.3 38 2 SIMS; [eq. 6, this study]
99 154 23 15 51 23 50.5 EPMA; [LMV this study]
<71 <324 ERDA; [Zurich this study]
ATHO-G* 770 530 74.5 EPMA; [14] 0.7 0.07 0.6 0.07 2430 0 75.6 SIMS; [1] 50 50 570 114 EPMA; [1] 200 140 510 102 EPMA; [1] 900 900 240 240 400 160 EPMA; [1]
1464 186 4.8 0.2 681 32 SIMS; [WHOI this study]
637 137 4.4 0.4 512 60 SIMS; [eq. 6, this study] 668 204 17 12 453 22 74.1 EPMA; [LMV this study]
637 158 334 196 ERDA; [Zurich this study]
KE12*
4338 1096 EPMA; [15]
4400 EPMA; [15]
3270 110 70.8 EPMA; [16]
4200 3300 EPMA; [16]
4000 240 Selective ion method; [17]
3225 160 EPMA; [18]
3200 800 EPMA; [19]
4513 88 EPMA; [12]
7537 932 290 11 4668 226 SIMS; [WHOI this study]
3898 689 208 13 3483 423 SIMS; [eq. 6, this study] 4488 151 150 14 3414 55 EPMA; [LMV this study]
3848 230 3483 400 ERDA; [Zurich this study] Alvin 2390-5 630 303 44 35 1270 9 241 358 19 5 49 SIMS; [20]
EPMA; [LMV this study]
Alvin 2746-15 123 2 1449 15 890 9 50 EPMA; [LMV this study]
[1] Jochum et al. 2006; [2] Guggino and Hervig, 2010; [3] Diaz et al. 2006; [4] Straub & Layne 2003; [5] Thordasson et al. 1996; [6] Dixon et al. 1991; [7] Thornber et al., 2002; [8] Coombs et al. 2004; [9] DeHoog et al. 2001; [10] Hall et al. 2006; [11] Fisk & Kelley 2002; [12] Witter & Kuehner, 2004; [13] Streck & Wacaster 2006; [14] Oskarsson et al. 1982; [15] Palais and Sigurdsson, 1989; [16] Métrich & Rutherford, 1991; [17] Mosbah et al, 1991; [18] Marianelli et al. 1995; [19] Cioni et al. 1998. [20] Le Roux et al., 2006. <d.l. means below detection limit. Numbers in italic are considered below detection limit.
Table 3: Result of error weighted regression of Eq. 5, and Eq. 6 ak/dk ± bk/ck ± Intercept* ± RRM** F (Eq. 5) 682 27 -5.0 0.5 -47 38 0.05 F (Eq. 6) 17.8 0.8 -0.185 0.002 -47 38 0.04 S (Eq. 5) 400 11 4.46 0.03 3.3 20 0.42 S (Eq. 6) 19.8 0.6 -0.1466 0.0001 3.3 20 0.23 Cl (Eq. 5) 14.0 13.6 12.1 0.2 19 17 0.49 Cl (Eq. 6) 12.7 1.5 -0.0057 0.0005 19 17 0.47
* Intercept values are taken from the working curves of Fig. 2. This choice was to reduce cases of erroneous fit coefficients. **RRMS : Reduced residual mean-square value, in which residual of fit values were normalized by the uncertainty of the standards, and the mean value of the sum of the square is reported. When RRMS > 1 indicates that fitted values on average plot outside of 1 sigma of the standard value.
34.9625 34.9675 34.9725 34.9775 S 32 -PH 31 -O 16 -2 1 10+7 10+6 10+5 10+4 10+3 10+2 10+1 31.9550 31.9650 31.9750 31.9850 1 10+5 10+4 10+3 10+2 10+1 Cl 35 -SH 34 -F 19 -OH 18 -1 10+6 10+5 10+4 10+3 10+2 10+1 18.9925 18.9975 19.0025 19.0075 Fig. 1 (a) (b) (c)
0 50 100 150 0 200 400 600 800 1000 1200 19F 30Si× SiO 2 F [ µ g/g] (a) Y = 9.04 (+/- 1.11 ) X + -46.8 (+/- 35.7 ) Y = 8.67 X 0 50 100 150 200 0 500 1000 1500 2000 32S 30Si× SiO 2 S [µ g/ g] (b) Y = 13.2 (+/- 0.5 ) X + 3.19 (+/- 19.6 ) Y = 12.9 X 0 50 100 150 200 250 300 0 1000 2000 3000 4000 35Cl 30Si× SiO 2 Cl [ µ g/g] (c) Y = 16.5 (+/- 0.8 ) X + 19.3 (+/- 16.6 ) Y = 15.9 X
Fig. 2
0 5.0x10+03 1.0x10+04 1.5x10+04 2.0x10+04 2.5x10+04 12 14 16 18 20 22 0 50 100 150 200 17 18 19 20 21 22 0 100 200 300 400 500 32 34 36 38 40 42 Fig. 3 35Cl 39K atomic ratio: 35Cl / 16O = (2.3±0.4)x10-3 19 F 18O atomic ratio: 19F / 16O = (6.6±0.4)x10-3 16O
10 50 100 500 5000 10 50 500 5000 SIMS [ µg.g−1 ] EPMA / ER D A [ µ g. g − 1 ] Fluorine Mafic Intermidiate Acidic EPMA ERDA 1 10 100 1000 10000 1 10 100 1000 10000 SIMS [ µg.g−1 ] EPMA / ER D A [ µ g. g − 1 ] Sulfur 10 50 100 500 5000 10 50 500 5000 SIMS [ µg.g−1 ] EPMA / ER D A [ µ g. g − 1 ] Chlorine ML3B-G KL2-G VG2 T1-G VG—A99 ATHO-G KE12-G KE12 ATHO-G KL2-G VG-A99 VG2 GOR132-G GOR128-G T1-G StHs6/80-G ML3B-G KE12-G ATHO-G KL2-G VG-A99VG2 GOR128-G GOR132-G T1-G StHs6/80-G ML3B-G a b c Chlorine Fig. 4
a
b
c
0 1 2 3 4 5 6 0.01 0.05 0.50 5.00 H2O [wt. %] F /C l n orma lize d to a ve ra ge va lu es Vulcano-la Sommata Ecuador Shasta Lesser Antilles Mariana Vanuatu Fig. 6