W
ORKING
P
APERS
SES
F
A C U L T É D E SS
C I E N C E SE
C O N O M I Q U E S E TS
O C I A L E SW
I R T S C H A F T S-
U N DS
O Z I A L W I S S E N S C H A F T L I C H EF
A K U LT Ä TU
N I V E R S I T É D EF
R I B O U R G| U
N I V E R S I T Ä TF
R E I B U R G04.2014
N° 448
Comparing Mobile
Communication Service Prices
Among Providers:
A Hedonic Approach
Comparing Mobile Communication Service Prices
Among Providers: A Hedonic Approach
Olivier Sch¨onia, Lukas Segerb
aDepartment of Informatics, Faculty of Economics and Social Sciences,
Bd de P´erolles 90, 1700 Fribourg, Switzerland.
bDepartment of Economics, Faculty of Economics and Social Sciences,
Bd de P´erolles 90, 1700 Fribourg, Switzerland.
Abstract
The present article proposes a new approach to compare mobile communi-cation service prices among different communicommuni-cations service providers. To this end, a hedonic model based on monthly phone bills is employed that re-lates billed amounts and the quantities of consumed mobile communication services. A linear hedonic regression model is separately estimated for each provider and then used to estimate prices. Laspeyres, Paasche, and Fisher double-imputed price indices are then used to compare prices across com-munications service providers on an aggregate level. The sensitivity of these indices in relation to the estimated hedonic functions is investigated using a generalized additive model.
Keywords:
Mobile communication, price indices, prediction, hedonic regression. JEL: C43, C52, C53, P42.
1. Introduction
Mobile communication markets usually have a limited number of com-munications service providers (CSP). With only a few providers competing in the market, oligopolistic competition with all nuances is often present, and careful price monitoring is required. Providers mainly compete by offer-ing different tariffs to consumers, whereas consumers try to minimize mobile communication costs. The proposed tariffs, however, usually include too large of a number of specifications to be fully included in price comparisons.
Email addresses: olivier.schoeni@unifr.ch (Olivier Sch¨oni), lukas.seger@unifr.ch (Lukas Seger)
In Switzerland, to compare prices of mobile communication services, the Fed-eral Office of Communications (2012) uses the method suggested by the Or-ganisation for Economic Co-operation and Development, see OECD (2010). By this method, three basic consumption baskets are constructed for small, medium, and strong consumption profiles, respectively. The monthly
min-imal cost tariff is determined for each provider and profile. These
min-imal costs for each profile are finally compared across providers.
Cost-minimizing consumers, perfect information, and full flexibility in the choice of the provider are key assumptions of this approach. In reality, these hy-potheses are not necessarily satisfied. Firstly, consumers do not necessarily minimize overall costs, either because they don’t behave perfectly rationally, or because perfect information is not present. In fact, different contract
el-ements such as special discounts1 or discounts on mobile phone prices make
precise comparisons very complicated and are ignored in the OECD approach. Secondly, in the Swiss market, contracts usually have minimal durations of at least one year. Consumers are often faced with so-called rollover contracts that are extended automatically after the basic duration, if not terminated explicitly. Therefore, consumers cannot switch flexibly between different con-tracts and providers. Finally, besides the violation of the above hypotheses, the Federal Office of Communications (2012) identifies the following prob-lems related to the minimal cost approach: The volume of mobile data traffic is not considered, special services cannot be implemented, price discounts on phones for subscribing to a contract are neglected, demographic discounts are missing, and network quality (coverage) cannot be evaluated. Thus, al-though being time-efficient, the OECD method used misses many aspects of the mobile communication market.
To address these problems, we suggest adopting a hedonic approach. Hedo-nic methods have been mainly used to evaluate housing and high-technology goods and analyze their price behavior across time. See, for example, Hill (2012) and Triplett (2004). In the present context, the standard hedonic ap-proach is modified to compare mobile communication prices across providers. To this end, for each consumer possessing a contract with a given provider, we identify the quantity of the consumed mobile services (call minutes, text mes-sages, megabytes, etc.) through monthly phone bills. For each provider, con-sumption prices for all services are then estimated by regressing the monthly billed amount on the quantities of the consumed mobile services. Using then
1We consider as special discounts, for example, demographic discounts for students,
free-to-call phone numbers for selected persons, and all other kind of very distinct contract modifications, which are provider-specific offers.
the estimated consumption prices, classic price index formulae can be used to compare communication costs (or final, aggregate prices) across providers. To the authors’ best knowledge, this is the first time this methodology is adopted. Moreover, in contrast to the research conducted in other domains of application, an approach to evaluate the sensitivity of hedonic indices with respect to the estimated linear hedonic function is proposed.
Section 2 introduces the hedonic methodology applied to the case of mobile communication service prices. In particular, the hedonic regression model and double-imputed hedonic price indices are discussed. The used dataset and the empirical results are described in Section 3. Section 4 summarizes the key findings and provides an outlook for further research.
2. Mobile Communication Service Prices
This section is structured in two parts. In the first part, the hedonic regression approach is adapted to compare communications service providers, and model specification issues are described. Double-imputed hedonic price indices are then presented in the second part.
2.1. Hedonic Approach to Mobile Communication Service Prices
Let psi be the monthly billed amount of the i-th consumer belonging to
provider s. The vector xs
i := (xsi1, ..., xsiK) denotes the consumed quantities of
mobile services (minutes, text messages, megabytes, roaming, etc.). Clearly,
if all L price-relevant variables xs := (xs1, ..., xsLs) of a specific provider were
known and quantified, the following deterministic equation would hold for each individual
psi = β1sxsi1+ ... + βLssxsiLs, (1)
where βs
1, ..., βLss may represent the prices of the consumed units.
Impor-tantly, all possible factors determining the cost of consuming mobile services (subscription type, provider-specific options, etc.) are included in this equa-tion.
Unfortunately, the above equation cannot be used to compare total cost (or billed amounts) across providers for two reasons. The first reason is related
to the high number of price-relevant variables Ls: subscriptions in the
mo-bile communication market get more and more complex, it seems difficult to consider all these provider-specific variables in a statistical analysis. The second reason stems from the very nature of the considered problem. With the main purpose being the comparison of mobile communication service prices across providers, we must define a subset of price-relevant variables
us to define a set of consumption variables for which prices can be directly compared across providers.
We thus adopt a hedonic approach, and for each provider, we assume that
pi = fs(xi) + usi, i = 1, ..., ns, (2)
where us
i is a stochastic error term, and ns represents the number of
observa-tions of provider s. The function fsrepresents the so-called hedonic function,
and describes for each provider how the consumed quantities interact to build the billed amount.
Two remarks are necessary to understand the adopted hedonic model. First, in contrast to the standard methodology presented in the hedonic literature, the time dimension has been suppressed. This doesn’t mean that time is not present: Communication service prices are compared for different providers over a given time interval. If the time interval spans several months, we assume that bills of different consumers are randomly sampled during this period, allowing us to consider the individual observations as independent to each other. The time dimension is introduced at the end of this section, and
is handled by chaining. Time correlation is not present in the considered
time interval for a given provider, and must not be considered in the hedonic
model. We can thus assume that the error terms usi, i = 1, ...ns are
indepen-dent.
Second, an additive hedonic function fs can be assumed in the present
con-text: Although the error term usi contains the provider-specific options that
affect the price paid for consuming the quantities xs := (xs
1, ..., xsK), the total
cost is given by summing the costs of the individual consumption variables.
These individual costs can be modeled using non linear functions f1s, ..., fKs
of the consumed mobile services:
pi = β0+ f1s(xi1) + ... + fKs(xiK) + usi, i = 1, ..., ns. (3)
If the stochastic error term does not contain variables affecting the price behavior of the consumed quantities, we can safely assume a linear model specification
pi = β0s+ β
s
1xi1+ ... + βKsxiK + usi, i = 1, ..., ns. (4)
The coefficients βs
0, β1s, ...βKs are called shadow prices of consumed units. The
intercept term in equation (4) corresponds to the price to have a contract with a specific provider, that is the contract’s subscription price. As shown in Sec-tion 3, the intercept is usually quite large, and shadow prices are very small, thus making the interpretation of the coefficients difficult. The constant can
be suppressed, and then the coefficients can be interpreted as average unit prices, but they are biased. Equation (4) constitutes a special application of the hedonic approach: Instead of representing the intrinsic quality of a good, the independent variables correspond to the users’ consumption behavior. If users tend to choose mobile contracts according to their consumption pro-files, a correlation between the consumption variables and the regression error term has to be expected. For this reason, the consumed quantities may not be considered as exogenous variables. In this case, the usual OLS estimator is biased and not consistent, and a causal interpretation of the equation is not possible. It could be solved by instrumental variables such as, for exam-ple, the contract type or maybe the age of the consumer. The endogeneity problem, however, is not necessarily always present. In the case of the Swiss mobile market, for example, one could argue in the following manner. Be-cause users receive a discount on a new mobile phone when a mobile contract is subscribed, and the magnitude of the discount depends on the contract, the choice of the contract is mainly motivated by the discount on the new mobile phone. The choice of the contract is thus independent of the user’s consumption profile, and this effect is fully contained in the implemented variable for the new mobile phone received for subscribing.
In the empirical part of the paper, equations (3) and (4) are estimated using two different regression approaches. Because the main goal of the present paper is the computation of hedonic price indices, a causal interpretation of equations (3) and (4) is not necessary. Our efforts are devoted to obtaining a good prediction performance of the hedonic model, and the endogeneity problem has not been considered. The endogeneity problem, however, de-serves a rigorous statistical investigation and represents an area of further research. Additionally, the hedonic function does not need to be modeled necessarily by a linear specification; a broad set of alternatives exists that should be considered in further analyses.
2.2. Hedonic Price Indices
Let Ms := {ms
1, ..., msNs} denote a basket containing Nsconsumption
pro-files of provider s, where msi = (msi1, ..., msiK) represents the i-th consumption
vector. The hedonic regression models estimated through equation (3) or equation (4) are used to compute the Laspeyres, Paasche, and subsequently Fisher double-imputed hedonic price indices according to the consumption basket HP IsL1s2(Ms1) = PNs1 i=1 fˆs2(m s1 i ) PNs1 i=1 fˆs1(m s1 i ) (5)
and HP IsP1s2(Ms2) = PNs2 i=1fˆs2(m s2 i ) PNs2 i=1fˆs1(m s2 i ) . (6)
The Laspeyres price index (equation (5)) tends, in fact, to favor the provider
s1 because the total consumption costs
PNs1
i=1fˆs1(m s1
i ) are probably lower
than PNs1
i=1fˆ s2(ms1
i ) due to the consumers’ rationality. In fact, consumers
may adapt their consumption behavior to the underlying contract.
Simi-larly, the Paasche price index (equation (6)) tends to favor the provider s2.
Computing a geometric mean of the two indices should solve this problem. We thus define the Fisher hedonic price index by
HP IsF1s2(Ms1, Ms2) = q HP IL s1s2(M s1) · HP IP s1s2(M s2). (7)
The Fisher index describes the price for aggregate consumption.2
Impor-tantly, the Fisher price index allows us to counter the asymmetry present in the Laspeyres and Paasche price indices.
The main point is how to define the provider-specific basket Ms. The
double-imputation method applied in the empirical part defines the consumption basket as the set of consumption vectors that have been observed for each
provider: Ms = {x
1, ..., xns} and Ns = ns. In this case, the consumption
vectors used to estimate the hedonic regression function are also used to compute double-imputed hedonic price indices. However, other approaches to compute hedonic price indices have been suggested in the literature, see Hill (2012). The characteristic hedonic approach, for example, uses a basket
Ms containing a single consumption vector. The contained units are defined
as the average of the observed consumption profiles. Interestingly, Sch¨oni
(2014) has demonstrated that if equation (4) holds, the double-imputed and characteristic methods are asymptotically equivalent. For this reason, we focus on double-imputed hedonic price indices. The main motivation to use double and not single imputation is to compare “equal to equal ”and, there-fore, avoid comparing predicted prices of one provider to observed ones of another provider.
Hitherto, only price levels between providers have been compared. If the
2Note that expenditure shares are used implicitly. Observations with intense
con-sumption are weighted stronger because the predicted billed amounts or monthly cost are relatively high. Therefore, consumers with intense consumption obtain a higher weight in the index than others. Alternatively, by weighting all consumers or observations equally, a modified version of the T¨ornqvist index could be used to describe the relative price for an average consumer, see Seger (2014).
time dimension will be considered, two main approaches are possible. With the first approach, prices between two providers at different points of time can be directly compared through Fisher indices as shown above. Through this approach, however, fast technical progresses in mobile communication and the corresponding new consumption units and contracts are difficult to account for. In this case, price indices are more complicated to construct, and the price behavior they describe over large time intervals is less accurate. A better solution is provided by chaining. We suggest, in a set-up with sev-eral providers and time periods, first comparing each provider to the entire market (all providers together) for a given time period. Providers are thus treated equally, and the base period is not a provider but the entire market, or, equivalently, the average of all providers. Secondly, when a new time period is considered, we also compute the period-specific price indices as in the previous period. After the hedonic indices for the two time periods have been estimated, they can be chained to compare prices across providers and time periods.
3. Empirical Results
This section contains three parts. First, the underlying dataset is de-scribed, then, the models are estimated, and finally, based on the estimations, indexes are constructed.
3.1. Swiss Mobile Communication Market and Data Description
The Swiss market for mobile communication is mainly shared by three providers. According to the Federal Communications Commission (2013), Swisscom holds the biggest market share (62.4%), followed by Sunrise (20.9%) and Orange (16.7%).
The dataset used for the present analysis is based on monthly bills belonging to students and employees of the University of Fribourg. The entire sam-ple includes 415 bills, supplied from 60 consumers from 2012 and the first quarter of 2013 (see Table 1). Note that our dataset is neither representative for Switzerland, nor for the University of Fribourg. The aim is to show a practical implementation of the approach presented in Section 2.
Although individuals supplied several monthly bills, we assume that ob-servations are independent in a given time period. In fact, if the proposed methodology were to be implemented in official statistics, only one bill per consumer in a time interval should be randomly sampled. The collected data allows us to implement the hedonic provider comparison explained in Section 2. As shown in Table 1, nearly all bills belong either to Swisscom or Orange for the following reasons. Firstly, Swisscom is by far the largest provider.
Q1.12 Q2.12 Q3.12 Q4.12 Q1.13
Swisscom 0 1 66 99 50
Orange 35 44 43 49 23
Sunrise 0 0 0 3 2
Total 35 45 109 151 75
Table 1: Number of observations per quarter and provider
Secondly, some Sunrise bills did not contain complete information on con-sumed mobile services and could not be used for price comparison. On the contrary, missing data of Swisscom bills could be retrieved in the consumers’ on-line account, but only for the past six month. Therefore, Swisscom bills are mostly available for the third and fourth quarter of 2012 as well as the first quarter of 2013. On the contrary, Orange bills are equally distributed over the entire year.
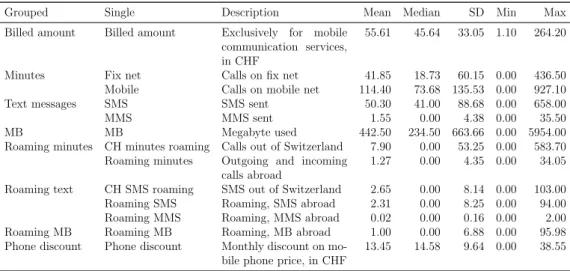
Table 2 shows the collected bills’ data. All the data with exception of the phone discount is contained in phone bills. The first variable describes the
Grouped Single Description Mean Median SD Min Max Billed amount Billed amount Exclusively for mobile
communication services, in CHF
55.61 45.64 33.05 1.10 264.20
Minutes Fix net Calls on fix net 41.85 18.73 60.15 0.00 436.50 Mobile Calls on mobile net 114.40 73.68 135.53 0.00 927.10 Text messages SMS SMS sent 50.30 41.00 88.68 0.00 658.00
MMS MMS sent 1.55 0.00 4.38 0.00 35.50
MB MB Megabyte used 442.50 234.50 663.66 0.00 5954.00 Roaming minutes CH minutes roaming Calls out of Switzerland 7.90 0.00 53.25 0.00 583.70
Roaming minutes Outgoing and incoming calls abroad
1.27 0.00 4.35 0.00 34.05 Roaming text CH SMS roaming SMS out of Switzerland 2.65 0.00 8.14 0.00 103.00 Roaming SMS Roaming, SMS abroad 2.31 0.00 8.25 0.00 94.00 Roaming MMS Roaming, MMS abroad 0.02 0.00 0.16 0.00 2.00 Roaming MB Roaming MB Roaming, MB abroad 1.00 0.00 6.88 0.00 95.98 Phone discount Phone discount Monthly discount on
mo-bile phone price, in CHF
13.45 14.58 9.64 0.00 38.55
Table 2: Data from phone bills
billed amount on a monthly phone bill. Occasionally, additional services such as purchases with text messages or costly hotline calls are charged on phone bills. These services are provided by third-party firms and are thus excluded from the index by subtracting them from billed amounts and con-sumed quantities.
Consumption variables have been divided into grouped and single categories. Single variables listed in Table 2 correspond to consumption units as reported on phone bills. For estimation purposes, these single variables have
subse-quently been grouped together. Note that all variables (except the billed amount) possess a minimal value of zero, thus forbidding the use of several model specifications such as, for example, semi- and double-logarithmic mod-els.
As already mentioned, the phone discount is not present on the bills, and its computation requires additional information. Because of the major role the discount plays in the choice of the provider, it should not be excluded from the model. It requires the following informations for every contract holder or consumer: phone model received for signing a contract, price to be paid for the phone to the provider, purchase date, and the minimal duration of the contract. Based on the phone model and the purchase date, the average
market price of the phone model in a given point of time can be determined.3
The monthly phone discount is finally obtained as the difference between the average market price at the purchase date and the price paid to the provider, divided by the minimal duration of the contract (in months). Detailed in-formations on all issues related to practical problems, data management, consumer surveys, and phone discounts can be found in Seger (2014). 3.2. Model Estimation
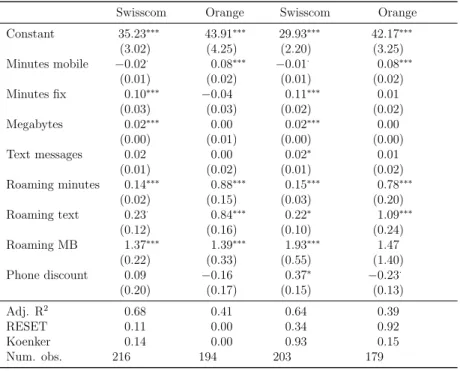
Equations (3) and (4) have been estimated with the gradient boosting and OLS methods, respectively. Table 3 shows the results of the OLS
es-timation with and without influential observations.4 The grouped variables
presented in the previous section have been used for the following reasons. First, grouped variables seem to lessen the multicollinearity problem, thus reducing the variance of the predicted costs. Second, the estimation of the GAM model presented in the next section with ungrouped variables was un-feasible/unreliable because of the ill conditioning of the regressors’ matrix. Third, statistical tests on the functional form and heteroscedasticity display better results.
As reported in Table 3, most of the coefficients of both providers are left unchanged after deleting influential observations (6% and 7.7% of the to-tal observations of Swisscom and Orange have been discarded, respectively). Importantly, Orange’s model specification and heteroscedasticity seem to greatly improve after removing influential observations. Although removing
3We used www.toppreise.ch to determine the average market price of a phone at a
given point in time. There, average phone prices over time are plotted. The prices are the average among a set of offers from different online stores.
4Influential observations have been identified by using the DFFIT values of each
ob-servation and removing the obob-servations possessing a DFFIT value greater than a given threshold value.
With influential observations Without influential observations Swisscom Orange Swisscom Orange Constant 35.23∗∗∗ 43.91∗∗∗ 29.93∗∗∗ 42.17∗∗∗ (3.02) (4.25) (2.20) (3.25) Minutes mobile −0.02· 0.08∗∗∗ −0.01· 0.08∗∗∗ (0.01) (0.02) (0.01) (0.02) Minutes fix 0.10∗∗∗ −0.04 0.11∗∗∗ 0.01 (0.03) (0.03) (0.02) (0.02) Megabytes 0.02∗∗∗ 0.00 0.02∗∗∗ 0.00 (0.00) (0.01) (0.00) (0.00) Text messages 0.02 0.00 0.02∗ 0.01 (0.01) (0.02) (0.01) (0.02) Roaming minutes 0.14∗∗∗ 0.88∗∗∗ 0.15∗∗∗ 0.78∗∗∗ (0.02) (0.15) (0.03) (0.20) Roaming text 0.23· 0.84∗∗∗ 0.22∗ 1.09∗∗∗ (0.12) (0.16) (0.10) (0.24) Roaming MB 1.37∗∗∗ 1.39∗∗∗ 1.93∗∗∗ 1.47 (0.22) (0.33) (0.55) (1.40) Phone discount 0.09 −0.16 0.37∗ −0.23· (0.20) (0.17) (0.15) (0.13) Adj. R2 0.68 0.41 0.64 0.39 RESET 0.11 0.00 0.34 0.92 Koenker 0.14 0.00 0.93 0.15 Num. obs. 216 194 203 179 ***p < 0.001,**p < 0.01,*p < 0.05,·p < 0.1
Table 3: OLS estimation
Swisscom’s influential observations does not seem to bring evident advan-tages, they are nevertheless removed to guarantee an equality of data treat-ment between the two providers. Note that deleting influential observations excludes parts of the truly observed consumption and might bias the index. However, it is finally a trade-off between estimation accuracy and including all sampled phone bills.
Importantly, the functional form and heteroscedasticity tests are valid if the linear model’s hypotheses are satisfied. In the case of endogenous regressors, these tests would not be reliable, and other approaches to investigate the functional form are necessary.
3.3. Sensitivity Analysis
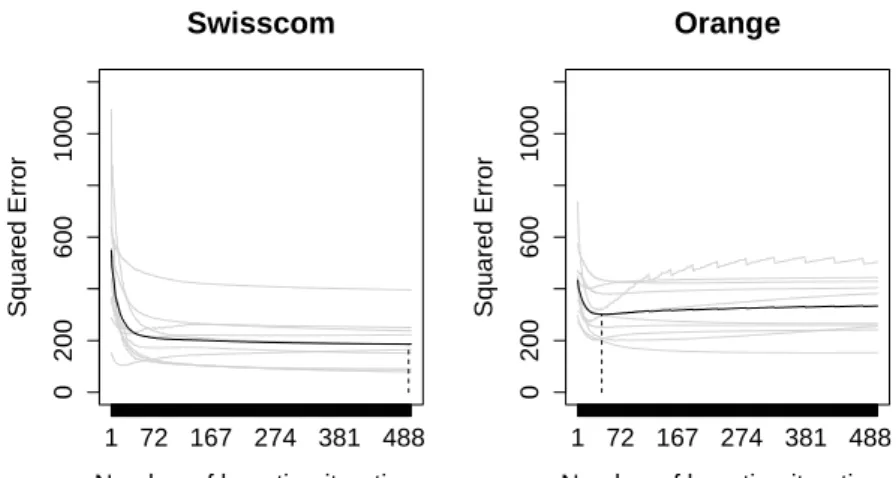
Due to the possible problems related to the functional form, a general-ized additive model corresponding to equation (4) has thus been estimated using a gradient-boosting approach with smooth components (the
individ-ual functions f1, ..., fK are estimated using P-splines, i.e. the individual
price functions are polynomials of the consumed quantities).5 To improve
5A multiple Box-Cox transformation of the regressors was initially attempted. However,
Swisscom
Number of boosting iterations
Squared Error 1 72 167 274 381 488 0 200 600 1000 Orange
Number of boosting iterations
Squared Error 1 72 167 274 381 488 0 200 600 1000
Figure 1: Boosting GAM, cross-validated models
the models’ out-of-sample prediction accuracy, the number of boosting itera-tions has been determined using a cross-validation approach. Figure 1 shows the average mean squared prediction errors of Swisscom and Orange and the optimal number of boosting iterations. Although not having obtained
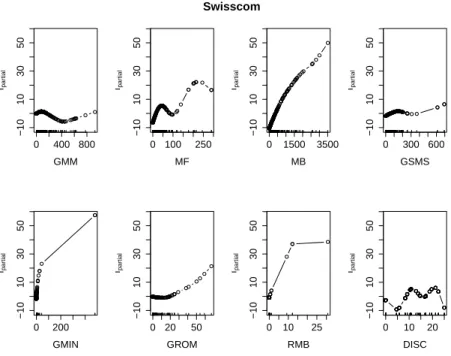
coef-ficients’ estimates, we can observe the partial dependency of the function fs
with respect to the individual variables.6 Figures 2 and 3 show the partial
dependency plot of Swisscom and Orange, respectively. Two interesting
facts can be observed in these figures. Firstly, the GAM and linear model do not differ concerning the impact of the individual variable on the cost func-tion: Variables possessing a coefficient not significantly different from zero, also possess a partial dependence plot represented by a constant nearly equal to zero. Secondly, significant variables in the classic linear model also display an almost linear partial dependence plot. This implies that the subscription options included in the error term seem not to affect the price behavior of the individual variables, thus supporting the use of the ordinary linear regression model.
The prediction performance of the two regression models has been compared using a cross-validation approach. Although the boosting approach has been tuned to improve his out-of-sample prediction accuracy, the OLS method seem to provide a slightly better prediction performance, thus further sug-gesting the use of the classical reference model in equation (4). However, the
6In the present context, a partial dependence plot represents the effect of one
consump-tion variable on the global cost funcconsump-tion fsafter accounting for the average effects of the
0 400 800 −10 10 30 50 GMM fpa rt ia l 0 100 250 −10 10 30 50 MF fpa rt ia l 0 1500 3500 −10 10 30 50 MB fpa rt ia l 0 300 600 −10 10 30 50 GSMS fpa rt ia l 0 200 −10 10 30 50 GMIN fpa rt ia l 0 20 50 −10 10 30 50 GROM fpa rt ia l 0 10 25 −10 10 30 50 RMB fpa rt ia l 0 10 20 −10 10 30 50 DISC fpa rt ia l Swisscom
Figure 2: Swisscom partial functions
0 200 400 0 20 40 60 80 GMM fpa rt ia l 0 200 400 0 20 40 60 80 MF fpa rt ia l 0 400 1000 0 20 40 60 80 MB fpa rt ia l 0 200 500 0 20 40 60 80 GSMS fpa rt ia l 0 20 40 0 20 40 60 80 GMIN fpa rt ia l 0 20 50 0 20 40 60 80 GROM fpa rt ia l 0 5 10 15 0 20 40 60 80 RMB fpa rt ia l 0 20 40 0 20 40 60 80 DISC fpa rt ia l Orange
prediction performance of the OLS approach is more unstable for the two providers (the mean squared prediction error greatly varies depending on the out-of-sample data).
3.4. Index Numbers
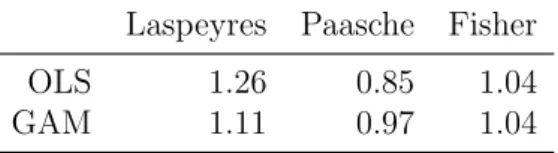
The Laspeyres, Paasche, and Fisher hedonic price indices have been es-timated using a double-imputation approach and are shown in Table 4. As can be seen, Laspeyres and Paasche price indices estimated using the model in equation (4) and the OLS technique display greater price differences than those estimated with the model in equation (3) and the boosting technique. This is probably due to the fact that generalized additive models possess a greater flexibility, and their tuning parameters (number of boosting itera-tions) have been selected to improve the out-of-sample prediction accuracy. In fact, the hedonic price indices values obtained with the generalized addi-tive model are more plausible than the values provided by the classic linear approach. Remarkably, the Fisher price indices of both approaches are equal.
Laspeyres Paasche Fisher
OLS 1.26 0.85 1.04
GAM 1.11 0.97 1.04
Table 4: Hedonic price indices, Swisscom as base
4. Conclusions
In the present paper, we proposed a new application of hedonic meth-ods to compare mobile communication prices across providers. In particular, Laspeyres, Paasche, and Fisher double-imputed hedonic price indices have been computed for two leading providers of the Swiss mobile communication market. Moreover, a hedonic regression model specific to the consumption of mobile services has been proposed and its sensitivity tested in the empirical part.
In contrast to the method presently used by the OECD, all the variables influencing the consumption of mobile services are considered in the index. Using a hedonic approach allows us to evaluate prices according to truly ob-served consumption and to treat all contracts or tariffs equally. Assumptions on perfect information and rational consumers are not needed.
Three main conclusions can be drawn from our study. Firstly, the generalized additive model confirms the use of the ordinary linear regression model: Indi-vidual consumption variables enter linearly in the price function, even if some
unobserved variables are included in the stochastic error term. Secondly, al-though it has a prediction performance similar to the linear model for a given provider, the GAM model estimated with a boosting approach and smooth components displays more reasonable prediction results when the hedonic re-gression estimated for one provider is used to predict the consumption prices of the other provider. Thirdly, independently of the regression method, the Fisher hedonic price index is stable. The provided methodology seems there-fore to provide a better alternative to the methods currently used to compare mobile communication prices across providers.
Importantly, many technical aspects have not been treated in the present paper. From an econometric point of view, a causal interpretation of the hedonic price function, for example, could be important to understanding which variables contribute the most to the bill amount for each provider. Such interpretation is not easily achieved, mainly because of the potential endogeneity and multicollinearity problems. From the point of view of price index theory, the proposed methodology could be extended to compare mo-bile communication prices of providers across several periods, thus providing the possibility to observe how the pricing system of mobile communication providers evolves during a given time period. These questions, however, rep-resent the subject of further research.
References
Federal Communications Commission, Feb. 2013. Mobile telephony. URL http://www.comcom.admin.ch/dokumentation/00439/00467/ Federal Office of Communications, 2012. Endkundenpreise im Mobilfunk:
Vergleich und Entwicklung der preisguenstigsten Produkte. Publikation, Bundesamt fuer Kommunikation BAKOM, Abteilung Telecomdienste. Hastie, T., Tibshirani, R., Friedman, J. H., Jul. 2003. The Elements of
Sta-tistical Learning, corrected Edition. Springer.
Hill, R. J., 2012. Hedonic price indexes for residential housing: A survey, evaluation and taxonomy. Journal of Economic Surveys.
OECD, 2010. Revision of the methodology for constructing telecommunica-tion price baskets. Tech. rep., OECD, Working Party on Communicatelecommunica-tion Infrastructures and Services Policy.
Sch¨oni, O., 2014. Four essays on statistical problems of hedonic methods: An
Seger, L., 2014. Price measurement in tariff systems. Ph.D. thesis, University of Fribourg, forthcoming.
Triplett, J., 2004. Handbook on hedonic indexes and quality adjustments in price indexes: Special application to information technology products. Working Paper 2004/9, OECD Directorate for Science, Technology and Industry, Paris.
Authors
Olivier SCHÖNI
Department of Informatics, Faculty of Economics and Social Sciences, Bd de Pérolles 90, 1700 Fribourg, Switzerland olivier.schoeni@unifr.ch
Lukas SEGER
Department of Economics, Faculty of Economics and Social Sciences, Bd de Pérolles 90, 1700 Fribourg, Switzerland lukas.seger@unifr.ch
Abstract
The present article proposes a new approach to compare mobile communication service prices among different communications service providers. To this end, a hedonic model based on monthly phone bills is employed that relates billed amounts and the quantities of consumed mobile communication services. A linear hedonic regression model is separately estimated for each provider and then used to estimate prices. Laspeyres, Paasche, and Fisher double-imputed price indices are then used to compare prices across communications service providers on an aggregate level. The sensitivity of these indices in relation to the estimated hedonic functions is investigated using a generalized additive model.
Keywords
Mobile communication, price indices, prediction, hedonic regression
JEL Classification
C43,C52, C53, P42
Citation proposal
Schöni Olivier, Seger Lukas. 2014. «Comparing Mobile Communication Service Prices Among Providers: A Hedonic Approach». Working Papers SES 448, Faculty of Economics and Social Sciences, University of Fribourg (Switzerland)
Working Papers SES
Last published :
440 Gmür M.: Finanzierungsmix und Effizienz in spendensammelnden Organisationen; 2013 441 Grossmann V., Schäfer A., Steger T.: Migration, Capital Formation, and House Prices; 2013
442 Spring E., Grossmann V.: Does Bilateral Trust Affect International Movement of Goods and Labor?; 2013
443 Isakov D., Weisskopf J.-P.: Do not wake sleeping dogs: Pay-out policies in founding family firms; 2013
444 Suter P., Gmür M.: Member Value in Co-operatives; 2013
445 Ravasi C.: Les top managers internationaux des grandes entreprises suisses: profils et parcours de carrière; 2013
446 Sudharshan D., Furrer O., Arakoni R. A.: Robust Imitation Strategies; 2013
447 Ravasi C., Salamin X., Davoine E.: The challenge of dual career expatriate management in a specific host national environment: An exploratory study of expatriate and spouse adjustment in Switzerland based MNCs; 2013
Catalogue and download links:
http://www.unifr.ch/ses/wp