INFLUENCE OF SOIL TYPE ON THE EFFECTS OF ELEVATED ATMOSPHERIC CO2AND N DEPOSITION ON THE WATER BALANCE
AND GROWTH OF A YOUNG SPRUCE AND BEECH FOREST
MARION A. SONNLEITNER1, MADELEINE S. GÜNTHARDT-GOERG2, INGA K. BUCHER-WALLIN1, WERNER ATTINGER1, SYBILLE REIS1
and RAINER SCHULIN1∗
1Institute of Terrestrial Ecology, Schlieren, Switzerland;2Swiss Federal Institute for Forest, Snow
and Landscape Research, Birmensdorf, Switzerland (∗author for correspondence, e-mail: [email protected])
(Received 8 July 1999; accepted 27 March 2000)
Abstract. Sixteen open-top chambers, each equipped with two non-weighable gravity-drained
lysi-meter compartments, were used to investigate the impacts of elevated atmospheric carbon dioxide (CO2) concentration and nitrogen (N) deposition on the water relations and growth of young model
forest ecosystems on two different types of soils. The same vegetation of a mixed spruce and beech overstorey and various herbs in the understorey was planted in all treatments on both soils. The soils were repacked on top of a drainage layer. Four combinations of treatments were applied in four replicates each: ambient (370 cm3m−3) CO2+ low (7 kg N ha−1a−1) N deposition, ambient CO2
+ high (70 kg N ha−1 a−1) N deposition, elevated (590 cm3m−3) CO2+ low N deposition, and
elevated CO2+ high N deposition. After canopy closure, treatment effects on evapotranspiration
and growth during the third year of study were very different for the two soils. On the acidic sandy loam, elevated CO2enhanced growth (leaf biomass +21%, roots +27%) at reduced
evapotranspira-tion (–9%). High N deposievapotranspira-tion increased aboveground growth even more strongly (+50%), but also increased evapotranspiration (+16%). Together, elevated CO2and high N had a more than additive fertilizer effect on growth, while their effects on evapotranspiration compensated. On the calcareous loamy sand, elevated CO2not only tended to enhance growth (leaf biomass +17%, roots +20%), but
also increased evapotranspiration (+5%). On this soil, aboveground growth was stimulated by N only in combination with elevated CO2, but less than on the acidic soil, while evapotranspiration (–6.5%)
and root growth into the subsoil (–54%) were decreased by increased N deposition at both CO2
concentrations, in contrast to the N treatments on the acidic sandy loam. The influence of the soil on the observed ecosystem responses can be interpreted in terms of the concept of optimal resource allocation.
Keywords: elevated carbon dioxide, evapotranspiration, leaf area index, model ecosystems, nitrogen
deposition, soil water potential, water balances
1. Introduction
If atmospheric carbon dioxide (CO2) concentrations continue to rise as they did during the last decades, a doubled preindustrial concentration will be reached in the middle of the 21st century. In addition to indirect influences through global climatic greenhouse effects, this trend can also have strong direct influences on
eco-Water, Air, and Soil Pollution 126: 271–290, 2001.
272 M. A. SONNLEITNER ET AL.
systems through increased availability of CO2for photosynthesis. At the physiolo-gical level, elevated CO2was in general found to enhance photosynthesis, growth, and to enhance belowground allocation of assimilates, when nutrients are limiting (Bazzaz, 1990; Curtis and Wang, 1998; Tyree and Alexander, 1993).
As a direct result of increased availability of CO2the instantaneous transpira-tion efficiency, i.e. the ratio of the rate of assimilatranspira-tion to the rate of transpiratranspira-tion, increases, leading to an increased ratio of dry matter production to transpiration (Eamus, 1991). This increase in water use efficiency (WUE) on the leaf level can result in increased growth, reduced water consumption, or a combination of both. Reduction of transpiration is usually achieved by decreasing stomatal conduct-ance, while enhanced growth tends to offset this water-conserving effect on the whole-plant or canopy level by increasing the transpiring leaf area (Eamus, 1991; Pritchard et al., 1999; Tyree and Alexander, 1993). The final responses do not only vary with plant species, but also depend on environmental constraints such as temperature, availability of light, nutrients and water, as well as pollutant and salinity stresses (Bazzaz, 1990; Field et al., 1992; Idso and Idso, 1994; Saxe et
al., 1998). If water is a limiting factor, increased WUE allows plants to conserve
soil water resources and to sustain photosynthesis over longer periods of drought. If water supply is not limiting, elevated CO2 may stimulate growth to an extent that the increase in transpirational demand overrides the water-saving effect of the increase in water-use efficiency (Field et al., 1995; Eamus, 1996).
Most studies on the effects of elevated CO2 on plant growth and water use have examined biochemical and physiological short-term responses at the leaf and individual plant level. How plants respond over longer periods to elevated CO2and how responses translate from the plant level to the ecosystem level under conditions of competition and environmental stress is much less understood (Körner, 1995). On the community level intra- and interspecific competition may cancel some in-dividual CO2 effects, but amplify others, depending also on species composition and site factors such as resource availability (Bazzaz and Garbutt, 1988; Saxe et
al., 1998).
Particularly little is known about the influence of soil factors on the responses of ecosystems on elevated CO2. Most of the pertinent studies have dealt with the influence of nitrogen (N) fertilization, independent of other soil factors (Curtis and Wang, 1998; McGuire et al., 1995; Pritchard et al., 1999; Runion et al., 1999; Saxe
et al., 1998). Apart from fertilizing growth and increasing the leaf area index, N has
been found to enhance water use efficiency in agricultural crops as well as in forest stands (e.g. Hatfield et al., 1988; Reich et al., 1989; Fife and Nambiar, 1995). Such influences may be understood in terms of the resource-allocation concept proposed by Field et al. (1992). According to this concept plants will in general respond to altered resource supply by increasing allocation of biomass and nutrients to organs that acquire the most limiting resources, tending to make all resources equally lim-iting to growth (Bloom et al., 1985). Thus, in ecosystems with limlim-iting nutrients or water, increases in biomass production due to elevated CO2 are expected to
EFFECTS OF ELEVATED CO2AND N ON WATER BALANCES OF FOREST 273 be allocated more in favour of root than of shoot growth, especially when other resources are nonlimiting and for species with high growth potential (Field et al., 1992).
Some studies suggest that CO2effects on water relations may still be signific-ant at the ecosystem level despite compensation and acclimation effects (Eamus, 1991; Lankreijer, 1998). Elevated CO2was found to reduce evapotranspiration of grassland communities by 3 to 27% (Diemer, 1994; Bremer et al., 1996; Stocker
et al., 1997). In experiments with mature oak trees, a tropical forest ecosystem in
a greenhouse and with juvenile beech or pine stands, evapotranspiration or at least transpiration was reduced up to 14% (Tognetti et al., 1999; Körner and Arnone, 1992; Ellsworth et al., 1995; Overdieck and Forstreuter, 1994).
Modeling studies show that the responses of trees to rising levels of CO2 may have substantial hydroecologial impacts (e.g. Hatton et al., 1992) and that wa-ter availability can be an important limiting factor for growth on the catchment scale (Churkina et al., 1999). Direct observations of CO2 effects on the water regimes of forest ecosystems, however are rare. Addressing this lack of direct experimental evidence at the ecosystem levels, we performed a factorially designed lysimeter experiment in which we investigated the effects of elevated atmospheric CO2concentrations on the water regime of mixed spruce-beech forest regrowth in the temperate, humid climate of central Europe, at two levels of N deposition and for two different soils.
The two soils used in this study were selected to represent different levels of soil fertility in terms of base cation availability, and also to be as similar as possible in their physical structure in order to avoid that soil fertility effects on the plant-water relation of the various treatments were confounded by differences in soil hydraul-ics. Using repacked soils, comparisons between treatments were not invalidated by heterogeneity. The packings were large enough to represent conditions of root competition as in a fully natural environment.
The study was part of a larger project described by Landolt et al. (1997). This article deals with the water regime in relation to growth effects at the ecosystem level in the third year, when canopies were closed. Preliminary results of the first two years are presented in Sonnleitner et al. (1997).
2. Materials and Methods
2.1. OPEN-TOP CHAMBERS AND LYSIMETER INSTALLATIONS
The experiments were performed in the open-top chamber facility of the Swiss Fed-eral Institute of Forestry, Snow and Landscape Research, Birmensdorf (Switzer-land), which is situated close to the city of Zurich at 450 m above sea-level (1997 Birmensdorf had an air temperature of 8.5 ◦C (mean), –12.6 ◦C (min), 30.6 ◦C (max), and 998 mm of rain). Each of the 16 hexagonal open-top chambers was
274 M. A. SONNLEITNER ET AL.
equipped with a glass roof which could be opened and closed automatically by motor-driven horizontal siding to exclude precipitation. The chambers were 3 m high (above ground) and 3 m wide (internal distance between opposing hexagonal sides). The soil compartment of each chamber was divided into two 1.5 m deep concrete-walled soil compartments of 3 m2 surface area each and a cylindrical access tube of 1.25 m diameter in between them. The compartments were used as non-weighable lysimeters. At the bottom of a 0.5 m deep packing of three quartz filter layers, changing in texture from a coarse sand at the top to a fine gravel at the bottom, the drainage water of each compartment was conducted through three outlets into the central access tube and collected there in plastic containers to determine the outflow.
2.2. SOILS
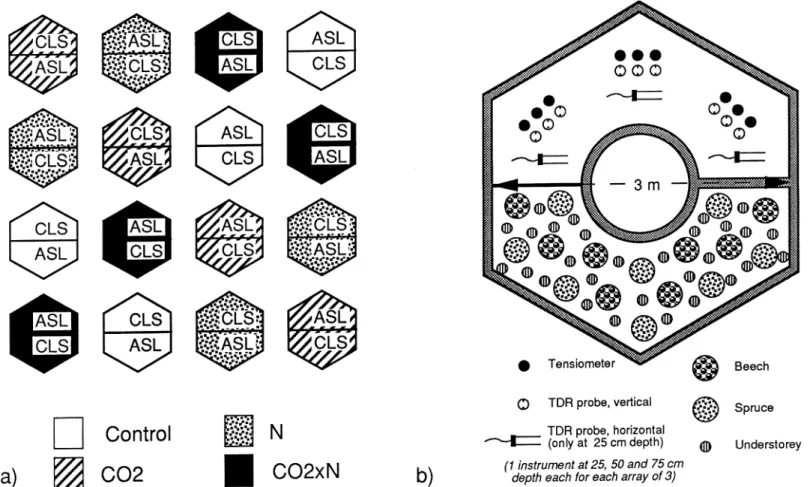
On top of the drainage packing, the two lysimeter compartments of each chamber were filled in spring 1994 with two different soils from two forest sites in the vi-cinity of Zurich. One soil was a calcareous loamy sand originating from a Calcaric Fluvisol along the river Aare at Brugg (Kanton Aargau), the other an acidic sandy loam deriving from a Haplic Alisol on Riss moraine nearby Rafz (Kanton Zürich). Corresponding to the lack of distinct soil horizons in the sampled fluvisol, the calcareous loamy sand (CLS) was filled into the lysimeter in one layer, whereas in the case of the acidic sandy loam (ASL) a 0.4 m topsoil layer and a 0.6 m subsoil layer were packed separately in accordance with the original layering of the material. Characteristic properties of the various soil layers are given in Table I. Soil packing was performed in the same way in all chambers, but the allocation of soil type within the chambers with respect to the general direction (north-south) was varied systematically from chamber to chamber as shown in Figure 1.
2.3. VEGETATION
On each lysimeter, 8 saplings of Norway spruce (Picea abies), 8 saplings of beech (Fagus sylvatica) and several individuals of five understorey species (Carex
sylvat-ica, Geum urbanum, Hedera helix, Ranunculum ficaria, and Viola sylvatica), each
occurring spontaneously at both soil sampling sites, were planted in autumn 1994. The trees were chosen to represent different genotypes of both species. The ar-rangement of plants, which was the same for all lysimeters, represented a stratified random design ensuring a realistically mixed composition, but also a fairly even ground coverage. Further description of the vegetation and of technical details of the open-top chamber facility is given by Landolt et al. (1997).
2.4. CO2ANDNTREATMENTS
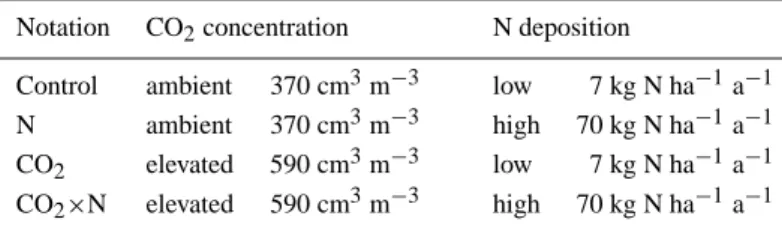
The four combinations of CO2and N treatments applied in this study are denoted as ‘control’, ‘CO2’, ‘N’ and ‘CO2×N’ (Table II). Ambient air was supplied through
EFFEC T S O F ELEV A TED C O 2 AND N O N W A TER B A LANCES OF FOREST 275
Figure 1. Situation of the open-top chambers. a) Latin square arrangement of treatments, ASL: acidic sandy loam, CLS: calcareous loamy sand, for notation of CO2and N treatment cf. Table IIb) Instrumentation and planting design within a chamber, each shown for only one of the two lysimeter compartment within the chamber.
276 M. A. SONNLEITNER ET AL.
TABLE I
Characteristic properties of the experimental soils
Property Unit Acidic sandy loam Calcareous Topsoil Subsoil loamy sand
pH (in CaCl2)a 3.7 3.8 7.0
Organic matter contenta kg (kg soil)−1 0.018 0.001 0.012 Carbonate contenta kg (kg soil)−1 – – 0.19
Porositya m3m−3 0.54 0.43 0.56
Mass fraction of sanda kg (kg soil)−1 0.55 0.55 0.84 Mass fraction of silta kg (kg soil)−1 0.29 0.27 0.10 Mass fraction of claya kg (kg soil)−1 0.16 0.18 0.06 Cab meq (kg soil)−1 14.3 no data 124 Kb meq (kg soil)−1 1.17 no data 0.57 P (Olsen)b mg (kg soil)−1 2.1 no data 6.5 N exchangeable (KCl)b mg (kg soil)−1 2.4 no data 3.8
aMeasured at the beginning of the experiment.
bMeasured at the end of the experiment (personal communication, F. Hagedorn).
TABLE II
CO2and N treatments applied in this study (averages of April-September
1997)
Notation CO2concentration N deposition
Control ambient 370 cm3m−3 low 7 kg N ha−1a−1 N ambient 370 cm3m−3 high 70 kg N ha−1a−1 CO2 elevated 590 cm3m−3 low 7 kg N ha−1a−1
CO2×N elevated 590 cm3m−3 high 70 kg N ha−1a−1
wide porous tubes along the lower parts of the chamber walls. In the ‘CO2’ and ‘CO2×N’ treatments 220 cm3 m−3 CO2 were added to the ambient air. In the ‘N’ and ‘CO2×N’ treatments, NH4NO3 was added to the irrigation water. In the ‘N’ and ‘CO2×N’ treatments we increased total input to 25 (1995), 50 (1996), 70 (1997) kg N ha−1 a−1. In the ‘control’ and ‘CO2’ treatments only 2.5 (1995), 5 (1996), 7 (1997) kg N ha−1 a−1 were given. The irrigation scheme was in general adapted to the actual water demand of the vegetations, except for those few periods in which drought conditions were imposed or tolerated on purpose (see below). The four treatments were applied in four replicates each, using a Latin square scheme (cf. Figure 1) in order to allow for a statistical control of edge and row effects.
EFFECTS OF ELEVATED CO2AND N ON WATER BALANCES OF FOREST 277
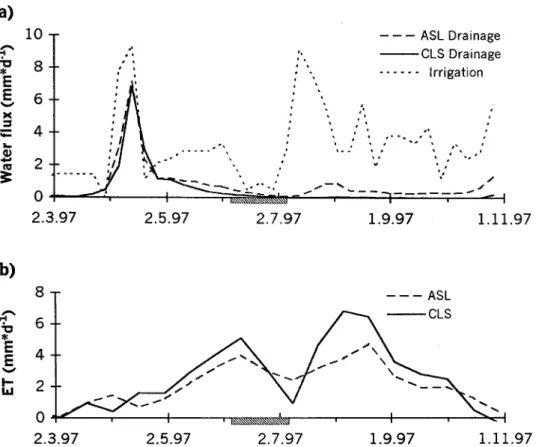
Figure 2. a) Average weekly irrigation and drainage rates in the control treatments of the two soils. The same irrigation rates were applied to all other treatments as well. b) Average actual evapotran-spiration in the control treatments calculated from water balances over two-week periods. Horizontal bars indicate the no-irrigation period.
2.5. WATER REGIME
Uncontrolled input of water and wet deposition of N was prevented by closure of the roofs. Irrigation water was supplied equally in all treatments by sprinklers located above the canopy (7 per soil compartment, controlled by flow meters). Figure 2a gives an overview over the irrigation regime. In the first growing season after plantation (1995) soil moisture was always kept close to field capacity. In the following growing seasons, irrigation was schemed to match average monthly rates of precipitation of the site during the growing periods and also to mimic approx-imately the intensity-frequency distribution of the site during the growing season, however avoiding water-logging conditions as well as severe drought stress. Ex-ceptions were two experimental drought periods with no or little irrigation (10 mm week−1) over three respectively four weeks imposed in August 96 and in June 97, as well as an unusually hot and dry period in August and September 97, when irrigation was kept on purpose according to the schedule of long-term average
pre-278 M. A. SONNLEITNER ET AL.
cipitation. In winter, soils were kept at low moisture to avoid freezing of drainage and irrigation systems. In March, prior to the start of the growing season, soils were flushed to remove accumulated solutes. All lysimeters were irrigated with the same amount of water.
The containers collecting the drainage water were usually emptied at weekly intervals. The amount of water was measured volumetrically using plexi cylinders. Soil water contents were measured weekly during the growing season by time domain reflectometry (TDR). For the assessment of water storage changes vertical TDR probes of 25 cm length were installed centering at 25, 50 and 75 cm depth. One replicate lysimeter per treatment and soil was equipped with three probes per sampling depth, while only one probe was installed per sampling depth in the other lysimeters. TDR signals were calibrated and analyzed following the procedure of Roth et al. (1989), taking account of soil temperature. Temperatures were measured in 4 representative lysimeters at 25, 50 and 75 cm depth. Temperature variations between lysimeters were negligible.
Soil water potentials were recorded manually once a week using the method of Marthaler et al. (1984). Tensiometers were installed in three replicates per depth in all lysimeters. The cups of the tensiometers centered at the same depths as the TDR probes, i.e. at 25, 50 and 75 cm.
Actual evapotranspiration (ET), which also includes interception losses, was determined once a week during growing seasons and once a month in winter from the water balance:
ET = irrigation - drainage - water storage change.
2.6. ROOT DISTRIBUTION PROFILES
Vertical profiles of root distribution were determined in June 1997. From each of the 32 lysimeters we took two soil cores of 5 cm diameter to a depth of 75 cm and cut them into 5 cm long sections. Soils were air-dried, weighed, and roots were sorted out manually by washing the soil through sieves with successively decreasing mesh sizes of 2, 1 and 0.5 mm.
2.7. LEAF AREA AND BIOMASS
Four leaves of every beech and one new twig of every spruce tree were harvested in September and analyzed biometrically as described in detail by Egli et al. (1998). Furthermore, the first and second flush leaves of every second beech were counted and the numbers and lengths of recent spruce shoots were determined. Needle surface was estimated by aliquots of representative needles (cross cuttings and lengths) for each tree. From these measurements the total leaf area and leaf dry mass production of the canopies were estimated. Leaf areas refer to the stomata-covered areas, i.e. to one leaf side for beech leaves and total surface of the rhomboid
EFFECTS OF ELEVATED CO2AND N ON WATER BALANCES OF FOREST 279 spruce needles. The aboveground biomass of the understorey varied considerably over the season (Egli et al., 1998). Because of its small size in comparison with the tree biomass, it was not included in our analysis.
2.8. STATISTICAL ANALYSIS
Effects of factors were tested statistically using cross-factorial ANOVA models. Each soil was tested separately. The effects of the north-south exposure of soil compartments and of their positions in central or marginal rows in east-west dir-ection were taken into account as additional categorical cross factors, where they were of significant influence. In the analysis of water potentials, depth was treated as an additional categorical cross factor.
3. Results
3.1. WATER BALANCES
Figure 2 shows the time course of irrigation and evapotranspiration on the basis of weekly water balances for the control treatments of the two soils. During the growing season evapotranspiration was higher on the calcareous than on the acidic soil (Figure 2b), while there was no significant difference at other times. The lar-ger fluctuations of water consumption on the calcareous soil conformed with the different hydraulic properties of the two soils.
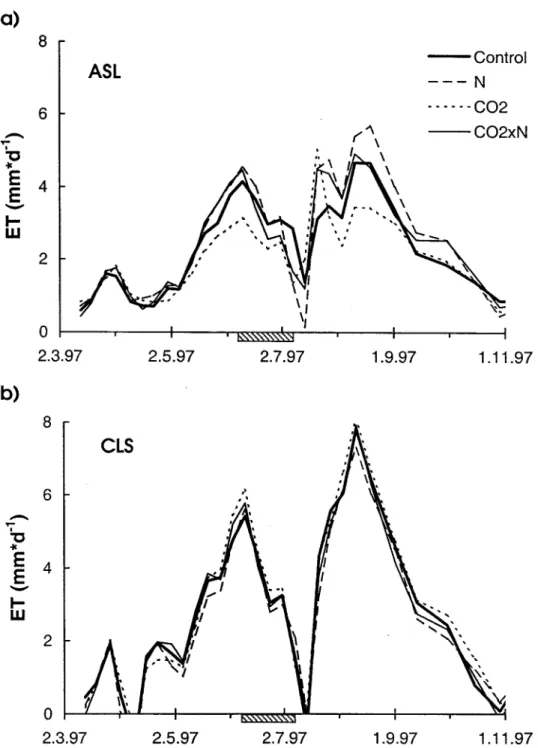
Significant treatment effects were found on both soils. On the acidic soil, elev-ated CO2 reduced cumulative ET over the entire growing season by 9% (pooled across both N treatments), while N enhanced it by 16% (pooled across both CO2 treatments). On the calcareous soil the opposite was observed: CO2enhanced evapo-transpiration (5% over the entire growing season, pooled across both N treatments), while N decreased it (–6.5% in average, pooled across both CO2treatments). Ef-fects in the combined ‘CO2×N’ treatment seemed to compensate on both soils (Table III, ETtot). Treatment effects became maximum in the periods of high de-mand in June and August during the two drought periods (Figure 3).
3.2. SOIL MOISTURE REGIMES
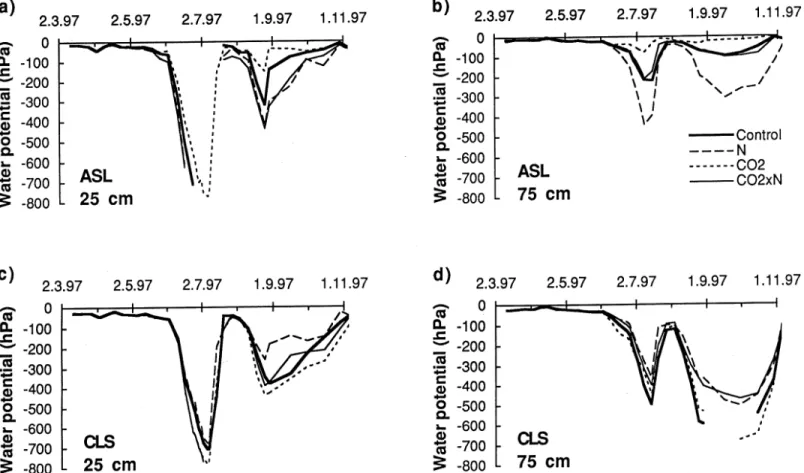
The soil water potential measurements confirm the picture obtained from the water balances, but give more detail with respect to the depth profiles of water availability and stress over the seasons. Figure 4 shows the time course of the tensiometric potentials of the two soils in 1997 for 25 and 75 cm depth, averaged by treatments. No values are given for times at which water potentials exceeded the measurement range of the tensiometers. The two periods of drought imposed in 1997 (see Mater-ials and Methods) are well recognizable in the curves. Watering was deliberately continued according to the preset schedule during the second drought period. This
280 M. A. SONNLEITNER ET AL. TABLE III
Treatment effects on water consumption and growth parameters (mean±SE). LB = leaf (beech) and needle (spruce) biomass per ground area in September 1997 (including up to 3 yr old needles), ARMD = areal density of coarse root dry mass down to 75 cm depth in June 1997, RLBR = ARMD: LB, LA = leaf area relevant for transpiration (beech: one-sided area; spruce: total surface) per ground area, LMA = LB:LA, ETtot= cumulative evapotranspiration from 4 April to 30 September 1997, WUE = leaf and needle biomass produced in 1997: Ettot. Levels of significance (F-probabilities):∗ P < 0.05; ∗∗ P < 0.01; ∗∗∗ P < 0.001
Parameter Unit Soil Treatment Significance
Control N CO2 CO2×N PCO2 PN LB g m−2 ASL 596±77 817±72 655±85 1056±74 0.08 ∗∗ CLS 881±75 812±65 935±87 1048±49 0.06 n.s. ARMD g m−2 ASL 710±67 743±68 834±60 1018±102 ∗ n.s. CLS 767±109 306±46 851±100 438±72 n.s. ∗∗∗ RLBR g g−1 ASL 1.19±0.13 0.91±0.10 1.27±0.22 0.96±0.10 n.s. ∗ CLS 0.87±0.23 0.39±0.08 0.91±0.13 0.41±0.08 n.s. ∗∗ LA m2m−2 ASL 11.95±1.28 16.49±1.04 11.63±1.08 18.32±1.09 n.s. ∗∗ CLS 16.83±1.37 16.43±1.54 16.88±1.14 18.92±0.47 n.s. n.s. LMA g m−2 ASL 49.6±1.4 49.3±1.4 55.8±2.6 57.6±1.4 ∗∗ n.s. CLS 52.4±1.8 49.7±1.1 55.2±2.3 55.3±1.5 ∗ n.s. ETtot mm ASL 474±25 533±16 416±17 501±26 ∗∗ ∗∗∗ CLS 606±17 558±8 630±23 597±25 ∗ ∗ WUE kg m−3 ASL 0.93±0.10 1.17±0.10 1.14±0.16 1.53±0.06 ∗ ∗ CLS 1.19±0.13 1.16±0.10 1.16±0.11 1.37±0.12 n.s. n.s. ETtot/LA mm ASL 40.5±3.2 32.7±2.0 36.5±2.6 27.5±1.4 0.08 ∗∗ CLS 37.0±4.2 34.9±3.5 37.6±1.3 31.7±2.0 n.s. n.s.
EFFECTS OF ELEVATED CO2AND N ON WATER BALANCES OF FOREST 281
Figure 3. Averages (treatments pooled) of the weekly evapotranspiration rates for a) the acidic sandy loam (CO2and N effects were highly significant: PCO2 < 0.01, PN< 0.001) and b) the calcareous
loamy sand (CO2and N effects were significant: P < 0.05. Horizontal bars indicate the no-irrigation
282 M. A. SONNLEITNER ET AL.
explains why the topsoil of the calcareous soil remained wetter than the desiccated subsoil, in contrast to the moisture profiles during the experimental drought period a few weeks before. In contrast, water stress was much less severe in the acidic soil. Except for the ‘N’ treatment, the subsoil of the acidic soil remained wetter than the topsoil. In particular in the ‘CO2’ treatment only a very small water stress effect was observed in the topsoil and almost none in the subsoil of the acidic soil during the second drought.
These observations indicate that treatment effects differed in proportion to each other between depths as well as between periods. Treatment effects on water po-tential were evident only during periods of high water consumption. When water became scarce, the water potentials of the acidic soil always decreased much faster in the ‘N’ than in the ‘CO2’ treatment, while the ‘control’ ranged in-between. The response of water potentials in the combined ‘CO2×N’ treatment, however, varied relative to the others with depth. Water potentials were similar to those of the ‘control’ in the subsoil, but indistinguishable from the ‘N’ treatment in the topsoil. A much different and in some way opposite pattern was observed in the cal-careous soil. Here, the water potentials remained always higher in the ‘N’ than in the ‘CO2’ treatment during drought periods. This difference was much more pronounced in the second than in the first drought period. In the subsoil the water potentials of the ‘control’ closely followed those of the ‘CO2’ treatment, while in the topsoil water potentials of the ‘control’ were similar to the ‘N’ treatment in the first drought and ranged in-between ‘N’ and ‘CO2’ treatment in the second drought. The response of water potentials in the combined ‘CO2×N’ treatment, showed the opposite behaviour to the controls. In the subsoil they followed a course very similar to the ‘N’ treatment, while in the topsoil they followed more closely the course of the ‘CO2’ treatment.
The analysis of variance of averaged water potentials revealed significant inter-actions between CO2effects and depth for both soils in 1997. The CO2effect was stronger in the topsoil than in the subsoil on the calcareous soil, while it tended to increase with depth in the acidic soil.
The TDR measurements (data not shown) revealed the same relationships between the treatments in terms of water content as the tensiometer measurements did in terms of water potential.
3.3. VERTICAL ROOT DISTRIBUTIONS
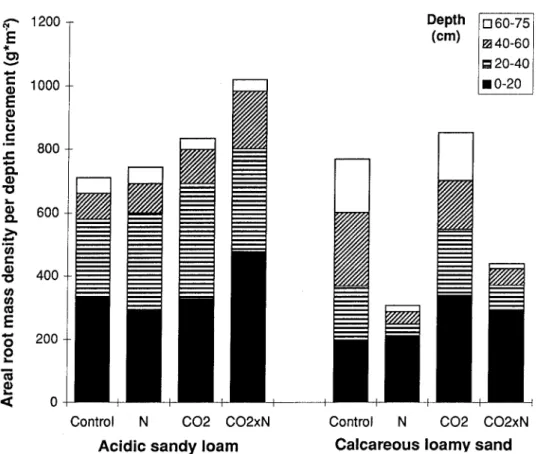
Figure 5 shows the average root dry mass per unit ground area with increasing depth down to a maximum depth of 75 cm in June 1997. As with the water re-gime, the treatments had quite different effects in the two soils. In the acidic soil, CO2enhanced the development of the root system by 27% (pooled across both N treatments). Increased N deposition tended to enhance it as well, but the observed 14% increase (averaged over both CO2treatments) was not significant. In the com-bined treatment ‘CO2×N’ the effect was stronger than the sum of the effects of
EFFEC T S O F ELEV A TED C O 2 AND N O N W A TER B A LANCES OF FOREST 283
Figure 4. Averages of the tensiometric soil water potentials for the acidic sandy loam (top) and for the calcareous loamy sand (bottom), in 25 cm (left) and 75 cm (right) depth, during the growing period in 1997. On both soils CO2and N effects were highly significant (P < 0.001).
284 M. A. SONNLEITNER ET AL.
Figure 5. Average root dry mass per unit ground area over depth in June 1997. On the acidic sandy loam the CO2effect was significant (P < 0.05) and on the calcareous loamy sand the N effect was
highly significant (P < 0.001).
the ‘CO2’ and ‘N’ treatments. Deviations from this general pattern in individual layers were within the range of sampling variability. In the calcareous soil, again an enhancement of root development was recorded at elevated CO2(20%, averaged over both N treatments), however, it was statistically not significant. On the other hand, high N deposition suppressed the development of roots in the calcareous sub-soil significantly (–54%, averaged over both CO2treatments), but had no influence on the root mass of the upper layer (0–20 cm). At low N deposition, roots tended to be more evenly distributed over depth in the calcareous soil than in the acidic soil. This may have resulted from the denser packing and lower permeability of the lower layers of the acidic soil as compared with its upper layers and with the calcareous soil.
3.4. EFFECTS ON OTHER GROWTH AND WATER-USE PARAMETERS
Table III shows the treatment effects on various growth and water consumption parameters at the ecosystem level for the growing season of 1997. CO2enhanced
EFFECTS OF ELEVATED CO2AND N ON WATER BALANCES OF FOREST 285 leaf and needle production on both soils, in particular in synergism with N (in average 21% on the acidic soil and 17% on the calcareous soil). The CO2 effect was significant when biomass was pooled across both soils and both N treatments. N increased leaf and needle growth by 50% (pooled across both CO2treatments) on the acidic soil, but only in synergism with elevated CO2on the calcareous soil. At ambient CO2, N tended to decrease aboveground growth on the latter soil.
Viewing the effects on below and above ground biomass production together, the addition of N in all combinations clearly reduced the ratio of root to leaf and needle mass (RLBR), while CO2had no effect on it.
The parameter LA in Table III, gives an estimate of the total transpiring leaf-area in the upperstorey per unit ground leaf-area. In the control treatments leaf leaf-area was approximately 40% larger on the calcareous than on the acidic soil. Whereas elevated CO2 had no effect, elevated N deposition strongly increased leaf area on the acidic soil only and made it reach the same level as the leaf area of the calcareous soil.
The ratio between LB and LA, which corresponds to the upperstorey mean leaf and needle mass per unit of transpiring area (LMA), increased significantly with elevated CO2on both soils, but was not influenced by N. Consequently the mass-specific transpiring leaf area, defined as the inverse ratio of LMA decreased with elevated CO2.
Water-use efficiency (WUE), here refers to the ratio between leaf and needle biomass production and total evapotranspiration over the growing season (LB:ETtot). WUE was increased by CO2and N on the acidic soil and more than additive in the combined ‘CO2×N’ treatment, but increased only in the combined ‘CO2×N’ treatment on the calcareous soil. The CO2effect was expected, as increase of WUE is among the most consistently reported effects of elevated CO2on plants (Eamus, 1991; Field et al., 1995; Saxe et al., 1998). The lack of such a response on the calcareous sandy loam at low N deposition was therefore rather surprising.
The ratio between cumulative evapotranspiration and LA, which represents a seasonal average of leaf conductances, seemed to be unaffected by the treatments on the calcareous soil (Table III, ETtot/LA). On the acidic soil, however, this ratio was significantly reduced by N and, in tendency at least, also by elevated CO2. The latter CO2 effect agrees with the commonly reported finding that plants usually respond to elevated atmospheric CO2by reducing stomatal conductance.
Table III shows that N deposition increased WUE primarily or even entirely due to decreasing leaf conductance. However, increasing mass per transpiring leaf area contributed substantially more to the enhancement of WUE by CO2than did reduced leaf conductance, in particular under low N. The latter effect is in agree-ment with observations of increased leaf thickness under elevated CO2(Tyree and Alexander, 1993).
286 M. A. SONNLEITNER ET AL.
4. Discussion
The results show that elevated atmospheric CO2 concentration and increased N deposition can significantly affect not only the growth, but also the soil water relations of young beech-spruce forest stands, and that these effects may critic-ally depend on soil type. This may be understood in terms of the resource-based approach proposed by Field et al. (1992).
4.1. TREATMENT EFFECTS ON THE ACIDIC SANDY LOAM
On the acidic sandy loam both, high CO2and high N treatments led to a fertiliz-ation effect in promoting biomass production. In combinfertiliz-ation, their effects were more than additive. CO2enrichment alone promoted especially root, but not much leaf and needle growth. In terms of resource optimization, the shift in allocation means that on this rather nutrient-poor soil belowground resources became much more limiting to growth than aboveground resources by the increased availability of CO2. Development of more extensive root systems allows to exploit soil to a larger extent for limiting water and mobile nutrients and is a typical response of plants grown under elevated CO2(Idso and Idso, 1994; Saxe et al., 1998). In the case of the vegetation on the acidic sandy loam here, N was apparently the main limiting nutrient. Application of this nutrient not only produced a fertilization ef-fect, but also caused the ratio between root mass and aboveground production to decrease, compensating in the combined treatment the opposing effect of CO2on resource allocations. If other soil nutrients would have been limiting, we should have expected no such shift in the high N treatments.
Contrary to the effect of CO2, growth enhancement by N deposition was associ-ated with increased water consumption on the acidic sandy loam, while water use efficiency increased to the same extent in the high N as in the high CO2treatments. In the case of elevated CO2 increased water use efficiency may result, at least partially, as a direct consequence of an increased ratio between CO2 and water vapour gradients, which are driving the diffusing exchange of these gases across the stomata. In contrast, N can affect water use efficiency only indirectly through an increased photosynthetic capacity and efficiency of biochemical CO2assimilation and by decreasing the fraction of assimilates allocated to maintenance respiration and exudation in favour of growth (Field et al., 1992). It may be interesting to note, therefore, that the increase in water use efficiency was achieved in different ways in the high CO2and the high N treatments. The N effect was due to reduced tran-spiration per leaf area, while the CO2effect primarily corresponded to increased mass per transpiring leaf area. Together they have a more than additive effect. In terms of optimal resource allocation, a decrease in transpiration per leaf area may be understood as a reaction to restore balance between limiting water supply and increased availability of nutrients limited by transpiration-coupled uptake, without affecting the interception of light.
EFFECTS OF ELEVATED CO2AND N ON WATER BALANCES OF FOREST 287 Irrespective of the mechanisms involved, the effects of increased N on growth and water use of the acidic sandy loam model ecosystems are in agreement with N effects on other plants. For example, Hatfield et al. (1988) found that N in-creased water use efficiency, LAI and yield of winter wheat, except for very high fertilization rates at which excessive water consumption caused drought stress.
4.2. TREATMENT EFFECTS ON THE CALCAREOUS LOAMY SAND
While the responses of the model ecosystems on the acidic sandy loam agreed well with the effects observed in most other work (cf. Overdieck and Forstreuter, 1994; reviews of Bazzaz, 1990; Field et al., 1992, Tyree and Alexander, 1993; Field et al., 1995; Saxe et al., 1998), the calcareous loamy sand produced rather unusual effects which were in many respects opposite to those of the other soil. Nonetheless, the concept of optimal resource allocation provides plausible and meaningful explan-ations, demonstrating its usefulness. The lack of a positive growth response in the high N treatments at ambient CO2 indicates that growth on the calcareous loamy sand was not limited by this nutrient, at least not directly. This is in agreement with rather high nitrate concentrations measured in the outflow of the calcareous soil, while only traces of nitrate were found in the outflow of the acidic soil (personal communication Jürg Bucher). It is known that nutrient deficiency in general favours root growth (Norby et al., 1986). The negative root growth response on high N treatments, thus, indicates that sufficient nutrients were available in the topsoil so that there was little need to forage for N or other nutrients in the subsoil. The fact that, contrary to what is usually observed, elevated CO2did not significantly favour root growth suggests that CO2was the most severely growth-limiting resource on the calcareous loamy sand.
Soil water availability was apparently not the most critical limiting factor for plant growth on the calcareous loamy sand, as water-use efficiency was not in-creased except by the combined ‘CO2×N’ treatment. In the latter treatment, evapo-transpiration still tended to exceed that of the ‘control’ treatment, but less than in the ‘CO2’ treatment. In the combined ‘CO2×N’ treatment water demand may not have been met to the same extent as in the ‘CO2’ treatment because the root systems were less developed in response to N eutrophy in the topsoil. The results for the calcareous loamy sand are at variance with the general notion that elevated CO2 tends to decrease water consumption. But they agree with the expectation of Field
et al. (1995) that evapotranspiration could even increase under increased CO2 if a shift of resources from foraging for CO2 to foraging for water would allow for more efficient exploitation of the soil.
At ambient CO2, increased N not only reduced water consumption, but also had no fertilizing effect or even tended to slow down aboveground growth on the calcareous loamy sand. Toxicity of soil N to plants is not known under the applied conditions. As no symptoms of limitations by other nutrients were ob-served, we relate the growth-reducing effect of the ‘N’ treatment to the reduced
288 M. A. SONNLEITNER ET AL.
root development in the subsoil. The lack of roots in the subsoil may have hindered the vegetation to exploit the available water with the same efficiency as in the low N treatments. In the case of the combined ‘CO2×N’ treatment, the reduction of the root development in the subsoil was apparently compensated by enhanced allocation of assimilates for root growth and, as the water potential data suggest, probably also for water uptake in the topsoil.
Differences in evapotranspiration between treatments were smaller on the cal-careous loamy sand than on the acidic sandy loam, but likewise consistent over the entire growing season. As they did not only occur during periods of water shortage, the reduced water consumption under increased N deposition cannot be attributed to limitations of soil water availability during the drought periods. In fact, the measured soil water potentials do not indicate higher water stress under high than under low N deposition at any depth of the calcareous loamy sand, but rather the opposite.
4.3. RELEVANCE OF THE RESULTS FROM MODEL ECOSYSTEMS FOR REAL
ECOSYSTEMS
In our experimental approach soil, vegetation and climate conditions were kept under control as much as possible to enable maximum separation of the influence of the factors under study. On the other hand, this approach involves a certain risk of experimental artefacts which cannot be completely excluded. Excavation and repacking certainly caused some disturbance of the soils, stimulating increased de-composition of organic matter and mineralization of nutrients. As the two soils se-lected had little structure because of their low content in cohesive components, their responses to the mechanical disturbance by re-consolidation and increased nutrient leaching had faded out to negligible rates after the first year. Furthermore, frequent mechanical perturbations were a natural condition for the calcareous loamy sand at its site of origin.
Due to the greenhouse effect of the chambers, which led to higher temperature (average increase +1.6◦C) and lower humidity (average decrease –1.4 mbar) than in the free air outside (see Landolt et al., 1997), not only the edaphic, but also the climatic conditions were influenced by the experimental set-up and, thus, not fully natural. This had probably some influence on the magnitude of the observed effects, as plants tend to operate near the fundamental biochemical constraints set by enzyme kinetics and membrane fluidity (Fields et al., 1992). Rawson (1992) reported that the yield difference between plants grown at twice-ambient and at ambient CO2concentrations generally increased by around 2% for every 1◦C rise in temperature. Therefore we do not expect that our results would have been much different under open-air conditions.
While our system was only quasi-natural in view of the before-mentioned exper-imental conditions, they were much closer to field conditions of ecosystems than greenhouse experiments with artificial soils and plants growing free of competition.
EFFECTS OF ELEVATED CO2AND N ON WATER BALANCES OF FOREST 289 As canopies were closed in all treatments in the third growing season, the observed effects represent true responses at the level of ecosystems and not only averages of responses of isolated plants. Furthermore, we used natural soil material. Earlier investigations on CO2effects in open top chamber and greenhouse pot experiments have usually been performed with artificial soils, e.g. using a 1:1 mix of sand or gravel and vermiculite or variations including commercial potting soils (see review by Tyree and Alexander, 1993).
The magnitude of the observed treatment effects on water use and growth may not be considered as dramatic. Due to higher level feedback effects, it is expected and also has been found that growth and transpiration effects of elevated CO2are in general much smaller at the ecosystem than at the plant or leaf level (Körner
et al., 1997). Unexpected, however, was the key role which the soils played for
the responses of ecosystems on atmospheric CO2enrichment. If responses of the same type of vegetation on elevated CO2can be opposite for different types of soil, this may have important implications for climate change scenarios, in particular on a local scale. On the one hand, because the spatial variability of soils is usually dominated by short-range variation, we expect that ecosystem responses on CO2 tend to become less dependent on soil as the size of the domain increases. On the other hand, the distribution of soils is associated through pedogenetic processes with topographical patterns, and this may result in effects on regional scales which cannot be simply understood as areal averages of randomly distributed local effects. While speculations about such effects are premature without more data on a larger variety of soils and vegetations, we conclude that models of ecosystem effects of el-evated CO2and models employed for scaling up such effects to catchments, regions or even larger domains should take into account the role of soils as a determinant of vegetation responses.
Acknowledgements
This study was performed in the framework of COST Action 614. We gratefully acknowledge the help of U. Bühlmann, P. Bleuler, A. Kölliker and W. Landolt in setting up and running the experiments and Philipp Egli for help with the statistical analysis. We thank Jürg Bucher and Frank Hagedorn for providing outflow and soil chemistry data. Sincere thanks for constructive comments on the paper and editor-ial help go to Tim Green, CSIRO Land & Water Division Perth and Jürg Bucher. Funding was provided by the Swiss Federal Office of Education and Science and the Board of the Swiss Federal Institutes of Technology.
References Bazzaz, F. A. and Garbutt, K.: 1988, Ecology 69(4), 937.
290 M. A. SONNLEITNER ET AL.
Bazzaz, F. A.: 1990, Annu. Rev. Ecol. Syst. 21, 167.
Bloom, A. J., Chapin III, F. S. and Mooney, H. A.: 1985, Annual Review of Ecology and Systematics
16, 363.
Bremer, D. J., Ham, J. M. and Owensby, C. E.: 1996, J. Environ. Qual. 25, 691.
Churkina, G., Running, S. W., Schloss, A. L. and The Participants of the Potsdam NPP Model Intercomparison: 1999, Global Change Biology 5(Suppl. 1), 46.
Curtis, P. S. and Wang, X.: 1998, Oecologia 113, 299. Diemer, M. W.: 1994, Oecologia 98, 429.
Eamus, D.: 1991, Plant, Cell and Environment 14, 843. Eamus, D.: 1996, Commonwealth Forestry Review 75(1), 39.
Egli, P., Maurer, S., Günthardt-Goerg, M. S. and Körner, C.: 1998, New Phytol. 140, 185. Ellsworth, D. S., Oren, R., Huang, C., Phillips, N. and Hendrey, G. R.: 1995, Oecologia 104, 139. Field, C. B., Chapin, F. S., Matson, P. A. and Mooney, H. A.: 1992, Annu. Rev. Ecol. Syst. 23, 201. Field, C. B., Jackson, R. B. and Mooney, H. A.: 1995, Plant, Cell and Environment 18, 1214. Fife, D. N. and Nambiar, E. K. S.: 1995, Plant and Soil 168/169, 279.
Hatfield, J. L., Bauer, A., Kanemasu, E. T., Major, D. J., Blad, B. L., Reginato, R. J. and Hubbard, K. G.: 1988, Agricultural and Forest Meteorology 44, 187.
Hatton, T. J., Walker, J., Dawes, W. and Dunin, F. X.: 1992, Aust. J. Bot. 40, 679. Idso, K. E. and Idso, S .B.: 1994, Agricultural and Forest Meteorology 69, 153. Körner, Ch. and Arnone, J. A.: 1992, Science 257, 1672.
Körner, Ch.: 1995, Plant, Cell and Environment 18, 1101.
Landolt, W., Bucher, J. B., Schulin, R., Körner, C. and Brunold, C.: 1997, ‘Effects of Elevated CO2Concentration and N Deposition on Spruce-Beech Model Ecosystems,’ in Mohren, G. M.
J., Kramer, K. and Sabaté, S. (eds), Impacts of Global Change on Tree Physiology and Forest Ecosystems, Proceedings of the International Conference held at Wageningen, The Netherlands, 26–29 November, 1996, Kluwer Academic Publishers, 317.
Lankreijer, H. J. M.: 1998, The Water Balance of Forests Under Elevated Atmospheric CO2, Ph. D.
Thesis, Rijksuniversiteit Groningen, The Netherlands.
Marthaler, H. P., Vogelsanger, W., Richard, F. and Wierenga, P. J.: 1983, Soil Sci. Soc. Am. J. 47, 624. McGuire, A. D., Melillo, J. M. and Joyce, L. A.: 1995, Annu. Rev. Ecol. Syst. 26, 473.
Norby, R. J., O’Neill, E. G. and Luxmoore, R. J.: 1986, Plant Physiol. 82, 83. Overdieck, D. and Forstreuter, M.: 1994, Tree Physiology 14, 997.
Pritchard, S. G., Rogers, H. H., Prior, S. A. and Peterson, C. M.: 1999, Global Change Biology 5, 807. Rawson, H. M.: 1992, Aust. J. Bot. 40, 473.
Reich, P. B., Walters, M. B. and Tabone, T. J.: 1989, Tree Physiol. 5, 173.
Roth, K., Schulin, R., Flühler, H. and Attinger, W.: 1990, Water Resources Research 26(10), 2267. Runion, G. B., Mitchell, R. J., Green, T. H., Prior, S. A., Rogers, H. H. and Gjerstad, D. H.: 1999,
Journal of Environmental Quality 28, 880.
Saxe, H., Ellsworth, D. S. and Heath, J.: 1998, ‘Tree and forest functioning in an enriched CO2
atmosphere’, Tansley Review No. 98. New Phytol. 139, 395.
Sonnleitner, M., Attinger, W. and Schulin, R.: 1997, ‘Changes in Water Regime Due to Elevated at-mospheric CO2and N deposition.’ in Mohren, G. M. J., Kramer, K. and Sabaté, S. (eds.), Impacts
of Global Change on Tree Physiology and Forest Ecosystems, Proceedings of the International Conference held at Wageningen, The Netherlands, 26–29 November, 1996, Kluwer Academic Publishers, 325.
Stocker, R., Leadley, P. W. and Körner, Ch.: 1997, Functional Ecology 11, 222.
Tognetti, R., Longobucco, A., Miglietta, F. and Raschi, A.: 1999, Tree Physiology 19, 261. Tyree, M. T. and Alexander, J. D.: 1993, Vegetatio 104/105, 47.