HAL Id: halshs-00727611
https://halshs.archives-ouvertes.fr/halshs-00727611
Submitted on 3 Jan 2014
HAL is a multi-disciplinary open access archive for the deposit and dissemination of sci-entific research documents, whether they are pub-lished or not. The documents may come from teaching and research institutions in France or abroad, or from public or private research centers.
L’archive ouverte pluridisciplinaire HAL, est destinée au dépôt et à la diffusion de documents scientifiques de niveau recherche, publiés ou non, émanant des établissements d’enseignement et de recherche français ou étrangers, des laboratoires publics ou privés.
ICT Capital and Services Complementarities. The
Italian Evidence
Francesco Quatraro
To cite this version:
Francesco Quatraro. ICT Capital and Services Complementarities. The Italian Evidence. Applied Economics, Taylor & Francis (Routledge), 2011, 43 (20), pp.2603-2613. �halshs-00727611�
ICT capital and services complementarities. The Italian
evidence
Francesco Quatraroa,b,c*
a
BRICK, Collegio Carlo Alberto, Mocalieri, Italy
b
CNRS-GREDEG, University of Nice ‘Sophia Antipolis’, France
c
Department of Economics, University of Torino, Italy
ABSTRACT.
This paper investigates whether ICTs hardware and services play a complementary role in boosting economic growth. The main argument is that investments in ICTs fixed capital are a necessary but not sufficient condition leading to productivity gains, above all in late adopter countries. Their effective implementation indeed requires on the one hand a changing economic structure characterized by a growing weight of service sectors, on the other hand complementary investments in ICTs services, directed to ease the integration of the new technologies within firms’ boundaries. The analysis is conducted on a late-industrialized country like Italy, and shows that in lagging countries the weak impact of ICTs adoption is the result of three converging forces: relatively high share of manufacturing sectors, low adoption levels of ICTs in traditional manufacturing sectors, inadequate investments in ICTs services.
JEL CLASSIFICATION: O33
KEYWORDS: Information and Communication Technologies, Economic Growth, General Purpose Technologies, Complementarities.
* Corresponding address: Department of Economics, University of Turin, via Po 53, 10124 Torino. Tel.
1 Introduction
The analysis of the relationship between information and communication technologies (ICTs) and productivity growth gained momentum in the 1990s. A former body of empirical analyses provided evidence of positive and significant effects of investments in ICT capital on firm-level productivity growth (Siegel and Griliches, 1991; Lehr and Lichtenberg, 1999; Lichtenberg, 1995; Brynjolfsson and Hitt, 1995 and 2003).
At the aggregate level, pioneering studies focused on the US case in the second half of 1990s. Indeed, after the slowdown that concerned economists along the 1980s, the American economy began to experience a new phase of significant growth, which empirical analyses found to be correlated to the widespread diffusion of ICTs (Jorgenson, 2001; Jorgenson et al., 2006).
A growing stream of empirical analyses then followed, which dealt with the effects of ICTs on the economic growth in other OECD countries, also investigating the issue of productivity divergence from US levels (Timmer and van Ark, 2005; Aiginger and Falk, 2005; Daveri, 2002).
While the literature presents now a large number of cross-country comparisons of ICTs effects on productivity, there is not a comparable interest in country studies. Yet, country studies are useful in that they are able to shed light on the specific patterns of adoption of ICTs, and relate their effects to the features of the economic structure of individual countries.
The main argument of this paper is that sectoral complementarities are important factors affecting the impact of ICTs on productivity, above all in countries characterized by delayed patterns of adoption. While technological complementarities have been important in shaping the development of ICTs, their effective implementation is also likely to be influenced by two further set of complementarities, namely between structural change and ICT adoption, and between investments in ICT hardware and services. In the former, the economic structure ought to be dominated by knowledge-intensive sectors, above all services (Griliches, 1994). In the latter, as general purpose technologies, the full deployment of ICTs potentials calls for complementary investments in supporting services (Aghion and Howitt, 1998).
This paper presents a cross-industry analysis of the effects of ICTs use on productivity growth in Italy, over the period 1995-2003, using input-output tables. The case of Italy is particularly interesting in this respect, as it allows for investigating whether ICT capital and ICT services have significant effects on economic growth in a country that is managing a delayed transition towards the service-based economy, and whether they work as complement or substitute factors1 (Quatraro, 2009).
The rest of the paper is organized as follows. In Section 2 we briefly outline the conceptual framework which sets out the issue of complementarities between ICT capital and services. Section 3 discusses the methodology and Section 4 presents the data used in the paper, providing some descriptive analyses. Section 5 shows the results
1 Already in the 1970s Italy was described as a late-industrialized country, i.e. one which has lagged
behind other earlier industrialized European countries, like the UK or Germany, with respect to the industrialization process (Fuà, 1980).
of the econometric exercise. In Section 6 we discuss the results and draw the conclusions.
2 The Conceptual Framework
ICTs display all the characteristics of a general purpose technology (GPT), i.e. a handful of technologies characterized by the potential for pervasive use in a wide range of sectors, fostering further technological change and thereby bringing about pervasive and persistent productivity gains (Bresnahan and Trajtenberg, 1995). As an exemplar of GPT, they are characterized by a bundle of systemic interrelationships, which relate both to technological and non-technological domains.
Technological complementarities refer to the set of interrelated technologies shaping the technical features of a GPT. Once a technology having GPT potentials is introduced, agents in the user sectors commit R&D efforts to adapt it to the idiosyncratic conditions of their organizations. This favours the emergence of mutual relationships between the user and the GPT sector, such that innovations in the former boost productivity gains the latter, and vice versa. Moreover, the creation of compatible technologies able to expand the range of uses of the potential GPTs makes it possible to enlarge the set of potential users, and hence increase the probability of positive feedbacks. Developments in one sector are likely to foster developments in the other one, creating a virtuous circle, provided some coordination mechanisms are at stake (Lipsey et al., 2005; Bresnahan and Trajtenberg, 1995).
Skills complementarity matters as long as the introduction of GPTs within firms’ boundaries induces changes both in the organizations and in the demand for different skills profiles. In the case of ICT, the skills-bias can be viewed as the outcome of endogenous innovation efforts aimed at exploiting the increasing supply of high-level educated workforce (Antonelli and Quatraro, 2009). White-collars are required to command a new situation in which tasks are organized, routinized and regularized. (Griliches, 1969; Acemoglu, 1998; Brynjolfsson et al., 2002).
The capital-services complementarities refer to the fact that the procurement of supporting services, helping to deploy the potentials of the technologies, is a key strategic factor above all in the early stages of diffusion (Aghion and Howitt, 1998; Helpman and Trajtenberg, 1998). When new technologies are adopted, the setting up of the hardware is not enough to trigger productivity. Firms would for example need to implement and manage information systems able to identify changes in demand and supply, allowing for prompt responses. This would require investments in software consultancy services once investments in ICT capital have been undertaken.
It must be however noted that the relevance of service sectors is germane not only to the expenditure for ICT-related services from ICT-using firms. In fact, while ICTs consist of a complex system of technologies that is the result of a technological revolution (Perez, 2002), the manifestation of their economic impact is conditional on the completion of the structural change process in which the share of service sectors grows while that of manufacturing ones slows down2. Empirical analyses have indeed showed
2 The former analyses of structural change date back to the 1930s, when scholars like Arthur Burns and
that the bulk of ICTs expenditure is mostly borne by business services firms and that this was the main reason why the lack of adequate data made it difficult to appreciate their effects on productivity (Griliches, 1994; Triplett, 1999).
Such dynamic interpretation still provides a useful framework to understand cross-country differences in the (post) industrialization process. These in turn may help to explain cross-country differences both in the adoption of ICTs and in their contribution to economic growth. Countries that are late in the transition towards a service-based economy are indeed not likely to effectively combine investments in ICT capital and services, which should be key to their full exploitation.
3 Methodology
In order to estimate the contribution of ICT investments to productivity growth, we firstly calculated a multi-factor productivity index (MFP), following a growth accounting approach (Solow, 1957; Jorgenson, 1995; OECD, 2001). The output of each industry, Y, is produced from aggregate factor inputs, consisting of capital services (K) and labour services, which are proxied here with total hours worked (HW). MFP (A) is defined as the Hicks-neutral augmentation of the aggregate inputs. Such a production function has the following shape:
) , (K HW f A Y (1)
The general Cobb-Douglas takes the following formulation:
t i t i t i A K HW Y, , , (2) US and other developed countries (Kuznets, 1930; Burns, 1934). According to Kuznets’ retardation theory, the growth process is not evenly distributed across different industries. Rapidly developing industries are not intended to grow indefinitely. Industry growth rates are instead expected to decline over time, and then those industries whose period of development comes later, are likely to overtake the mature ones. Such differential growth rates across industries are hence likely to create structural change.
Under the assumption of perfect competition and constant returns to scale, MFP is calculated according to the following steps. Let us take firstly the log of equation (2):
t i t i t i t i t i t i A K HW Y, ln , , ln , , ln , ln (3)
Now we can rearrange the terms of equation (3) in order to derive the logarithm of MFP: t i t i t i t i t i t i Y K HW A, ln , , ln , , ln , ln (4)
It must be stressed that in this paper output elasticities are not estimated, but are calculated using accounting data. In particular, under the assumption of constant returns to scale and perfect competition, we can write the following:
t i t i t i t i, (w,L,)/Y, (5) t i t i, 1 , (6)
Where w is the wage rate of industry i at time t. Thus we obtain elasticities that vary both over time and across sectors.
Following Jorgenson et al. (2006), to reduce the possible biases in the computation of MFP, we also accounted for the changes in labour quality3, calculated as the ratio
between labour input and hours worked. Equation (4) can be hence rewritten as: ) / ( ln ln ln lnAi,t Yi,ti,t Ki,ti,t HWi,t Li,t HWi,t (7) Where L stands for the level of employment and i refers to the sectors.
The measurement issues of the effects of ICT capital on productivity growth may be addressed in different ways. Some authors distinguished among producing,
3 The issue of labour quality is strictly related to the differentials in human capital profiles across sectors.
It would be useful to control for these factors, but unfortunately the available data do not allow us to decompose labour force for the period under screening.
intensively-using and other industries, calculating the relative contribution of each industry to the growth of MFP (Stiroh, 2002; Timmer and van Ark, 2005). Other authors instead provided econometric estimations of the contribution of ICTs to productivity growth (Schreyer, 2002; Daveri, 2003). In this study we will follow the second approach, by adding the ICT capital and services as inputs in the production function. Equation (2) takes hence the following form:
t i t i t i t i t i A K HW ICTK ICTS Y, , , , , (8)
Where ICTK is a vector of ICT-related fixed capital and ICTS is a vector of ICT-related services. Taking logs and rearranging the terms, the impact of ICT-related capital and services on productivity can be estimated drawing upon the relation:
t i t i t i ICTK ICTS A, ln , ln , ln (9)
In view of the methodological framework developed so far, the paper aims at investigating whether ICTs capital and services are complementary or not. The cross-industry analysis of the Italian case is carried out against the background outlined by the features of its economic structure.
4 The Data
The data used in the empirical analysis come from three sources. Data about value added, total hours worked and employment are taken from the Groningen Growth and Development Centre 60 industry database, while the data about total labour income and the capital stock are drawn from the National Institute of Statistics (ISTAT). These variables are needed to calculate the MFP index. The data about the use of ICTs are instead drawn from the Eurostat Input-Output database. In particular, this paper distinguishes between ICT capital and services. Within the former group, we consider
the ISIC sectors 30 (computer equipment), 31 (electronic equipment) and 32 (telecommunication equipment), while in the latter group we consider the ISIC sectors 64 (telecommunication services) and 72 (informatics services). An exploratory descriptive analysis may help to define the features of the empirical framework.
Table 1 shows the shares of value added for the 24 sectors we consider in our analysis4.
The agriculture sector is characterized by negative growth rates in all the sub-periods, although it may be noted that the decline was more marked in the 1980s than in the 1990s. The fishing industry shows positive performances in the first half of the 1980s, then it starts declining at a rate of 4% per year in the rest of the decade, while in the 1990s its share declines at a rate of 3% per year.
The shares of all manufacturing sectors on total added value are featured by the slackening of growth rates in the observed time span. Some scattered exceptions can be found, like the mining and quarrying sector (+1,6% in the late 1990s), the food producing sector (+2,0% in the early 2000s) and manufacturing of transport equipment (+1,6% in the late 1990s). Within this picture, growth rates are unevenly distributed across industries and time. Some sectors are indeed characterized by a particularly marked reduction. The most worrying evidence in the early 2000s can be found in the textile and clothing (-4%); the leather and footwear (-3,5%) and the electrical and optical equipment (-4,5%) sectors. The first two sectors entail the firms operating in the so-called Made in Italy productions, which have long been regarded as the main source
4
Unfortunately, the limited availability of data about the capital stock, forced us to aggregate some sectors in order to compute the multifactor productivity
of Italian comparative advantage, while the last sector entails the production of computers and telecommunication equipment. It would seem that the most important sectors for the Italian economy have been characterized in the recent years by a sensible loss of weight.
>>> INSERT TABLE 1 ABOUT HERE <<<
Service sectors are instead characterized by a generalized growth process, although some exceptions can be found also in this case. The wholesale and retail service sectors appears to decline in the second half of the 1990s and the early 2000s, while the share of financial intermediation and of transport, storage and communication service sectors decrease in the late 2000s. The growth of business sectors in Italy along the 1980s and the 1990s seems to have been driven by the real estate, renting and business activities, which grow at an average rate of 4,4% in the first half of the 1980s, and then stabilizes around 2,3% in the rest of the period observed.
The evidence provided so far suggests that the Italian economy is relatively late in the movement towards the service based economy. The share of service sectors has been growing to detriment of manufacturing sectors, but it is not yet at adequate levels.
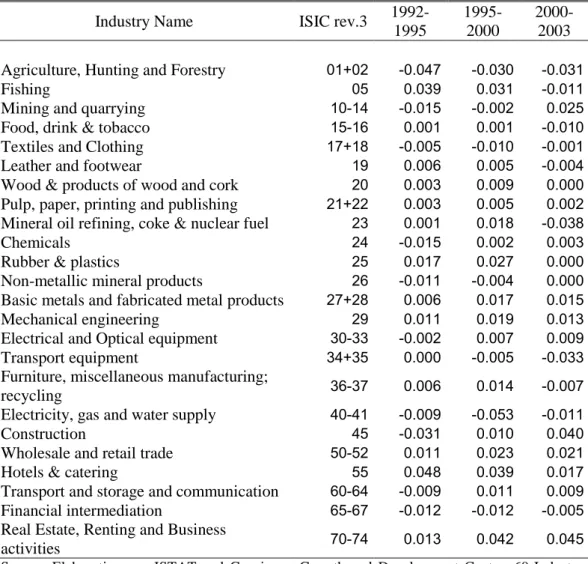
Let us turn how to investigate the growth rates of MFP in the different sectors. Due to the limited time span of ISTAT series, we can show the changes over a narrower period. The data in Table 2 show a very interesting situation. Within the manufacturing sectors, textile and clothing branches are characterize by persistently negative growth rates. The
productivity figures thus confirm that one of the most important activities for the Italian economy has been loosing importance over the last decades. Leather and footwear show modest positive growth rates along the 1990s, and then begins to decline in the early 2000s 0,1%). The same situation occurs also in other sectors like food production (-1,0%), oil refining (-3,8%) and the furniture industry (-0,7%). On the contrary sectors like chemicals and electrical and optical equipment are characterized by negative growth rates in the first half of the 1990s, and then start growing in the following years. It would seem that within the general reduction of share of manufacturing sectors, knowledge-intensive sectors are characterized by productivity gains, while the competitiveness of traditional sectors, like leather and apparel, is seriously threatened.
>>> INSERT TABLE 2 ABOUT HERE <<<
Out of the service sectors, only the financial intermediation and insurance activities show persistent negative, although increasing, growth rates. All other service industries are characterized by positive growth rates. A distinction however ought to be made between sectors whose MFP growth is decelerating, and sectors whose MFP growth is accelerating. Within the first group there are the hotel and catering activities, which change from 4,8% in the first half of 1990s over 1,7% in the early 2000s. In the latter group one can find the wholesale and retail trade sectors, wherein MFP grows at an average rate of 1,1% in the first half of the 1990s, then it arrives at 2,3% in the following years. The most striking accelerations germane to the real estate, renting and business activities, where MFP growth rate goes from 1,3% in the early 1990s to 4,5% in the early 2000s. Also in the case of service sectors it would seem that there has been
occurring a kind of reallocation of productivity gains. While traditional service sectors like those related to tourism, are characterized by declining performances, service sectors related to knowledge-intensive activities are becoming more and more important5.
The Italian industrial structure has thus been changing since the first half of the 1990s, preserving its delay with respect to other advanced countries. In light of the empirical background depicted so far, it is interesting to look at the evidence about the cross-industry differences in the use of ICTs.
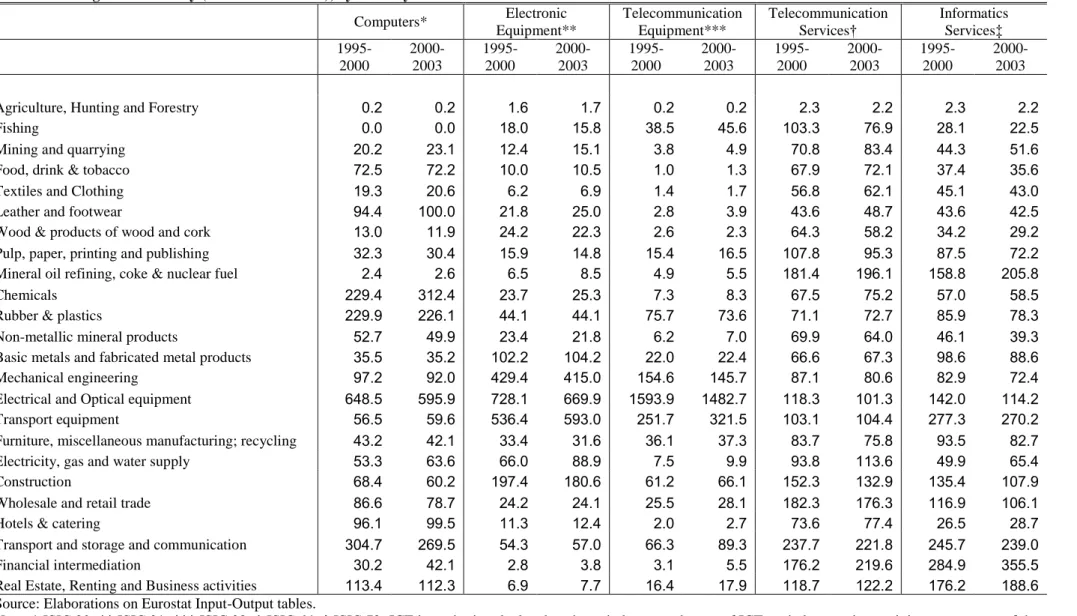
Table 3 reports the average ICT intensity for each industry in two periods. The industrial average use is expressed as percentage of total average use, so that industries showing values above (below) 100 are characterized by a high (low) ICT intensity. Traditional manufacturing sectors are on the whole featured by quite low intensity of use of ICT capital, although considerable use of telecommunication and informatics service sectors can be found in the refining industry. Knowledge-intensive manufacturing sectors like the production of electronic components, the rubber and the chemicals, are instead characterized by a systematically high intensity of ICT capital, while the procurement of informatics and telecommunication services is at markedly lower levels.
>>> INSERT TABLE 3 ABOUT HERE <<<
5
The evidence for real estate services ought to be taken cautiously, as part of the positive dynamics an be explained by financial speculations which pushed upward the price levels in the sectors. Although all variables have been deflated using industry-specific deflators, still this process may have caused an upward bias in our calculations.
Within the service sectors, the real estate activities and the transport and communication are characterized by use of ICT capital and services that are above the average, although the advantage is not very marked. It also worth noting that sectors characterized by negative growth rate of total factor productivity also show a high intensity of ICT services and a low intensity of ICT capital (like in the case of financial intermediation services or the manufacturing of transport equipment).
In conclusion, the Italian economic structure appears to be still dominated by relatively high share of manufacturing activities, although decreasing over time. ICTs are scarcely diffused within traditional manufacturing sectors, while across knowledge-intensive manufacturing sectors one can observe relatively high adoption levels of ICT capital but low use level of ICT services. This would suggest that the comparatively lower effects of ICT on productivity growth widely observed in Italy may be due to the convergence of three factors: a) high share of manufacturing sectors, while ICTs are mostly used in service sectors; b) low adoption levels of ICTs in traditional manufacturing sectors; c) investments in ICT capital are not supported by investments in ICT services.
5 The Econometric Results
In order to estimate the effects of ICTs on productivity growth we have to specify the structural form of Equation (9), making explicit the ICT sectors we are focusing on:
z ISIC e ISIC d ISIC c ISIC b ISIC a k A t i t i t i t i t i t i , , , , , , 72 ln 64 ln 32 ln 31 ln 30 ln ln (10)
This structural form directly comes from a Cobb-Douglas production in which the ICT industries are considered as complementary production factors. In order to investigate
whether or not ICT capital and services are complementary, we confront this estimation with the alternative hypothesis that they are substitutes. In this framework, production factors are considered substitutes if they are characterized by an additive rather than multiplicative relationship (Griliches, 1979). Let us then specify the alternative structural form as follows:
v ISIC n ISIC ISIC m ISIC ISIC h g A t i t i t i t i t i t i , , , , , , 31 ln ) 64 32 ln( ) 72 30 ln( ln (11)
According to this equation, we hypothesize that computer equipment is related to informatics services, while telecommunication equipment is related to telecommunication services.
Equations (10) and (11) present problems arising due to the twofold direction of causality, omission of relevant variables and embodied technological change. Moreover, the limited time coverage of Eurostat Input-Output tables does not allow us to derive stocks without loosing too many degrees of freedom. In order to cope with these issues, we adopt the following econometric strategy. For the sake of brevity, we will show the passages only for Equation (10). First of all, let us take first differences so as to consider growth rates of the variables:
1 1 , , 1 , , 1 , , 1 , , 1 , , 1 , , ) 72 ln 72 (ln ) 64 ln 64 (ln ) 32 ln 32 (ln ) 31 ln 31 (ln ) 30 ln 30 (ln ln ln t t t i t i t i t i t i t i t i t i t i t i t i t i z z ISIC ISIC e ISIC ISIC d ISIC ISIC c ISIC ISIC b ISIC ISIC a k A A (12)
This equation can be further elaborated by considering that:
Y ISIC dISIC dY a 30 30 Y ISIC dISIC dY ISIC ISIC Y ISIC dISIC dY dt ISIC d a 30 30 30 30 30 30 ) / 30 log (
The variation in the stock of computers can be proxied by the investment flows in computers, and this can be extended to all other regressors. Let us define the investment flow in each product and service using the prefix INV followed by the ISIC code, i.e.
INV30, INV31, INV32, INV64 and INV72. We can rewrite the econometric specification
as follows: Y INV Y INV Y INV Y INV Y INV A k A Ait t t 72 64 32 31 30 ln ln ln 5 4 3 2 1 1 1 , (13)
Where the lagged level of MFP is meant to capture possible mean reversion effects. A convenient way to estimate equation (13) is the following:
Y INV Y INV Y INV Y INV Y INV A k Ait t 72 64 32 31 30 ln ln 5 4 3 2 1 1 , (14)
Where 1.In the same vein, the econometric specification of equation (11) takes the form: Y INV INV Y INV Y INV INV A k Ait t 64 32 31 72 30 ln ln 3 2 1 1 , (14)
Equations (14) and (15) can be estimated through dynamic models for panel data. We carried out the empirical test by means of a dynamic panel data regression, using the generalized method of moments (GMM) estimator (Arellano and Bond, 1991). This estimator indeed provides a convenient framework for obtaining asymptotically efficient estimators in presence of arbitrary heteroskedasticity, taking into account the structure of residuals to generate consistent estimates. In particular, we use the
GMM-System (GMM-SYS) estimator in order to increase efficiency (Arellano and Bover, 1995; Blundell and Bond, 1998). This approach instruments the variables in levels with lagged first-differenced terms, obtaining a dramatic improvement in the relative performance of the system estimator as compared to the usual first-difference GMM estimator. The error term is therefore decomposed in ρi and Σψt, which are respectively industry and time effects, and the error component εit. Moreover, in order to rule out as much as possible the risk of spurious relationships, all ICT-related regressors have been lagged one year. This leads to the following specification:
t i i t t t t t t t i t Y INV Y INV Y INV Y INV Y INV A k A , 1 5 1 4 1 3 1 2 1 1 1 , 72 64 32 31 30 ln ln
(15) t i i t t t t t i t Y INV INV Y INV Y INV INV A k A , 1 3 1 2 1 1 1 , 64 32 31 72 30 ln ln
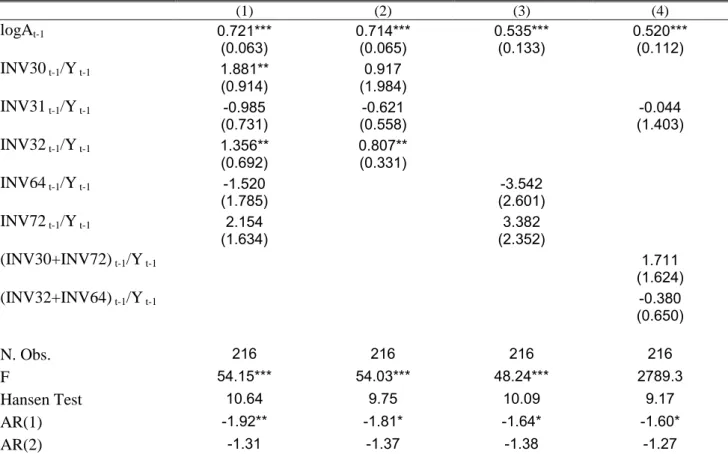
(16)In the first column of Table 4 we report the estimation results of Equation (15). The coefficient of the lagged dependent variable may be interpreted in the light of convergence theory. As the coefficient is significant and below one, we may say that there is productivity convergence across Italian industries, and that the implied rate of convergence is about 0.04% per year. Let us turn now to the effects of ICT variables, where the coefficient may be interpreted now as the social gross excess rate of return to expenditure in ICTs (Griliches and Lichtenberg, 1984). The emerging picture is quite interesting. First of all, it must be noted that ICT services do not exert any significant effect on the growth of MFP, while the reverse applies in the case of ICT hardware. The
coefficients are positive and significant for the intensity of computer use (INV30) and the intensity of use of telecommunication equipment (INV32), whereas the use of electronic equipment (INV31) does not affect productivity growth. It is also worth stressing that the social gross excess return from computers (1.881) is larger than that from telecommunication equipment (1.356).
>>> INSERT TABLE 4 ABOUT HERE <<<
In column 2 and 3 of Table 4 Equation (15) has been estimated by separating out first ICT services and then ICT hardware. In the first case, when only ICT hardware is considered, the lagged MFP is characterized by a coefficient very similar to the previous one. It is positive and significant, and it implies a rate of convergence of about 0.04% per year. For the ICT variables, one may note that the coefficient for the intensity of computer use is not significant in this case, while that on the telecommunication equipment preserves its significance, although now the social gross excess rate of return is far lower (0.807) than in the previous case. The results for the estimation conducted by considering only ICT service are basically consistent with those discussed so far. The coefficient on the lagged MFP is still positive and significant, although much lower than in the previous cases, implying a rate of convergence of about 0.07% per year, while the coefficient on ICT services are not significant at all.
In the last column of Table 4 there are the results obtained by considering ICT hardware and services as substitutes rather than complementary. It may be useful to recall that computer equipment (INV30) is considered as substitute for informatics services
(INV72), while telecommunication equipment (INV32) is considered as substitute for telecommunication services (INV64). The only significant variable in this estimation is the lagged MFP, whose magnitude implies a rate of convergence of about 0.07 per year.
The empirical analysis hence seems to provide two important results. First of all, ICT services and hardware are to be regarded as complementary rather than substitutes when assessing their impact on growth processes. Second, in contexts like the Italian economy, the relatively scarce impact of ICTs on economic growth is due not only to the relative weakness of demanding sectors (i.e. the knowledge intensive sectors), but also to the inappropriate development of supporting service activities.
6 Discussion and Conclusions
The results of the analysis conducted so far are important under many respects. The diffusion of ICTs in the Italian economy appears to be still lagging, especially with respect to the US and the UK. The weight of service sectors is not yet large enough, although the share of manufacturing sectors is gradually reducing. These two aspects are complementary: neither ICTs capital nor services are properly diffused across the traditional manufacturing sectors, while knowledge-intensive sectors are characterized by a marked adoption of ICT capital, but very low levels of services procurement. The econometric results accordingly show that capital and services are complementary rather than substitutes.
The complementarity between ICT capital and services, makes the latter as indispensable in order to feed ICT-driven economic growth. Firms operating in
traditional manufacturing sectors are indeed unlikely to command the set of capabilities that are necessary to make the hardware apparatus work effectively.
The existence of an adequate mix of service procurement and hardware investments is therefore a necessary, although not sufficient, for ICTs to display their enhancing effects on productivity. The implications of this analysis are thus very clear, above all for what concerns the mechanisms of knowledge governance and their effects on productivity. Knowledge governance indeed refers to the way organizations can generate new knowledge in the fields they have accumulated sufficient levels of competence (Krafft and Ravix, 2008).
The knowledge produced is in turn a key factor feeding the production and adoption of
innovations, which boost firms’ productivity. The effective integration of different
knowledge sources is likely to be fostered by the use of ICTs, which allows for a higher degree of connectivity of the firm. Moreover, firms are likely to cumulate over time a repertoire of capabilities which defines the memory of the organization, which needs to be stored, reproduced and diffused within the organization. The opportunity to embed organizational knowledge in software, combined with efficient long-distance transfer of a variety of knowledge, makes ICTs adoption lower the marginal cost of storing and transferring knowledge (Foray and Steinmuller, 2003; D’Adderio, 2003).
While there is general agreement on the fact that the effectiveness of knowledge governance is radically affected by the adoption of ICTs, this paper has showed that ICTs exert their impact provided these are effectively implemented and used within the
organization. This issue is particularly relevant in contexts characterized by a sound process of structural change. Firms operating in those sectors that are loosing economic relevance need to react to the changing conditions by developing a competitive advantage based on technological innovation. The ability to create new knowledge eventually translated into innovations is dramatically enhanced by the adoption of ICTs.
However, it must be considered that firms which have not ICT related competences can hardly gain productivity gains only by investing in digital technologies. They also need to commit appropriate levels of investments in informatics and telecommunication services, either through the creation of internal divisions or through the outsourcing. The combination of ICT capital and services is then likely to produce the desired boost on productivity, driven by a better management of organizational knowledge and the improvement of knowledge governance.
Acknowledgments
Part of the background research for this paper has been done during my staying at CRIC
– University of Manchester. I wish to thank Cristiano Antonelli, Alessandra Colombelli,
Pier Paolo Patrucco and Ed Steinmuller for their useful comments. I acknowledge the financial support of the Collegio Carlo Alberto as well as of the Agence Nationale de la
Recherche (contract number: ANR JCJC06_141306, “Knowledge Intensive Sectors: Models and Evidence”) and the Provence Alpes Côte d’Azur Region. The usual caveats
References
Acemoglu, D. (1998) why do new technologies complement skills? Directed technological change and wage inequality, Quarterly Journal of Economics, 113, 1055-1089.
Aghion, P. and Howitt, P. (1998) On the macroeconomic effects of major technological change, Annales d’Economie et de Statistique, 49/50, 54-75.
Aiginger K. and Falk M. (2005) Explaining differences in economic growth among OECD countries, Empirica, 32, 19-43.
Antonelli, C. and Quatraro, F. (2009), The effects of biased technological change on total factor productivity: Empirical evidence from a sample of OECD countries, Journal of Technology Transfer, first published 31 July 2009, doi: 10.1007/s10961-009-9134-2.
Arellano, M. and Bond, S.R. (1991) Some tests of specification for panel data: Monte Carlo evidence and an application to employment equations, Review of
Economic Studies, 58, 277-297.
Arellano, M. and Bover, O. (1995) Another look and the instrumental-variable estimation of error-components models, Journal of Econometrics, 68, 29-52.
Blundell R.W and Bond S.R. (1998) Initial conditions and moment restrictions in dynamic panel data models, Journal of Econometrics, 87, 115-143.
Bresnahan T.F and Trajtenberg M. (1995) General purpose technologies
Bresnahan T.F, Brynjolfsson, E., and Hitt, L.M. (2002) Information technology, workplace organization and the demand for skilled labor: Firm-level evidence,
Quarterly Journal of Economics, 117, 329-376.
Brynjolfsson, E., and Hitt, L.M. (1995) Information technology as a factor of production: The role of differences among firms, Economics of Innovation and New
Technology, 3, 183–200.
Brynjolfsson, E. and Hitt, L. M. (2003) Computing pruductivity: Firm-level evidence, Review of Economics and Statistics, 85, 793-808.
Burns, A. F. (1934) Production trends in the United States since 1870, Boston, NBER.
D’Adderio, L. (2003) Configuring software, reconfiguring memories: The
influence of integrated systems on the reproduction of knowledge and routines,
Industrial and Corporate Change, 12, 231-350.
Daveri, F. (2002) The new economy in Europe, 1992 – 2001, Oxford Review of
Economic Policy 18, 345-362.
Daveri, F. (2003) Information technology and productivity growth across countries and sectors. In: Jones, D. (Ed.), New economy handbook, San Diego and London, Elsevier/Academic Press.
Foray, D and Steinmuller, E.W. (2003) The economics of knowledge reproduction by inscription, Industrial and Corporate Change, 12, 299-319.
Fuà, G. (1980) Problemi dello sviluppo tardivo in Europa: Rapporto su sei paesi
appartenenti all’OCSE (Problems of lagged development in OECD Europe: A study of
Griliches, Z. (1969) Capital-skill complementarity, Review of Economics and
Statistics, 51, 465-468.
Griliches, Z. (1979) Issues in assessing the contribution of research and development to productivity growth, Bell Journal of Economics,10, 92-116
Griliches Z. (1994) Productivity, R&D and data constraint, American Economic
Review, 84, 1-23.
Griliches, Z. and Lichtenberg, F. (1984) R&D and productivity growth at the industry level: Is There Still a Relationship?, in Griliches, Z. (ed.), R&D, Patents and
productivity, Chicago and London, The University of Chicago Press.
Helpman, E. and Trajtenberg, M. (1998) A time to sow and a time to reap: Growth based on general purpose technologies, in Helpman, E. (ed.) General Purpose
Technologies and Economic Growth, Cambridge, MA, MIT Press.
Jorgenson, D.W. (1995) Productivity Volume 1: Post-war US Economic Growth, Cambridge, MA, MIT Press.
Jorgenson, D.W. (2001) Information iechnology and the US economy, American
Economic Review, 91, 1–32
Jorgenson, D.W., Ho M.S., e Stiroh K.J (2006) Potential growth of the us economy: Will the productivity resurgence continue?, Business Economics, 41, 7-16.
Krafft, J. and Ravix, J.L. (2008), Corporate governance and the governance of knowledge : Rethinking the relationship in terms of corporate coherence, Economics of
Innovation and New Technology, 17, 79-95.
Kuznets, S. (1930), Secular movements in production and prices, Boston, Houghton Mifflin.
Lehr, B. and Lichtenberg, F. R. (1999), Information technology and its impact on productivity: Firm-level evidence from government and private data sources, 1977-1993, The Canadian Journal of Economics, 32, 335-362
Lichtenberg, F. R. (1995) The output contributions of computer equipment and personnel: A firm-level analysis, Economics of Innovation and New Technology, 3, 201-217.
Lypsey, R.G., Carlaw, K.I and Bekar, C.T. (2005) Economic transformations.
General purpose technologies and long term economic growth, New York: Oxford
University Press.
OECD, 2001, Measuring productivity. Measurement of aggregate and
industry-level productivity growth, OECD, Paris.
Perez C. (2002) Technological revolution and financial capital, Cheltenam, Elgar.
Quatraro, F. (2009), Innovation, structural change and productivity growth: evidence from Italian regions, 1980–2003, Cambridge Journal of Economics, 33, 1001-1022.
Schreyer, P. (2002) Computer price indices and international growth and productivity comparisons, Review of Income and Wealth, 48, 15–31.
Siegel, D. and Griliches, Z. (1991) Purchased services, outsourcing, computers, and productivity in manufacturing, NBER Working Paper n° 3678.
Solow R. M. (1957) Technical change and the aggregate production function,
Timmer, M. P. e van Ark, B. (2005) Does information and communication technology drive EU-US productivity growth differentials?, Oxford Economic Papers, 57, 693-716.
Stiroh, J.J. (2002) Information technology and the U.S. productivity revival: What do the industry data say?, American Economic Review, 92, 1559-1576
Triplett, J.E (1999) The Solow productivity paradox: What do computers do to productivity?, Canadian Journal of Economics, 32, 309-334.
Table 1 - Annual Average Growth Rates of Value Added Share, by Industry.
Industry Name ISIC rev.3 1980-1985 1985-1990 1990-1995 1995-2000 2000-2003
Agriculture, Hunting and Forestry 01+02 -0.045 -0.050 -0.009 -0.027 -0.022
Fishing 05 0.064 -0.041 -0.032 -0.031 0.025
Mining and quarrying 10-14 -0.012 -0.038 -0.013 0.016 -0.050
Food, drink & tobacco 15-16 -0.007 -0.010 -0.014 -0.013 0.020
Textiles and Clothing 17+18 -0.016 -0.025 -0.016 -0.024 -0.040
Leather and footwear 19 -0.012 -0.034 -0.022 -0.034 -0.035
Wood & products of wood and cork 20 -0.031 -0.010 -0.008 -0.005 -0.013
Pulp, paper, printing and publishing 21+22 -0.014 0.008 -0.006 -0.014 0.012
Mineral oil refining, coke & nuclear fuel 23 0.031 -0.103 0.108 -0.159 0.001
Chemicals 24 -0.006 -0.011 -0.005 -0.010 -0.029
Rubber & plastics 25 -0.033 -0.005 0.013 -0.018 -0.024
Non-metallic mineral products 26 -0.053 0.013 -0.026 0.006 -0.001
Basic metals and fabricated metal products 27+28 -0.037 -0.009 -0.003 -0.029 -0.015
Mechanical engineering 29 -0.027 -0.018 -0.013 -0.003 -0.026
Electrical and Optical equipment 30-33 -0.017 -0.015 -0.026 -0.006 -0.045
Transport equipment 34+35 -0.035 -0.014 -0.043 0.016 -0.038
Furniture, miscellaneous manufacturing;
recycling 36-37 -0.046 -0.019 -0.009 -0.011 -0.018 Electricity, gas and water supply 40-41 0.071 0.019 0.012 -0.010 0.014
Construction 45 -0.017 -0.010 -0.031 -0.011 0.013
Wholesale and retail trade 50-52 0.005 -0.005 0.000 -0.010 -0.007
Hotels & catering 55 0.012 0.001 0.008 0.008 0.008
Transport and storage and communication 60-64 0.003 -0.003 0.007 0.000 -0.006
Financial intermediation 65-67 -0.002 0.010 -0.009 0.002 -0.013
Real Estate, Renting and Business
activities 70-74 0.044 0.024 0.025 0.023 0.020
Source: Elaborations on Groningen Growth and Development Centre, 60-Industry Database, October 2005, http://www.ggdc.net.
Table 2 - Annual Average Growth Rates of MFP, by Industry.
Industry Name ISIC rev.3 1992-1995 1995-2000 2000-2003
Agriculture, Hunting and Forestry 01+02 -0.047 -0.030 -0.031
Fishing 05 0.039 0.031 -0.011
Mining and quarrying 10-14 -0.015 -0.002 0.025
Food, drink & tobacco 15-16 0.001 0.001 -0.010
Textiles and Clothing 17+18 -0.005 -0.010 -0.001
Leather and footwear 19 0.006 0.005 -0.004
Wood & products of wood and cork 20 0.003 0.009 0.000
Pulp, paper, printing and publishing 21+22 0.003 0.005 0.002
Mineral oil refining, coke & nuclear fuel 23 0.001 0.018 -0.038
Chemicals 24 -0.015 0.002 0.003
Rubber & plastics 25 0.017 0.027 0.000
Non-metallic mineral products 26 -0.011 -0.004 0.000
Basic metals and fabricated metal products 27+28 0.006 0.017 0.015
Mechanical engineering 29 0.011 0.019 0.013
Electrical and Optical equipment 30-33 -0.002 0.007 0.009
Transport equipment 34+35 0.000 -0.005 -0.033
Furniture, miscellaneous manufacturing;
recycling 36-37 0.006 0.014 -0.007 Electricity, gas and water supply 40-41 -0.009 -0.053 -0.011
Construction 45 -0.031 0.010 0.040
Wholesale and retail trade 50-52 0.011 0.023 0.021
Hotels & catering 55 0.048 0.039 0.017
Transport and storage and communication 60-64 -0.009 0.011 0.009
Financial intermediation 65-67 -0.012 -0.012 -0.005
Real Estate, Renting and Business
activities 70-74 0.013 0.042 0.045
Source: Elaborations on ISTAT and Groningen Growth and Development Centre, 60-Industry Database, October 2005, http://www.ggdc.net.
Table 3 –Average ICT Intensity (Grand Total = 100), by industry. Computers* Electronic Equipment** Telecommunication Equipment*** Telecommunication Services† Informatics Services‡ 1995-2000 2000-2003 1995-2000 2000-2003 1995-2000 2000-2003 1995-2000 2000-2003 1995-2000 2000-2003
Agriculture, Hunting and Forestry 0.2 0.2 1.6 1.7 0.2 0.2 2.3 2.2 2.3 2.2
Fishing 0.0 0.0 18.0 15.8 38.5 45.6 103.3 76.9 28.1 22.5
Mining and quarrying 20.2 23.1 12.4 15.1 3.8 4.9 70.8 83.4 44.3 51.6
Food, drink & tobacco 72.5 72.2 10.0 10.5 1.0 1.3 67.9 72.1 37.4 35.6
Textiles and Clothing 19.3 20.6 6.2 6.9 1.4 1.7 56.8 62.1 45.1 43.0
Leather and footwear 94.4 100.0 21.8 25.0 2.8 3.9 43.6 48.7 43.6 42.5
Wood & products of wood and cork 13.0 11.9 24.2 22.3 2.6 2.3 64.3 58.2 34.2 29.2 Pulp, paper, printing and publishing 32.3 30.4 15.9 14.8 15.4 16.5 107.8 95.3 87.5 72.2 Mineral oil refining, coke & nuclear fuel 2.4 2.6 6.5 8.5 4.9 5.5 181.4 196.1 158.8 205.8
Chemicals 229.4 312.4 23.7 25.3 7.3 8.3 67.5 75.2 57.0 58.5
Rubber & plastics 229.9 226.1 44.1 44.1 75.7 73.6 71.1 72.7 85.9 78.3
Non-metallic mineral products 52.7 49.9 23.4 21.8 6.2 7.0 69.9 64.0 46.1 39.3
Basic metals and fabricated metal products 35.5 35.2 102.2 104.2 22.0 22.4 66.6 67.3 98.6 88.6
Mechanical engineering 97.2 92.0 429.4 415.0 154.6 145.7 87.1 80.6 82.9 72.4
Electrical and Optical equipment 648.5 595.9 728.1 669.9 1593.9 1482.7 118.3 101.3 142.0 114.2
Transport equipment 56.5 59.6 536.4 593.0 251.7 321.5 103.1 104.4 277.3 270.2
Furniture, miscellaneous manufacturing; recycling 43.2 42.1 33.4 31.6 36.1 37.3 83.7 75.8 93.5 82.7 Electricity, gas and water supply 53.3 63.6 66.0 88.9 7.5 9.9 93.8 113.6 49.9 65.4
Construction 68.4 60.2 197.4 180.6 61.2 66.1 152.3 132.9 135.4 107.9
Wholesale and retail trade 86.6 78.7 24.2 24.1 25.5 28.1 182.3 176.3 116.9 106.1
Hotels & catering 96.1 99.5 11.3 12.4 2.0 2.7 73.6 77.4 26.5 28.7
Transport and storage and communication 304.7 269.5 54.3 57.0 66.3 89.3 237.7 221.8 245.7 239.0
Financial intermediation 30.2 42.1 2.8 3.8 3.1 5.5 176.2 219.6 284.9 355.5
Real Estate, Renting and Business activities 113.4 112.3 6.9 7.7 16.4 17.9 118.7 122.2 176.2 188.6 Source: Elaborations on Eurostat Input-Output tables.
Note: * ISIC 30; ** ISIC 31; *** ISIC 32; † ISIC 64; ‡ ISIC 72. ICT intensity is calculated as the ratio between the use of ICT capital or service, and the gross output of the industry. The investments in ICT have been deflated by using a harmonized hedonic price index.
Table 4 - One Step Robust GMM System Estimates (1) (2) (3) (4) logAt-1 0.721*** (0.063) 0.714*** (0.065) 0.535*** (0.133) 0.520*** (0.112) INV30 t-1/Y t-1 1.881** (0.914) 0.917 (1.984) INV31 t-1/Y t-1 -0.985 (0.731) -0.621 (0.558) -0.044 (1.403) INV32 t-1/Y t-1 1.356** (0.692) 0.807** (0.331) INV64 t-1/Y t-1 -1.520 (1.785) -3.542 (2.601) INV72 t-1/Y t-1 2.154 (1.634) 3.382 (2.352) (INV30+INV72) t-1/Y t-1 1.711 (1.624) (INV32+INV64) t-1/Y t-1 -0.380 (0.650) N. Obs. 216 216 216 216 F 54.15*** 54.03*** 48.24*** 2789.3 Hansen Test 10.64 9.75 10.09 9.17 AR(1) -1.92** -1.81* -1.64* -1.60* AR(2) -1.31 -1.37 -1.38 -1.27 Dependent variable: logA.
Notes: robust standard errors between parentheses. All Models control for industry and time fixed effects. *** p<0.01; ** p<0.05; * p<0.1.
The instruments used in each equation (where available and where the corresponding regressor is included in the model) are:
lnAt-1 , lnAt-2 , INV30t-1 , INV30t-2 , INV30t-3 , INV31t-1 , INV31t-2 , INV31t-3 , INV32t-1 , INV32t-2 , INV32t-3 ,