Development of Operations Based Long Range
Network Capacity Planning Models
by
Cynthia M. Wilson B.S., Chemical Engineering
Massachusetts Institute of Technology, 2006
Submitted to the MIT Sloan School of Management and the Department of Chemical Engineering
in Partial Fulfillment of the Requirements for the Degrees of
MASSACHUSETTS INSTITUTE OF TECHNOLOGY
LJUN 15 7911
LIBRARIES
ARCHNES
Master of Business Administration and
Master of Science in Chemical Engineering
In conjunction with the Leaders for Global Operations Program at the Massachusetts Institute of Technology
June 2011
C Massachusetts Institute of Technology. All rights reserved.
Signature of Author_
Certified by
Certified by
Accepted by
Accepted by
MIT Sloan School of Management, Dq rtment of Chemical Engineering May 6, 2011
Stephen Graves, Thesis Supervisor Abraham Siegelpofessorpf Management
Charles Cooney, -Tiesis Supervisor Robjgt T. Haslam Profpqsor of Chepical Engineering
Debbie Berechman Executive Director of MBA Program, MIT Sloan School of Management
William Deen, Professor of Chemical Engineering Chairman, Committee for Graduate Students Chemical Engineering
Development of Operations Based Long Range
Network Capacity Planning Models
by
Cynthia M. Wilson
Submitted to the Sloan School of Management and the Department of Chemical Engineering on May 6, 2011 in Partial Fulfillment of the Requirements for the Degrees of
Master of Business Administration and Master of Science in Chemical Engineering
ABSTRACT
Planning for vaccines manufacturing capacity is both a complex task requiring many inputs and an important function of manufacturers to ensure the supply of vaccines that prevent life-threatening illnesses. This thesis explores the development of an operations based long range capacity planning model to facilitate the annual strategic capacity planning review at Novartis Vaccines. This model was developed in conjunction with process owners at Novartis Vaccines and utilizes operations principles, non-linear optimization, and process data to efficiently calculate the capacity of the vaccine manufacturing network. The resulting network capacity is then compared to the long range demand for vaccine production to determine capacity deficits and surpluses in the current manufacturing network as well as analyzing options for more efficient capacity usage.
Although this model was developed specifically with respect to the Novartis Vaccines manufacturing network, the capacity calculation and gap analysis tools for single and multi-product facilities as well as batch allocation for in multi-multi-product, multi-facility networks are also applicable to other companies and industries that utilize batch processing. The model was validated utilizing process information from a production line that was already operating near capacity and showed a 95% agreement with the data from this line. Additionally, this operations based planning model was able to achieve buy-in from both process owners and the global strategy organization allowing it to be implemented in the planning cycle. Use of this tool enables efficiency and transparency in capacity analysis as well as the tools to examine the impact of a range of scenarios on the manufacturing network.
Thesis Supervisor: Stephen Graves
Title: Abraham Siegel Professor of Management Thesis Supervisor: Charles Cooney
Acknowledgements
There are a great many people who have contributed to the development of this work, and I would like to express my gratitude for their contribution in making this thesis possible.
Novartis Vaccines & Diagnostics: Thank you for the sponsoring this project, and thank you to the many employees who shared in the vision for this model and gave of their time and
knowledge to ensure its success. I especially would like to thank the project champion, Andrew Knudten, and the project sponsor, Christopher McDonald, for the guidance, industry
knowledge, and organizational support you provided.
Professors Stephen Graves and Charles Cooney: The advice in developing this project and guidance in developing modeling methods and methodologies was invaluable to making this thesis project a success.
Don Rosenfield and the MIT Leaders for Global Operations faculty, staff, and students: It has been an exciting two years, and I am very thankful for the dedication, encouragement, and time that this group puts into making the LGO experience enriching and fulfilling. A special thank you goes to Kacey Fetcho Phillips, Dannielle Sita, Chris Hopkins, and Todd Waldron, my LGO classmates at Novartis, for coordinating alignment between each of our respective projects, and providing insights and logistical advice as I visited your project facilities. Also to Kacey Fetcho Phillips, thank you for your assistance in editing this thesis.
Finally, thank you to my parents, Ronal and Janice Wilson, and the rest of my family for your unconditional love and always being there to guide and encourage me.
Table of Contents
ABSTRA CT ... 3
A cknow ledgem ents ... 5
Table of Contents ... 7
Table of Figures ... 10
1 Introduction...11
1.1 Problem Statem ent...11
1.2 Background and M otivation ... 11
1.3 Hypothesis ... 12
1.4 M ethodology...12
1.4.1 Phase 1: Capacity Calculation... 12
1.4.2 Phase 2: Long Range Planning M odel ... 13
1.5 Results ... 13
1.6 Thesis Overview ... 14
2 V accines Industry and N ovartis Overview ... 15
2.1 V accines D evelopm ent ... 15
2.2 M ajor Players...18
2.3 Regulatory Control ... 21
2.4 V accine M anufacturing Processes... 23
2.4.1 Bulk M anufacturing ... 23
2.4.2 Fill/Finish M anufacturing ... 25
2.5 Challenges of Seasonal and Pandemic Flu Vaccine Production ... 27
2.5.2 Seasonal Flu Production... 27
2.5.3 Pandem ic Flu Production ... 28
2.6 N ovartis Com pany Background ... 29
2.6.1 N ovartis Overview ... 29
2.6.2 N ovartis V & D Overview ... 29
3 M odel D evelopm ent...33
3.1 M odel Tim efram e ... 33
3.1.1 Tim efram e Selection ... 33
3.1.2 Timeline Implications on a Long Range Planning Model ... 34
3.2 Capacity M odel Overview ... 37
3.2.1 G eneral Capacity Calculation M ethodology ... 37
3.2.2 Multi-Product Facility Capacity Calculation Methodology...40
3.2.3 M ulti-Product, M ulti-Facility D ecisions ... 47
3.3 Inputs and Outputs Overview ... 48
3.3.1 M odel Inputs ... 48
3.3.2 M odel Outputs... 53
3.4 General Capacity M odel Form ulation ... 54
3.5 Capacity Model Formulation Variations for Complex Cases...56
3.5.1 M ulti-product Facilities... 56
3.5.2 M ulti-product, M ulti-facility Capacities and D ecisions... 59
3.5.3 Influenza V accine M anufacturing... 61
4 Results...63
4.1 Scenario Analysis ... 64
4.2 Assum ptions and Lim itations ... 65
5 Conclusions and Recom m endations ... 68
5.1 Business Application and Recommendations for Novartis ... 68
5.2 General Im plications for Other Com panies and Industries ... 72
5.3 Areas for Further Research and M odel Developm ent ... 73
5.4 Conclusions ... 75
Bibliography...77
Table of Figures
Figure 1: Examples of Vaccines Presentation Forms... 26
Figure 2: Menveo Kit Presentation... 26
Figure 3: Novartis Vaccine Pipeline...32
Figure 4: Factors in Planning Model Timeframe ... 34
Figure 5: Capacity Loss Analysis... 38
Figure 6: Multi Product Production Methods... 42
Figure 7: Process Isolation Methodology...44
Figure 8: Step Isolation Scheduling Effects ... 45
Figure 9: Step Isolation Methodology... 46
Figure 10: Primary Summary Quantitative Example...53
Figure 11: Primary Capacity Graphical Example... 53
1 Introduction
1.1 Problem Statement
Long range capacity planning allows vaccine manufacturers to identify shortfalls in their available production capacity compared to the forecasted demand for the life saving vaccine products they manufacture. The long range time frame allows manufacturers to plan and execute capacity, regulatory, and third party manufacturing capacity adjustments as necessary based on demand. It also enables manufacturers to look forward and plan for the introduction of new products in the pipeline. The purpose of this thesis project is to develop a model that will allow Novartis Vaccines & Diagnostics to more efficiently balance commercial demand and production
capacity in the two to five year timeframe.
1.2 Background and Motivation
Prior to this project, for 2-5 year (long range) global capacity planning, Novartis Vaccines primarily used a manual method of identifying shortfalls by matching available capacity, as identified by each facility, to the long range expected commercial demand. This manual method is resource intensive and involves redefining manufacturing capabilities for each product every year. The planning process usually involves limited interaction between planning for primary production (bulk vaccine components) and planning secondary production (vaccine formulation and filling) in allocating manufacturing capacity as well as in identifying methods to rectify capacity shortfalls. Additionally, examining the manufacturing network on an individual facility basis has the potential to lead to locally optimized manufacturing networks rather than a globally optimized supply chain (Simchi-Levi, Kaminsky and Simchi-Levi 2008).
Novartis Vaccines also lacked a standard definition for what assumptions are included capacity (or capability) calculations for vaccines manufacturing processes. This creates a variety of "capacity" definitions throughout the organization and results in a variety of different assumptions used in the capacities utilized for planning
1.3 Hypothesis
Operations principles and operational data can be used to calculate the capacity of both single
product and multi-product vaccines manufacturing equipment, and these capacity calculations can be used to identify both capacity shortfalls and surpluses when compared to the commercial demand forecasts for each year.
1.4 Methodology
The methodology utilized in this project involves two phases. The first is the development of a standardized methodology to calculate the capacity of all of the process operations for Novartis Vaccines and Diagnostics. Secondly, the resulting capacities are compared against the forecasted commercial demand in the two to five year time horizon in a framework that allows analysis of both a base case as well as the ability to conduct scenario analysis of the capacity utilization effect of changes in various operational parameters.
1.4.1 Phase 1: Capacity Calculation
The initial capacity calculations are based on operations principles of identifying bottlenecks and calculating process yields based on these bottlenecks. The calculations are also adjusted to include a scheduling loss allowance for planned downtime and regulatory activities as well as
operating allowances for losses due to unplanned downtime and reject rate (based on operating experience and/or historical data).
The capacity calculation methodology for each primary and filling line has been validated with the process owner and tailored as necessary to fit the process using available data and guidance from process experts. Process data such as cycle time, turnover time, and yields were collected and/or validated by operations staff. For the current model, the formulation and packaging steps are assumed not to be bottlenecks and are not included in the model.
1.4.2 Phase 2: Long Range Planning Model
The long range planning model connects the commercial demand forecast with the production capacity. This model contains the linkages between final product demands, various locations and production lines where each product can be filled, vaccine components in each product,
component production locations, and yield losses. Using the capacities calculated in Phase 1, this model identifies the capacity gaps and surpluses for each product, line, or production facility. Furthermore, this model allows planners to analyze the effects of changing operations parameters or conditions on the network capacity and expected utilization.
1.5 Results
Through thesis research at Novartis Vaccines facilities worldwide, a model based on operational principles has been developed to enable planners to balance supply and demand in the
manufacturing network. The capacity model methodology was able to achieve a 95% agreement with the performance of the validation lines, which are considered to be running at capacity. Additionally, this long range planning model received the necessary buy-in from key process owners and is being to be used as part of the Novartis Vaccines planning process.
1.6 Thesis Overview
This thesis is organized into five chapters. The first chapter covers the introduction of the project and background. Chapter two provides some background into the importance and evolution of the vaccines industry and overview of Novartis Vaccines. This chapter also gives an introduction to the vaccine manufacturing process, regulatory control, and manufacturing challenges that impact model development. The third chapter details the development and formulation of both the capacity methodology and long range planning model. The fourth chapter gives the results of the project. Chapter fives details model recommendations and conclusions for Novartis
Vaccines, as well as applications to other companies and industries. The variables that are utilized in this thesis and equations and their definitions are included as Appendix A. All figures and data contained in this thesis have been sanitized to protect the confidentiality of Novartis Vaccines data.
2 Vaccines Industry and Novartis Overview
The United States Department of Health and Human Services defines a vaccine as "a product of weakened or killed microorganism (bacterium or virus) given for the prevention or treatment of infectious diseases" (US HHS). The weakened or killed viruses or bacteria are called antigens, and they prevent diseases because when the immune system recognizes the antigens it begins to produce antibodies that are able to help the body provide resistance to the full form of the disease when exposed at a later time (Hoyt 2007).
2.1 Vaccines Development
The first major effective vaccine was developed in 1796 by Edward Jenner to prevent smallpox. Previous attempts at smallpox vaccinations had been attempted by injecting smallpox or inhaling smallpox scabs in an attempt to only get a mild case, but many people still died from this
practice. Jenner observed that patients who developed non-life threatening cowpox from their exposure with cows did not develop the much more life threatening smallpox. Accordingly Jenner developed a vaccine that would give people a mild version of cowpox to protect them from smallpox. The term "vaccine" actually comes from this discovery. "Vacca" is the Latin word for cow and "vaccina" was the virus used in the smallpox vaccine. Louis Pasteur applied the term vaccine to all forms of prophylactic immunization beginning in 1881. In 1979, the World Health Organization declared smallpox to be completely eliminated (Kit 2007), (The Gale Encyclopedia of Science 2004).
In 1885, Louis Pasteur developed the first vaccine developed in a laboratory for rabies. The vaccine consisted of a weakened live virus from infected rabbits. As Pasteur continued his
development of the rabies vaccine, he discovered that the rabies virus produced a weakened (or attenuated) response in dogs when it had first been serially passed through rabbits. This
development of the attenuated live virus was a significant step in developing a safer vaccine with lesser side effects. Live attenuated viruses can cause a mild form of the disease in a small
number of people, but significant protection against the full strength antigen. Vaccines for polio, measles, rubella, mumps, yellow fever, influenza, and chickenpox are a selection of vaccines that are still given as live attenuated viruses today (Kit 2007), (The Gale Encyclopedia of Science 2004), (Hoyt 2007).
Pasteur continued his experiments with the rabies vaccine to also discover that the rabies virus could be "inactivated" by the chemical formalin so that it still caused an immune response but was not infectious. Eventually, this lead to the development of other "inactivated" or "killed" vaccines as well including vaccines for polio, mumps, influenza, Japanese encephalitis, and equine encephalitis (Kit 2007). Because the antigens are dead, inactivated vaccines do not carry the risk of developing a mild form of the diesase, but immunity from these vaccines generally declines over time and multiple doses are often required (Hoyt 2007).
Subsequently, other types of non-infectious vaccines have been developed including
polysaccaride vaccines which contain only the polysaccaride coat of the virus linked to a carrier protein. Polysaccaride vaccines have been useful in combating Hemophilus influenza type b (HIB). Recombinant and subunit vaccines which are comprized of only the immunogenic viral proteins linked to adjuvants or formed into vesicles are also non-infectious vaccines. The lack of non immunogenic components limits the risk of exposure to infectious virus and adverse side effects. The hepatitis B vaccine has been developed using recombinant subunit vaccine
technology in recombinant yeast cells which contain the gene for the hepatitis B antigen (Kit 2007), (The Gale Encyclopedia of Science 2004).
As vaccine technology continues to advance a number of vaccine technologies are in
development including vaccines using synthetic peptides, biosynthetic peptides, recombinant protiens, DNA, and genetic engineering. These technologies are being developed in an attempt to
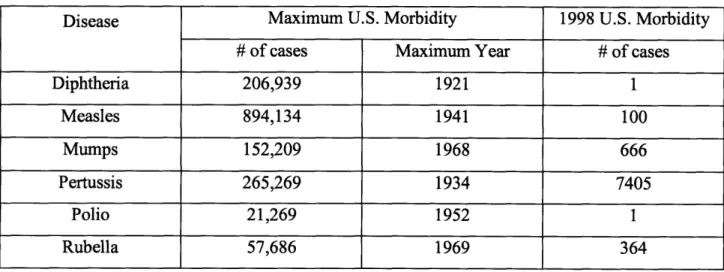
find safe and effective vaccines against a variety of diseases that kill at least 8 million people year including pneumoncoccal pneumonia, AIDS, malaria, acute respiratory infection and rotavirus. Routine vaccination of children and adults has been highly effective in minimizing the morbidity associated with these diseases. Table 1 shows the advances that have been made in limiting morbidity in the United States for a selection of commonly vaccinated diseases.
Table 1: U.S. Morbidity Rate Selected Diseases
Disease Maximum U.S. Morbidity 1998 U.S. Morbidity
# of cases Maximum Year # of cases
Diphtheria 206,939 1921 1 Measles 894,134 1941 100 Mumps 152,209 1968 666 Pertussis 265,269 1934 7405 Polio 21,269 1952 1 Rubella 57,686 1969 364 Source: Kit 2007
However, despite the progress, world-wide approximately four million people die every year from vaccine preventable diseases including:
" Measles: 1,100,000 deaths * Hepatitis B: 800,000 deaths
e Haemophilus influenzae type B (HIB): 500,000 deaths
" Tetanus: 500,000 deaths
e Pertussis (whooping cough): 350,000 deaths
* Rubella: 300,000 deaths
e Yellow fever: 30,000 deaths
Of these, children under five years old account for 1.4 million or 14% of the global mobidity for children under five (World Health Organization). These deaths occur partially because of the enormous challenge of vaccinating a global population, many of whom lack adequate healthcare. In the United States and many European countries, some parents have chosen not to vaccinate their children for safety, political, or religious reasons. This practice however, leaves their children exposed to the devestating consequences of contracting vaccine preventable diseases. During the U.S. measles epedimic of 1989, 18,000 people were infected. Even though the measles vaccine had been available in the United States since 1960, only 15% of those who contracted the disease had received a measles vaccine. Additionally, lack of proper (and
recommended) vaccination for pertussis (whooping cough) for many children in the United States has resulted in approximately 30,000 American children per year contracting the disease (Kit 2007), (Alexandra & Markel 2005).
2.2 Major Players
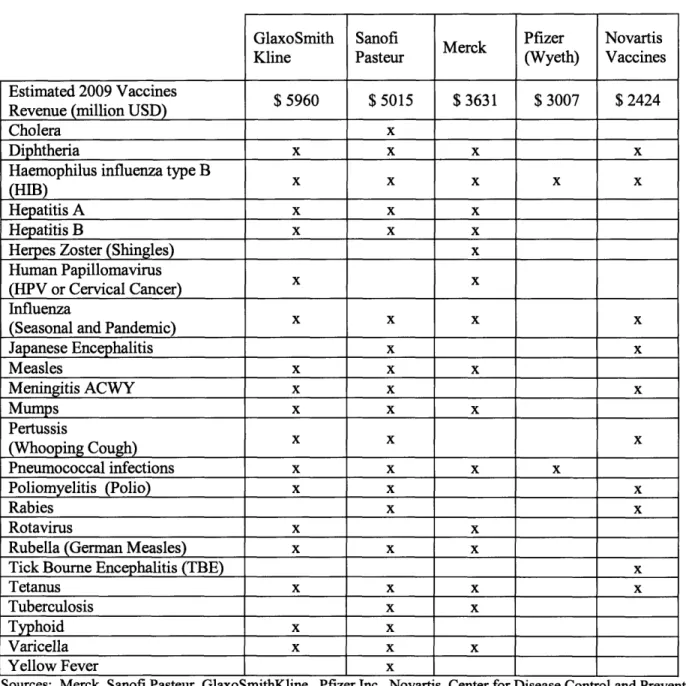
As of the end of 2010, the vaccines industry is comprised of five major players:
GlaxoSmithKline, Sanofi Aventis, Merck, Pfizer, and Novartis, and these five companies supply 80% of the global vaccines market. Over the past 10 years, the vaccines industry has seen market share consolidation as the number of major players decreased from fourteen in 1988 to these five players in 2010. The majority of the players that exited the industry during this period can be
attributed to the small margins for vaccine production, the cost of vaccine research and development, national vaccine policies, and liability concerns (Prifti).
Table 2: Top Five Global Vaccine Manufacturers GlaxoSmith Kline Sanofi Pasteur Merck Pfizer (Wyeth) Novartis Vaccines Estimated 2009 Vaccines $ 5960 $ 5015 $ 3631 $ 3007 $ 2424
Revenue (million USD)
Cholera x
Diphtheria x x x x
Haemophilus influenza type B (HIB)
Hepatitis A x x x
Hepatitis B x x x
Herpes Zoster (Shingles) x
Human Papillomavirus
(HPV or Cervical Cancer)
Influenza
(Seasonal and Pandemic) _______
Japanese Encephalitis x x Measles x x x Meningitis ACWY x x x Mumps x x x Pertussis (Whooping Cough) X X X Pneumococcal infections x x x x Poliomyelitis (Polio) x x x Rabies x x Rotavirus x x
Rubella (German Measles) x x x
Tick Bourne Encephalitis (TBE) x
Tetanus x x x x
Tuberculosis x x
Typhoid x x
Varicella x x x
Yellow Fever x
Sources: Merck, Sanofi Pasteur, GlaxoSmithKline, Pfizer Inc., Novartis, Center for Disease Control and Prevention The next five vaccine manufacturers are much smaller in market share and focus either on a more narrow market or have only a few commercial products. They are as follows:
China National Biotechnology Corporation (CNBC): CNBC is the state owned
biotechnology company in China which produces vaccines for thirteen diseases. CNBG enjoys a 80% market share for vaccines in China (DCVMN), (BioPharmaLink Profile).
Baxter International: Baxter is a global diversified healthcare company that manufactures
vaccines for Tick Bourne Encephalitis, Meningitis C, and influenza (Baxter).
CSL Limited: The CSL Biotherapies division manufactures the seasonal influenza vaccine
and acts as a third party distributor for other vaccine manufacturers in Australia and New Zealand (CSL).
Crucell: Crucell is focused on producing vaccines for influenza, hepatitis A, hepatitis B,
typhoid fever, and cholera (Crucell).
Solvay: Solvay Biologicals, a division of Solvay Pharmaceuticals manufactures the seasonal
influenza vaccine (Solvay 2010).
In 2002, Dr Robert Goldberg of the Center of Medical Progress at the Manhattan Institute described the pharmaceutical industry's view on vaccines as "a brackish backwater of other biotechnology and pharmaceutical enterprises" (Goldberg 2002), but more recently the vaccines
industry has been undergoing a consolidation with global diversified healthcare companies. In 2004, Aventis acquired its vaccines division, Sanofi Pasteur as part of
Sanofi-Synth61abo's acquisition of Aventis. Novartis AG's vaccines division, Novartis Vaccines and Diagnostics was formed with the acquisition of Chiron Corporation in 2006 (Novartis 2006), and Pfizer entered the vaccines market with the acquisition of Wyeth in 2009 (Pfizer 2009). At the end of 2010, Johnson and Johnson was in the process of acquiring vaccine manufacturer Crucell (Crucell 2010).
2.3 Regulatory Control
Like the rest of the pharmaceutical and biotechnology industry, the vaccines industry is highly regulated by the Food and Drug Administration (FDA) in the United States, the European Medicines Agency (EMA) in the European Union, and many other regulatory bodies from other countries where the company's products are sold. The World Health Organization provides regulatory recommendations which are used by many national organizations. The quantity of regulatory bodies, variation in regulations from different countries, and intensity of scrutiny in both development and manufacturing of vaccines requires significant investment and effort put
into compliance by vaccine developers and manufacturers (WHO 2011), (FDA 2010), (The College of Physicians of Philadelphia).
Government regulation of vaccines began in 1902 in the United States government passed a law that later became known as the "Biologics Control Act". This was the first government
regulation on the quality of drugs and it established an agency to oversee biologics manufacturing facilities. Licensing for biologic products began in the U.S. in 1944 The Division of Biologic Standards, which later became part of the FDA, was formed in 1954.
During vaccine development, once promising vaccine candidates are identified and proven nontoxic in animals or cells, they must undergo a series of clinical trials in humans to prove their safety and efficacy. The vaccine material developed for these clinical trials must be
manufactured in accordance Good Manufacturing Practices. Human clinical trial requirements vary slightly for each regulatory body, which sometimes requires different clinical trials to be conducted in different countries. However, they generally progress to approval in three phases:
Phase I: Safety, appropriate dosage range, and side effects are studied using a very small group of people (generally less than 100 people).
Phase II: Effectiveness, or efficacy, of the vaccine is studied in a larger group of people (generally hundreds of people) against a placebo. Safety, dosage, side effects, and method of delivery are also studied in this phase.
Phase III: Efficacy of the vaccine is studied in a very large group of people (generally several thousand people) against a placebo as well as against other vaccines for the disease already on the market. Safety and side effects also continue to be studied and the much larger study population gives an opportunity to recognize rare side effects from the vaccine.
Following successful completion of the Phase III clinical trial, the vaccine manufacturer files licensing documentation with the appropriate regulatory authorities in each country where the vaccine is to be marketed. In addition to product data for safety, efficacy, purity, and potency; inspection of the manufacturing facilities and regulatory review of the product labeling is generally required before approval is granted for most agencies. Upon approval from the regulatory bodies, the vaccine can be administered to the approved population (The College of Physicians of Philadelphia), (U.S. National Institutes of Health 2007), (FDA 2010).
Regulatory agencies continue to monitor the safety and efficacy of vaccines following regulatory approval through inspections of manufacturing facilities and optional phase IV clinical trials for pharmacovigilance or continuous monitoring of large populations that have taken the vaccine
(FDA 2005). In the United States, the FDA and CDC have developed a reporting system called the Vaccine Adverse Event Reporting System, where anyone can report serious events following
vaccination. These reports are then investigated by the FDA and CDC. The FDA and CDC have also developed the Vaccine Safety Datalink where researchers perusing approved studies can access data about populations that have been vaccinated (The College of Physicians of Philadelphia).
In order to be compliant with regulatory standards, vaccine manufacturers are required to produce vaccines in accordance with current Good Manufacturing Practices (cGMP or GMP). These standards provide guidance to vaccine industry on the minimum requirements for quality production systems. The FDA, EMA, and other regulatory authorities inspect vaccines
manufacturing facilities regularly to ensure compliance with these regulations. There are GMP standards for facility organization, personnel, training, facilities, process controls, equipment, process and equipment validation, cleaning and maintenance processes, laboratory controls, standard operating procedures, deviations, material handling, sampling, testing, record keeping, packaging, labeling, and warehousing (21 CFR 210), (21 CFR 211).
2.4 Vaccine Manufacturing Processes
The vaccine manufacturing process consists of two major processes: bulk manufacturing and fill/finish manufacturing.
2.4.1 Bulk Manufacturing
Bulk manufacturing, also called primary manufacturing, is the biological process of making the bulk antigens (or active drug substances), as well as vaccine components that facilitate immune response in some vaccines called adjuvants.
Novartis Vaccines primarily uses either egg-based, fermentation, or cell culture-based biological processes to manufacture vaccine antigens. Although the exact process and necessary equipment varies for each vaccine, the basic process steps for egg-based antigen production are:
inoculation, incubation, harvest, inactivation, and purification/concentration. Similarly, for fermentation the steps would be: fermentation, harvest, inactivation, and purification and for cell culture the steps would be: seed preparation, cell expansion, cell culture, and harvest.
Although many bulk processes share some of the same steps, producing more than one vaccine on the same set of equipment depends on multi-product production not only being technically feasible, but also on the regulatory feasibility, and set up and change over validation between vaccines. Regulatory validation of production is required not only for the general process but also for each facility and line. Additionally, many bulk processes have substantially long cycle times and changeover times required between the production of each vaccine. Multi-product production would not only require downtime for cleaning, sterilization and other changeover activities, but also a significant ramp up period before the first bulk material from the next vaccine was completed. Consideration of these factors generally leads vaccine manufacturers to utilize specialized or dedicated bulk production facilities and suites, where either a single antigen is produced or each of the antigens for a multi-valent vaccine is produced in series on the same equipment. Where multiple vaccines are produced using the same bulk equipment, they are generally very similar and of the same production type (egg-based, bacterial fermentation, etc.) For example, flu production capacity is often used to produce multiple vaccines. All three strains of the northern hemisphere seasonal influenza vaccine are often produced in series on the same production line. When seasonal influenza production is completed, the same line is often used to
produce the southern hemisphere egg-based influenza vaccine or an influenza vaccine for pandemic stockpiling.
2.4.2 Fill/Finish Manufacturing
Fill/finish manufacturing, also known as secondary manufacturing, generally consists of three steps: formulating the vaccine by combining the bulk components in the correct amounts, filling the liquid vaccine into its final presentation form, and packaging. Packaging requires placing a label on container(s) of the vaccine components and then placing them as well as an information leaflet into a blister pack and/or box. For vaccines that need additional stability or shelf life, there is often an additional lyophilization, or freeze drying, step after filling that turns the liquid vaccine into a solid that has to be reconstituted just before administration.
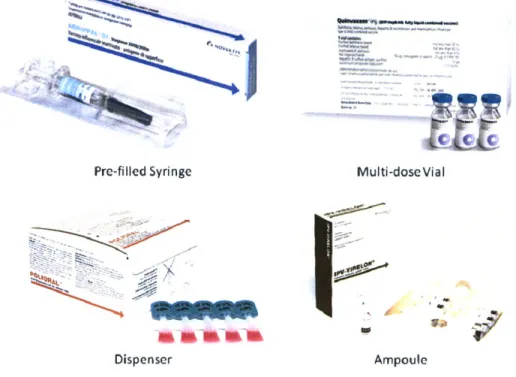
There are a variety of presentation forms that vaccines can be filled into. The primary forms are pre-filled syringes and vials, although ampoules and plastic dispensers are also used for some products particularly in developing countries. Figure 1 depicts each of these presentation forms as well as a representative Novartis Vaccines product that is presented in that form for some markets. It is not uncommon for vaccines to be filled in different presentation forms for different markets depending on factors such healthcare provider's preference, economic advantages in each market, and regulatory constraints.
An additional layer of complexity for planning is that some vaccines require more than one presentation form to complete a single dose. Novartis Vaccine's meningococcal ACWY vaccine, Menveo, is an example of such a vaccine. The MenA component of the vaccine is a solid in a lyophilized vial, and the MenCWY components are in liquid form in a prefilled syringe or vial. Figure 2 shows an example of packaging for a single dose of this product, which contains a
lyophilized vial, a pre-filled syringe, and two needles. Figure 2 shows the outer packaging for the product as well as the package leaflet that are both assembled as part of the packaging process. Figure 1: Examples of Vaccines Presentation Forms
C c e_ ai Pre-filled Syringe - V -;-~ ~\ Dispenser Multi-dose Vial Ampoule
Source: Novartis Vaccines
Figure 2: Menveo Kit Presentation
2.5 Challenges of Seasonal and Pandemic Flu Vaccine Production
2.5.1 About Influenza and Influenza Vaccines
Influenza, or flu, is a respiratory infection that affects 5-15 % of the American population each year during the winter months. The elderly and young children are most at risk for
complications. On average 23,600 people die in the United States each year from flu related complications (CDC 2005).
Although the prevalent strains of influenza virus change from year to year, there are three main types of influenza virus that circulate in humans and some other animals: types A, B, and C. Type A is categorized into sub-types based on the presence of surface glycoproteins
hemagglutinin (HA) and neuraminidase (NA). The naming convention uses the abbreviations H and N respectively each followed by number assigned to the type of glycoprotein present. For example, the recent "swine flu" epidemic was caused by a strain of the influenza A virus subtype H1N1 (CDC 2005).
2.5.2 Seasonal Flu Production
Most vaccine products are non-seasonal and have limited seasonal variability in a given year. However, the seasonal influenza (flu) vaccination is a highly seasonal product and an important part of the vaccines portfolio for many vaccines manufacturers. North America seasonal
influenza epidemics typically occur during the late winter and early spring (Solvay 2010), (CDC
2005).
The seasonal influenza vaccine changes each year based on the strains of the flu vaccine that are expected to be circulating in that year. For northern hemisphere flu, the World Health
Organization selects the three strains of the flu virus to be used in the influenza vaccination for the upcoming season. These strains are released to vaccine manufacturers in February of each year. Generally two influenza A type and one influenza B type strains are selected (Emory Healthcare). Flu vaccine manufacturers then have until early fall when seasonal flu vaccinations begin to develop vaccines utilizing the recommended strains, undergo clinical trials for safety (in some markets), manufacture the antigens for all three strains, formulate the three antigens into a trivalent vaccine, fill into the final vial or pre-filled syringe presentation forms, package, and deliver the vaccines to distribution points. Because most vaccine manufacturers begin production "at risk" in January based on what they expect the strain selection to be, North American seasonal influenza vaccine primary manufacturing is limited from January to early fall of each year when there is no longer an economically viable market for additional product. Additionally, because the three strains for the vaccine are generally produced in series on the same equipment, the
secondary manufacturing for the influenza vaccine operates in an even more limited season as it cannot begin until production lots of the third influenza strain begin to be released.
The seasonality of the influenza vaccine creates particular challenges in capacity and capability planning. Planners must consider the viability of either only operating the facilities part of the year, methods of producing other products in the off season to level-load the facility year round, or operating at a high level of utilization during the flu production season and a much lower level of utilization with other products during the off season.
2.5.3 Pandemic Flu Production
An influenza pandemic is generally caused by the emergence of a strain of the Influenza A virus that is significantly different than other circulating strains (CDC 2005). In 1918, there was an influenza pandemic that resulted in 40 million deaths worldwide (Solvay 2010). Pandemic
influenza vaccines are generally produced in the same method as the seasonal influenza vaccine, except that the antigen is produced for only one strain in the pandemic vaccine. When the pandemic influenza vaccine is required it is generally because of a pressing public health need and must be produced quickly and in large volumes to meet this need. In response to the avian and swine pandemic flu scares of the past few years, many countries have taken steps to reserve pandemic influenza manufacturing capacity and/or stockpile pandemic influenza vaccines. In turn, pandemic planning has affected how vaccine manufacturers plan influenza capacity based on incentives from these governments.
2.6 Novartis Company Background
2.6.1 Novartis Overview
Novartis AG is Swiss based company that seeks to provide healthcare solutions that address the evolving needs of patients and societies worldwide. Novartis had revenue of $44 billion in 2009 and a global reach in their four major divisions. The divisions: Pharmaceuticals, Sandoz (generics), Consumer Health, and Vaccines and Diagnostics represent a diverse portfolio of healthcare solutions for Novartis's customers (Novartis).
2.6.2 Novartis V&D Overview
Novartis' Vaccines and Diagnostics division (NVD) is the smallest but fastest growing of all the Novartis divisions. NVD posted revenues of $2.4 billion in 2009 with a growth rate of 13.9% over the previous year. Over 800 million vaccine doses are shipped annually to 85 countries resulting in a vaccine from Novartis providing potentially life-saving immunity to disease every 25 seconds (Novartis Vaccines).
2.6.2.1 Major Products
Novartis Vaccines produces vaccines for over 20 viral and bacterial diseases. It is the fifth largest producer of vaccines in the world and the second largest supplier of influenza
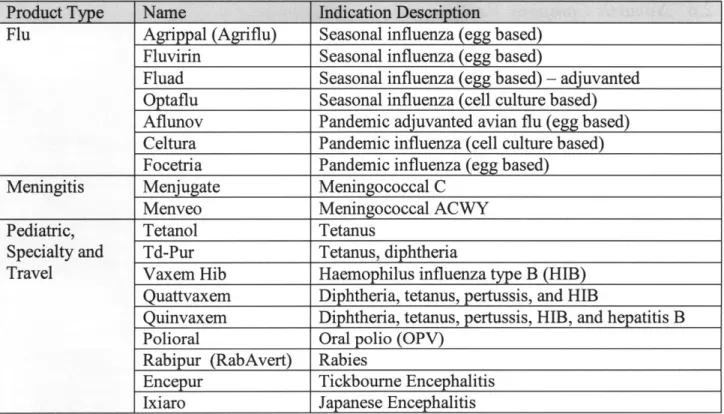
vaccinations. Additionally, Novartis Vaccines produces Fluvirin, which is the second largest selling seasonal influenza vaccine in the United States. Novartis Vaccines produces vaccines in three product families: Flu, Meningitis, and Pediatric and Specialty vaccines. Table 3 gives a representative list and description of Novartis Vaccines products.
Table 3: Selected Novartis V&D Products
Product Type Name Indication Description
Flu Agrippal (Agriflu) Seasonal influenza (egg based) Fluvirin Seasonal influenza (egg based)
Fluad Seasonal influenza (egg based) - adjuvanted
Optaflu Seasonal influenza (cell culture based) Aflunov Pandemic adjuvanted avian flu (egg based) Celtura Pandemic influenza (cell culture based) Focetria Pandemic influenza (egg based)
Meningitis Menjugate Meningococcal C
Menveo Meningococcal ACWY
Pediatric, Tetanol Tetanus
Specialty and Td-Pur Tetanus, diphtheria
Travel Vaxem Hib Haemophilus influenza type B (HIB) Quattvaxem Diphtheria, tetanus, pertussis, and HIB
Quinvaxem Diphtheria, tetanus, pertussis, HIB, and hepatitis B Polioral Oral polio (OPV)
Rabipur (RabAvert) Rabies
Encepur Tickbourne Encephalitis
Ixiaro Japanese Encephalitis
Source: Novartis Vaccines
2.6.2.2 Sites
The global Novartis Vaccines manufacturing network currently spans six sites in five countries. Each site acts as a center of excellence for production of a particular type of vaccine, vaccine
component, or part of the vaccine manufacturing process. The global manufacturing network consists of facilities in:
" Liverpool, England - Egg-based flu vaccine production
e Marburg, Germany - Travel and pediatric bacterial vaccine production (Tetanus,
Diphtheria, Pertussis, TBE, Rabies), Lyophilization
e Siena, Italy - Egg based flu vaccine production, Polio
* Rosia, Italy - Glycoconjugate bulk vaccine production, fill/finish and packaging
" Holly Springs, North Carolina USA - Flu Cell Culture bulk vaccine production, fill/finish and packaging
e Ankleshwar, India - Rabies vaccine production, fill/finish and packaging
Contract manufacturers also form a key component of the vaccines manufacturing network. These third parties provide an economic method of fulfilling peak demand periods or non-core components of the manufacturing process. Contract manufacturers are also able to consolidate demand for a particular type of technology that may be uneconomic at the volumes of individual producers, but the volumes from several producers allow them to achieve economies of scale unavailable to individual producers. Contract manufacturers primarily fulfill processes that are not intellectual property intensive such as fill/finish and packaging.
2.6.2.3 Novartis Vaccines Development
Novartis formed its Vaccines and Diagnostic division in 2006 with the $5.4 billion acquisition of Chiron. Chiron faced serious supply constraints and sterility problems. These resulted in the
shutdown of one of its production facilities by British regulators in 2005, which caused major shortages of the influenza vaccine. Novartis led the turnaround effort with aggressive management reorganization and growing the technical abilities of the organization. This turnaround enabled Novartis Vaccines to be a leading provider of the 2009-2010 HINI pandemic influenza vaccination and the first provider to achieve both European Union and United States regulatory approval for their pandemic vaccine (Staton 2010), (Bigelow 2010).
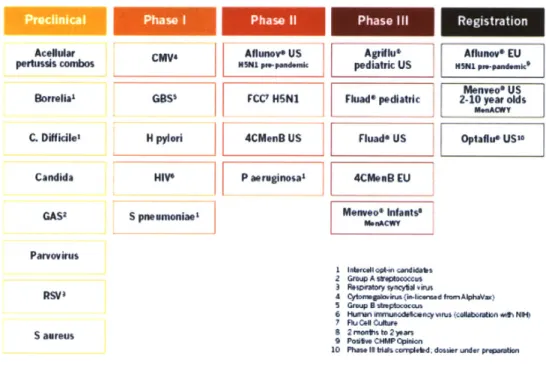
Looking forward, Novartis has a strong pipeline of vaccines in development as illustrated in Figure 3. The vaccines in development include a seasonal influenza vaccine produced in cell culture, approval of the meningitis ACWY vaccine for additional age groups, a four-valent meningitis B vaccine, group B streptococcus, H pylori, and HIV (Novartis Vaccines). Development of these vaccines and others like them will continue to further Novartis Vaccine's mission of disease prevention.
Figure 3: Novartis Vaccine Pipeline 2010
Novartis pipeline of vaccines
Prelincal Phae iPhae i Phse il Re gi stra tion
Acellur CMV6 Aflunove US Agriflu Aflunov EU pertussis combos NSNI 1ppedesc pediatric US HSNI pe-pendemic
[ F Menvoo us
Sorrelial GBS' FCC' HSN1 Fluad* pdiatric 2-10 year oSs
C. Difficile, H pylori 4CMnB US Fluad* US Optaflue US"G
Candida HIVO P aerginosa1 L EU
GAS2 S pneumoniae Mene ants'
ParvoVirus
1 loal t -tp candidabs
2 Group A sweptooccus 3 IospUatory WY# V1 'iris
R$V 4 Oy*nvugahriu(ia-haud fenmAlphaVax)
5 Group B stres cocau
6 HumW~ NYmniadektie" "vus (collaofto *vth NH
7 Ru 0" Cudbw,
aueu 2 mronts to 2 yan
S aurew9 Positive CWMP Ophion
10 Phase i triis corplelbd. dossier under pressaion
NOVARTIS closefM
3 Model Development
The Long Range Planning Model is a capacity analysis model that uses operations data and principles as well as non-linear optimization to calculate the capacity of each of the Novartis Vaccines manufacturing processes. This model is designed to facilitate decisions about the Novartis Vaccines manufacturing network design and product allocation. The model uses this capacity information as well as Novartis Vaccine's demand forecast to efficiently identify gaps between the demand and Novartis' capacity limited ability to supply. Positive gaps (more capacity than demand) either indicate potential for greater production of current products or potential locations to be considered for pipeline products. Negative gaps (more demand than capacity), indicate that strategic decisions will be needed on how to best fill these gaps.
3.1 Model Timeframe
3.1.1 Timeframe Selection
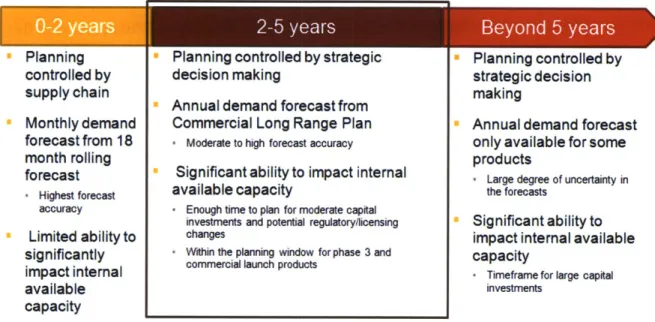
The timeframe that was selected for the Long Range Planning Model is two to five years. This is the time period the best balances the need for accuracy in the product mix and forecasted demand with the need to act in advance of the demand or product launch to make capital investment or regulatory changes. Figure 4 details the factors in selecting a planning model time frame.
The two to five year planning period is the timeframe in which significant capital (Cohen and Roussel), staffing, or regulatory changes can be made to Novartis' internal capacity, but also a timeframe in which contract manufacturing capacity can be secured if necessary and the timeframe in which planning for phase III and commercial launch products takes place.
Additionally, planning for this time period is controlled by strategic decision making and this time period corresponds to the time period covered by the annual Commercial Long Range Plan.
Figure 4: Factors in Planning Model Timeframe
S2-5
years Beyond 5 yearsPlanning controlled by supply chain Monthly demand forecast from 18 month rolling forecast - Highest forecast accuracy Limited ability to significantly impact internal available capacity
* Planning controlled by strategic
decision making
* Annual demand forecast from
Commercial Long Range Plan
* Moderate to high forecast accuracy
* Significant ability to impact internal
available capacity
' Enough time to plan for moderate capital investments and potential regulatory/licensing changes
+ Within the planning window for phase 3 and commercial launch products
" Planning controlled by strategic decision making
" Annual demand forecast only available for some products
- Large degree of uncertainty in the forecasts
" Significant ability to impact internal available capacity
- Timeframe for large capital investments
3.1.2 Timeline Implications on a Long Range Planning Model
Selecting a two to five year timeframe has specific implications on the assumptions used in the Long Range Planning Model. As a result, the validity of the outputs is limited to this timeframe.
3.1.2.1 Demand Risk Pooling and Lead Time
The demand forecast on which the Long Range Planning Model is based is an annualized forecast for each product. The Long Range Planning Model seeks to ensure that demand can be met on an annualized basis for strategic planning purposes rather than on a detailed weekly or monthly production schedule basis that would take into account order timing variability. However, in practice, there is variation in how much of each vaccine is in demand each month, and planning
for maximum capacity utilization does not give the flexibility to handle these variations and maintain the same service level (Simchi-Levi, Kaminsky and Simchi-Levi 2008).
As seasonal flu vaccines are a key part of Novartis' business and northern hemisphere flu must be produced in a limited time frame, both primary and secondary flu capacity has been considered by looking at "total" capacity, considering a 52 week year, and "seasonal" capacity which
considers a shorter northern hemisphere flu vaccine production season.
Although short term supply chain constraints are generally not considered relevant to this model due to its forward looking nature, the annualized demand in the demand forecast is given based on the year in which the vaccine needs to be available to the customer. The vaccine must go through production, formulation, filling, and packaging. Each of these consumes production time, but there are also various forms of testing and required hold times at certain points in the process before the product can be released. As a result, the bulk vaccine manufacturing and filling need to happen substantially before the demand occurs. To account for this lead time in the model, the primary and secondary demand is backwards adjusted based on the lead time for each product. This process assumes a steady demand over the course of the year (except for influenza products), so that the primary production demand for a given year is approximately the year that it actually needs to be produced.
3.1.2.2 Staffing
Often facilities that do not have sufficient demand to operate at equipment capacity operate at staffing levels that are optimized for the current or expected near future demand. In these staffing constrained cases, staffing levels and shift schedules have a significant impact on the capability of the facility to produce product in the near term. Current staffing and shift scheduling may
continue to have a significant impact in the short term (zero to two years) as it takes a substantial amount of time to increase staffing levels because newly hired operators must often participate in a lengthy training and certification process. Therefore, for short term capability planning models (zero to two years) it is logical to include these factors. However, over the longer term (two to five years), staffing and shift structures can be changed to accommodate larger (or smaller) demands. Therefore, the capacity of the process equipment should govern long term strategic planning rather than current staffing levels or shift structures.
3.1.2.3 Inventory
Although margins of vaccine manufacturing are low relative to pharmaceuticals, vaccine manufacturers often face a competitive bid structure to provide government agencies with vaccines. The resulting demand can be highly variable as it depends on the outcome of the bidding process. Missing or delayed product delivery to customers due to production problems or lack of capacity can be devastating to company reputation and future business. In some cases, customers actually order vaccines from several companies and cancel orders from the companies with the longest lead times. Because of the high cost of losing a sale, both from the disease prevention perspective and from an economic perspective, the vaccine industry generally
operates at very high inventory levels to reduce the possibility of shorting the market. However these products often must be managed in a cold chain and therefore have a high cost of storage. They are also products that have a defined shelf life, which can easily lead to costly inventory write downs if not carefully managed (Cohen and Roussel 2005).
Analysis of these inventory levels is beyond the scope of this model, but the Long Range Planning Model assumes that all processes are stable processes resulting in a constant average
level of inventory, such that the inventory level at the end of the year is the same as at the beginning of the year (Anupindi, Chopra and Deshmukh). Therefore, for each year only the demand level for that year needs to be produced. Neither utilizing safety stock nor stockpiling is
considered for the capacity gap analysis, although these factors may be very useful in mitigating capacity shortages as they are identified in the model.
3.2 Capacity Model Overview
The capacity that the long range capacity model calculates is called the process capacity or practical operational capacity. This capacity is the annualized production potential, based on the maximum sustainable production rate of the process (Anupindi, Chopra and Deshmukh).
3.2.1 General Capacity Calculation Methodology
The long range capacity calculation methodology is an operations and optimization based approach to calculating vaccine manufacturing capacity. Both operations principles and non-linear mixed integer optimization programming is used to find the maximum theoretical capacity
for each process as well as a practical operational capacity to be used for capacity planning.
The model calculations begin by considering the maximum theoretical capacity. This is the manufacturing capacity as limited by the process equipment. Under the maximum theoretical capacity assumption, the equipment operates twenty four hours a day, seven days a week, 365
days per year. The theoretical capacity is calculated by examining each of the processing steps and determining which step would produce the smallest amount of final product equivalents over the same period of time. This limiting step is defined as the bottleneck step, which sets the capacity for the entire process. The maximum theoretical capacity model explicitly excludes losses due to manufacturing defects, batch losses due to nonproductive biological conditions, and
other losses including: maintenance, regulatory activities, line stoppages, equipment changeover, cleaning and sanitization (Anupindi, Chopra and Deshmukh).
Once the maximum theoretical capacity case has been considered, the methodology
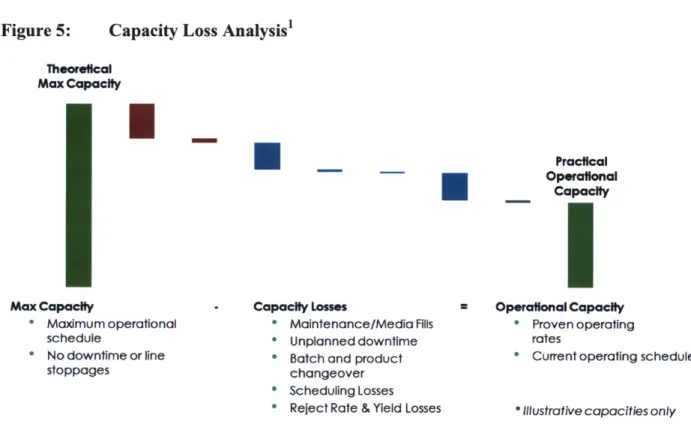
acknowledges that it is unrealistic to operate a production facility in this manner, and therefore unproductive to utilize the maximum theoretical capacity for strategic planning. Both planned and systematic unplanned losses are part of the operating system and including them in the capacity calculation both improves accuracy of the capacity used in planning and assists decision makers in identifying high impact losses that can be targeted for future process improvement efforts. This process is illustrated in Figure 5.
Figure 5: Capacity Loss Analysis' Theoretical Max Capacity Max Capacity * Maximum operational schedule * No downtime or line stoppages
U
Capacity L * Mai * Unp " Batc Practical Operafonal CapacityI
Asses * Operational Capacity
itenance/Media Fills * Proven operating
lanned downtime rates
h and product * Current operating schedule
changeover * Scheduling Losses
* Reject Rate & Yield Losses * Illustrative capacities only
Some of the capacity losses are planned or required, such as planned maintenance downtime, media fills (for sterility testing), changeover and sterilization time between each batch and
product produced on the same process, start-up time after shutdowns until product is produced again, and scheduling losses due to regulatory production limitations. Some losses considered are the result of manufacturing variability such as average reject rate, batch losses, and over fill, line rate loss, and average allowance for unplanned downtime including corrective maintenance and line stoppages. Once all of these losses have been subtracted from the maximum theoretical capacity, the resulting capacity is the practical operating capacity as shown in Figure 5.
The practical operating capacity is the capacity that planners can use to determine how much to expect a certain production facility to produce in a given year. The practical operating capacity is the capacity that among other factors considers regulatory restrictions, average batch yield, operating line speed, and makes an allowance based on historical data for unplanned downtime. The throughput of the process will be less than the practical operational capacity due to lack of or variation in demand, scheduling losses, and available workforce. As a result the following inequalities exist:
Theoretical Maximum Capacity Practical Operational Capacity >Throughput
(Anupindi, Chopra and Deshmukh)
This methodology provides a robust approach to capacity calculation that can be applied to most of Novartis Vaccines processing units as well as many other batch processing units across both the vaccines and pharmaceutical industries and other industries. The limitation of this basic methodology is that it requires that all products produced on the same equipment have the same production characteristics and units of measure. Units of measure in this case can be defined quite broadly. The most useful unit of measure is the same unit of measure of the demand forecast (often doses), but other units of measure can be equally useful and can be converted
between doses of the demand forecast and production quantities. Units such as grams of active drug substance or other appropriate units like LF units for tetanus and diphtheria are useful in cases where many final products contain the same drug substance in different quantities. For multi-product facilities which produce products that do not share similar production
characteristics, or where the common units approach is not sufficiently useful, a more complex capacity calculation methodology is required.
3.2.2 Multi-Product Facility Capacity Calculation Methodology
Facilities or processes that produce multiple products often have substantially different process characteristics like bottlenecks, cycle times, yields, or even process steps for each of the products. These processes require additional steps beyond the general capacity calculation methodology
and are dependent on the product mix (Anupindi, Chopra and Deshmukh).
The one unit of measure that all processes with the same production characteristics have in common is the use of time and occupation of production vessels. This commonality can be exploited to allow the effective examination of multi-product facility capacities considering the products that will be required to be processed in each facility. In addition to process parameters, the capacity of these multi product facilities is also dependant on the regulatory approach to producing multiple products in the same facility. Two approaches will be considered in this section: product isolation by step and product isolation by product.
The multi-product capacity calculation methodology begins by carrying out the general capacity calculation methodology on each of the products that is produced in a facility separately. For example, if three products are produced in facility A, then the capacity of facility A would be calculated based only on producing product 1, then only product 2, and only product 3. The
exception to the general capacity methodology in this case is that the facility should consider the product changeover and start up for all the products in the process even though the capacity is only in terms of a single product. This will give the capacity of the process in terms of
equivalents of each of the products produced on the line.
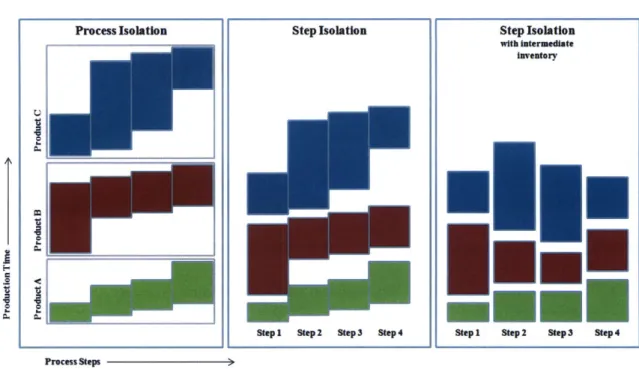
To further consider the impact of multiple products, it is necessary to understand the regulatory environment and constraints on process controls that processing multiple products places on the system. To prevent cross contamination that could take place from factors such as inadequate air handling controls or mishandling of drug material used for different products, there are often isolation procedures for upstream processes that prevent more than one product from being produced in the same area at the same time. Although there are many ways to isolate products within the system, this paper considers the two extremes: process isolation and step isolation. Process isolation is when the entire upstream production process is limited to producing one product at a time. Step isolation occurs when there are sufficient structural and/or process controls to sufficiently isolate each step so that multiple products can be processed in the same process but in different steps. Figure 6 illustrates how each of these constraints would affect product production scheduling and process capacity.
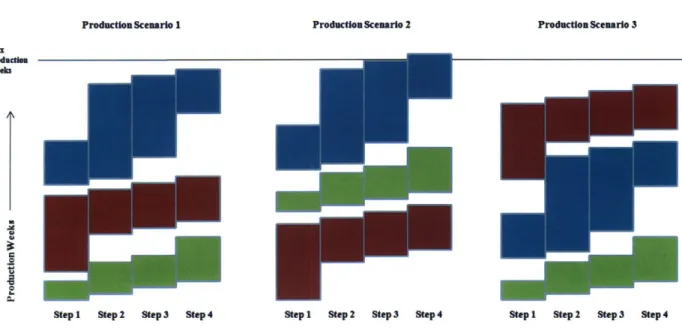
An important variation of the Step Isolation model occurs when there are sufficient stockpiles of intermediate inventory between process steps to allow the timing of each step in the production process to be decoupled from the previous and following steps. This model involves significant tradeoffs between process flexibility, utilization, and inventory holding costs. It also requires that that intermediates are sufficiently stable to allow for inventory holding. Analysis of these
tradeoff factors is outside the scope of this paper. However, the capacity analysis will be considered in both the Step Isolation and Step Isolation with intermediate inventory cases.
Figure 6: Multi Product Production Methods
Process Isolation Step Isolation Step Isolation
with intermediate
inventory
TI
Step1 Step 2 Step 3 Step4 Stepi Step 2 Step3 Step 4
Process Steps
For each of the scenarios, it is assumed that the entire demand of each product is produced in one campaign in each year as this minimizes the amount of set up time required for each product and thus gives a best case examination of capacity utilization. However, there are trade-offs between the number of campaigns of each product and inventory holding costs due to scheduling and demand variability and distribution over the course of the year. As long term demand scenarios are annualized, examination of these factors is more suited to a short term planning analysis than to this model.
In all three of the models the capacity estimation methodology considered the mode of operation, demand for each year, and single product capacity analysis to determine how much of the process and/or step capacity is consumed by the demand for each product. Once this has been determined for each product, the sum of the utilizations either indicates a surplus of capacity or deficit. The surplus or deficit gap can be translated into equivalent doses of any product produced in the facility by considering the single product analysis.
3.2.2.1 Process Isolation
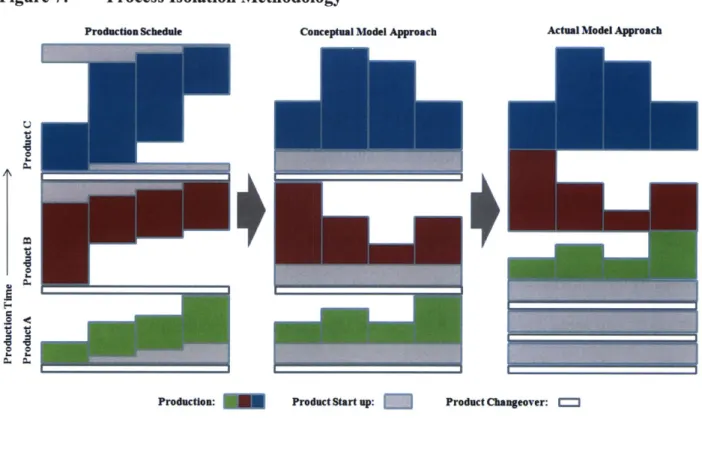
When the system lacks sufficient controls (process, HVAC, etc) to sufficiently isolate the individual steps so that more than one product can be produced at the same time (in different steps), production of the entire product must be completed before the production process can be changed over for the new product and production started on it. Figure 6 illustrates a graphical representation of a production schedule with the process isolation limitation.
In this case, there are additional losses that must be considered due to the fact that the bottleneck step must not only wait at the beginning of the process to receive material, it must also stand idle at the end of the process until the final batch is finished with its last step. The methodology for considering process isolation in a multi-product facility involves a loss due to the changeover process from the previous product, a productive loss due to process startup, and production limited by the bottleneck step. The loss due to start up compensates for the idle time of the bottleneck step while it is waiting for the output of previous steps and the idle time following the completion of the final batch. The loss due to start up for process is equivalent to the minimum time that it takes to complete one batch minus the cycle time of the bottleneck step. Figure 7 illustrates how the process isolation production schedule would look as compared to the methodology the model uses.
Conceptually, the model considers the product produced on the same line in series. However, in the model developed for the Long Range Planning Model all of the losses are considered first when examining the capacity in equivalent units of a single product and then that product's utilization of the rest of the capacity can be assessed as a percentage of remaining capacity for each year based on demand. This process is repeated for all products produced in this process. If the sum of all of the percentages of remaining capacity is greater than 100%, there is a production
deficit. If the sum of percentages is less than 100%, there is a production surplus. Both deficits and surpluses can be expressed in terms of any of the products on that process. In the process isolation methodology, if all of the products have the same bottleneck the result is the same as the step isolation method.
Figure 7: Process Isolation Methodology
Production Schedule Conceptual Model Approach Actual Model Approach
Production: Product Start up: Product Changeover: """
3.2.2.2 Step Isolation
Step isolation for multi-product facilities occurs when the production process contains sufficient controls so that production of multiple products can exist in the same production process at the
same time, but are limited to different steps of the process. For the initial consideration of this case, no stockpiles of intermediate inventory stores will be held from previous or for subsequent campaigns of each product, therefore, all of the available material for the product in process must be completed before processing the next product on each step. It is also assumed that each step