HAL Id: hal-00302093
https://hal.archives-ouvertes.fr/hal-00302093
Submitted on 1 Sep 2006HAL is a multi-disciplinary open access
archive for the deposit and dissemination of sci-entific research documents, whether they are pub-lished or not. The documents may come from teaching and research institutions in France or abroad, or from public or private research centers.
L’archive ouverte pluridisciplinaire HAL, est destinée au dépôt et à la diffusion de documents scientifiques de niveau recherche, publiés ou non, émanant des établissements d’enseignement et de recherche français ou étrangers, des laboratoires publics ou privés.
Comparisons between ground-based FTIR and MIPAS
N2O and HNO3 profiles before and after assimilation in
BASCOE
C. Vigouroux, M. de Mazière, Q. Errera, E. Mahieu, P. Duchatelet, S. Wood,
D. Smale, S. Mikuteit, T. Blumenstock, F. Hase, et al.
To cite this version:
C. Vigouroux, M. de Mazière, Q. Errera, E. Mahieu, P. Duchatelet, et al.. Comparisons between ground-based FTIR and MIPAS N2O and HNO3 profiles before and after assimilation in BASCOE. Atmospheric Chemistry and Physics Discussions, European Geosciences Union, 2006, 6 (5), pp.8335-8382. �hal-00302093�
ACPD
6, 8335–8382, 2006
Comparisons between g-b FTIR and
MIPAS N2O and HNO3
C. Vigouroux et al. Title Page Abstract Introduction Conclusions References Tables Figures J I J I Back Close Full Screen / Esc
Printer-friendly Version Interactive Discussion Atmos. Chem. Phys. Discuss., 6, 8335–8382, 2006
www.atmos-chem-phys-discuss.net/6/8335/2006/ © Author(s) 2006. This work is licensed
under a Creative Commons License.
Atmospheric Chemistry and Physics Discussions
Comparisons between ground-based
FTIR and MIPAS N
2
O and HNO
3
profiles
before and after assimilation in BASCOE
C. Vigouroux1, M. De Mazi `ere1, Q. Errera1, E. Mahieu2, P. Duchatelet2, S. Wood3, D. Smale3, S. Mikuteit4, T. Blumenstock4, F. Hase4, and N. Jones5
1
Belgian Institute for Space Aeronomy (BIRA-IASB), Brussels, Belgium
2
Institut d’Astrophysique et de G ´eophysique, University of Li `ege (ULg), Li `ege, Belgium
3
National Institute for Water and Atmospheric Research (NIWA), Lauder, Otago, New-Zealand
4
Institute of Meteorology and Climate Research (IMK), Forschungszentrum Karlsruhe and University of Karlsruhe, Karlsruhe, Germany
5
University of Wollongong, Wollongong, Australia
Received: 29 May 2006 – Accepted: 10 August 2006 – Published: 1 September 2006 Correspondence to: C. Vigouroux (Corinne.Vigouroux@bira-iasb.oma.be)
ACPD
6, 8335–8382, 2006
Comparisons between g-b FTIR and
MIPAS N2O and HNO3
C. Vigouroux et al. Title Page Abstract Introduction Conclusions References Tables Figures J I J I Back Close Full Screen / Esc
Printer-friendly Version Interactive Discussion
EGU
Abstract
Within the framework of the Network for Detection of Atmospheric Composition Change (NDACC), regular ground-based Fourier transform infrared (FTIR) measurements of many species are performed at several locations. Inversion schemes provide vertical profile information and characterization of the retrieved products which are therefore 5
relevant for contributing to the validation of MIPAS profiles in the stratosphere and upper troposphere. We have focused on the species HNO3 and N2O at 5 NDACC-sites distributed in both hemispheres, i.e., Jungfraujoch (46.5◦N) and Kiruna (68◦N) for the northern hemisphere, and Wollongong (34◦S), Lauder (45◦S) and Arrival Heights (78◦S) for the southern hemisphere. These ground-based data have been compared 10
with MIPAS offline profiles (v4.61) for the year 2003, collocated within 1000 km around the stations, in the lower to middle stratosphere. To get around the spatial collocation problem, comparisons have also been made between the same ground-based FTIR data and the corresponding profiles resulting from the stratospheric 4D-VAR data as-similation system BASCOE. This paper discusses the results of the comparisons and 15
the usefullness of using BASCOE profiles as proxies for MIPAS data. It shows good agreement between MIPAS and FTIR N2O partial columns: the biases are below 5% for all the stations and the standard deviations are below 7% for the three mid-latitude stations, and below 10% for the high latitude ones. The comparisons with BASCOE partial columns give standard deviations below 4% for the mid-latitude stations to less 20
than 8% for the high-latitude ones. After making some corrections to take into account the known bias due to the use of different spectroscopic parameters, the comparisons of HNO3 partial columns show biases below 3% and standard deviations below 15% for all the stations except Arrival Heights (bias of 6%, standard deviation of 21%). The results for this species, which has a larger spatial variability, highlight the necessity 25
of defining appropriate collocation criteria and of accounting for the spread of the ob-served airmasses. BASCOE appears to have more deficiencies in producing proxies of MIPAS HNO3profiles compared to N2O, but the obtained standard deviation of less
ACPD
6, 8335–8382, 2006
Comparisons between g-b FTIR and
MIPAS N2O and HNO3
C. Vigouroux et al. Title Page Abstract Introduction Conclusions References Tables Figures J I J I Back Close Full Screen / Esc
Printer-friendly Version Interactive Discussion than 10% between BASCOE and FTIR is reasonable. Similar results on profiles
com-parisons are also shown in the paper, in addition to partial column ones.
1 Introduction
MIPAS, Michelson Interferometer for Passive Atmospheric Sounding1(Fischer and Oel-haf, 1996;ESA,2000), is one of the 10 instruments on board the European satellite 5
ENVISAT which was launched into a sun-synchronous polar orbit at 800 km altitude, on 1 March 2002. This Fourier transform spectrometer operates in the mid infrared (4.15– 14.6 µm or 685–2410 cm−1) and measures high-resolution (better than 0.035 cm−1) ra-diance spectra at the Earth’s limb. It provides day and night vertical profiles of a large number of atmospheric species with a complete global coverage of the Earth obtained 10
in 3 days.
Part of the validation of the MIPAS Level 2 products is performed within the EN-VISAT Stratospheric Aircraft and Balloon Campaigns (ESABC) or by comparisons with data from other limb sounding instruments such as HALOE ( the HALogen Occultation Experiment on UARS, the Upper Atmosphere Research Satellite2). Additional inde-15
pendent measurements for the validation of MIPAS are perfomed by the ground-based Fourier transform infrared (FTIR) solar absorption spectrometers, like those operated in the framework of the Network for the Detection of Atmospheric Composition Change (NDACC3, formerly called NDSC, Network for the Detection of Stratospheric Change). The implementation of the Optimal Estimation Method, described inRodgers(2000), 20
in the inversion schemes of the ground-based FTIR spectra allows the retrieval of low resolution vertical profile information (in addition to the standard total column amounts), and the characterization of the retrieved products. When it comes to verifying the
MI-1 http://envisat.esa.int/instruments/mipas/ 2 http://haloedata.larc.nasa.gov/home/ 3 http://www.ndacc.org/
ACPD
6, 8335–8382, 2006
Comparisons between g-b FTIR and
MIPAS N2O and HNO3
C. Vigouroux et al. Title Page Abstract Introduction Conclusions References Tables Figures J I J I Back Close Full Screen / Esc
Printer-friendly Version Interactive Discussion
EGU PAS profiles at their full vertical resolution, the FTIR data cannot compete with the high
vertical resolution measurements coming from balloon, aircraft or limb sounding satel-lite experiments. The particular benefit of using ground-based FTIR data lies in the fact that these measurements are performed regularly under clear-sky conditions, at many stations distributed over the globe, and thus represent a very interesting comple-5
mentary dataset for performing a statistically sound validation, and for monitoring the quality of the MIPAS products on the longer term. These ground-based FTIR data are therefore useful for contributing to the validation of MIPAS profiles in the stratosphere and upper troposphere.
Some preliminary results of MIPAS validation by balloon, aircraft, satellite and 10
ground-based measurements have been presented in the second workshop on At-mospheric Chemistry Validation of Envisat (ACVE-2) in May 2004 for all the MIPAS ESA Level 2 products, that are the vertical profiles of: temperature (Blom et al.,2004; Fricke et al.,2004;Dethof et al.,2004), H2O (Oelhaf et al.,2004a;Pappalardo et al., 2004; Weber et al., 2004), NO2 (Wetzel et al., 2004), O3 (Cortesi et al., 2004; Blu-15
menstock et al.,2004a;Kerridge et al.,2004), CH4 (Camy-Peyret et al.,2004a), N2O (Camy-Peyret et al.,2004b), and HNO3(Oelhaf et al.,2004b). Some results on MIPAS data assimilation was also shown for H2O (Lahoz et al.,2004) and O3(Fonteyn et al., 2004). In the present study, we focus on a more advanced validation of the MIPAS ESA products for the year 2003, for N2O and HNO3, a tropospheric species and a 20
stratospheric species respectively, for which the FTIR technique is the only available ground-based source of data. Five NDACC stations are involved in this work: Kiruna (67.8◦N, 20.4◦E, altitude 420 m a.s.l.) and Jungfraujoch (46.5◦N, 8.0◦E, 3580 m a.s.l.) in the northern hemisphere, and Wollongong (34.4◦S, 150.9◦E, 30 m a.s.l.), Lauder (45.0◦S, 169.7◦E, 370 m a.s.l.), and Arrival Heights (77.8◦S, 166.7◦E, 200 m a.s.l.) in 25
the southern hemisphere.
This paper describes in Sect. 2 the MIPAS ESA Level 2 products and, in Sect. 3, the ground-based FTIR vertical profile data, including the retrieval strategies used at each station and the characterization of the data products. BASCOE, a 4D-VAR
chem-ACPD
6, 8335–8382, 2006
Comparisons between g-b FTIR and
MIPAS N2O and HNO3
C. Vigouroux et al. Title Page Abstract Introduction Conclusions References Tables Figures J I J I Back Close Full Screen / Esc
Printer-friendly Version Interactive Discussion ical data assimilation system, is briefly described in Sect. 4. In subsequent section,
we explain the adopted methodology for the comparisons for which two approaches have been used. First, we have made the comparisons with the MIPAS offline profiles (v4.61) provided by ESA, taking care to define reasonable collocation criteria that give enough coincidences to obtain relevant statistics. Then, to improve the collocations 5
without decreasing the number of coincidences, we have compared the ground-based FTIR profiles with the products of BASCOE. In the current configuration, BASCOE is constrained with MIPAS data and thus delivers atmospheric profiles that can be con-sidered to be proxies of the MIPAS profiles, at any location and any time. In the last part (Sect. 6), we show the results obtained from the comparisons for both molecules, 10
N2O and HNO3, at the different stations, and try to answer the following two questions: (1) can we quantify the agreement between the MIPAS and the ground-based FTIR data, and (2), what are the benefits of using the results of a data assimilation system as proxies of MIPAS profiles instead of the MIPAS profiles themselves?
2 MIPAS data
15
The MIPAS Level 2 products are described in the MIPAS Product Handbook4. The MIPAS offline data used here were provided by the ESA v4.61 data processor (ESA, 2004). They include the N2O and HNO3 volume mixing ratio (vmr) profiles as well as the atmospheric pressure and temperature vertical distributions. The vertical resolu-tion of the delivered profiles is between 3 and 4 km and their horizontal resoluresolu-tion is 20
between 300 and 500 km along track.
MIPAS data are valid over variable altitude ranges. We observed that, for the scans used in the present study, the upper limits are quite constant for all profiles and are around 61 km for N2O and 43 km for HNO3. The lower limits vary a lot between a minimum of 6 km for N2O and 8 km for HNO3 to greater than 20 km for worst cases. 25
4
ACPD
6, 8335–8382, 2006
Comparisons between g-b FTIR and
MIPAS N2O and HNO3
C. Vigouroux et al. Title Page Abstract Introduction Conclusions References Tables Figures J I J I Back Close Full Screen / Esc
Printer-friendly Version Interactive Discussion
EGU For the comparisons between ground-based FTIR and MIPAS measurements, we have
rejected MIPAS scans that have a lower limit greater than 12 km for N2O and 14 km for HNO3. Because of possible uncertainties in the referencing of the MIPAS profiles versus altitude (Fricke et al.,2004), we have adopted a vertical pressure grid for making the comparisons. The FTIR data are reported on an altitude grid, specific of the station. 5
Daily pressure data from each station have been used to convert the altitude grid to a unique pressure grid. The MIPAS retrieved profiles were interpolated onto the same pressure grid. Beyond the limits of MIPAS measurements, the MIPAS profiles are extrapolated using the MIPAS initial guess profiles.
3 Ground-based FTIR data
10
3.1 Retrieval algorithms
Vertical profile informations can be obtained from high-resolution FTIR solar occulta-tion spectra thanks to the pressure broadening of the absorpocculta-tion lines which leads to an altitude dependence of the lineshapes. Two different algorithms have been used in the present work, SFIT2 and PROFFIT9. Both codes are based on a semi-empirical 15
implementation of the Optimal Estimation Method developed byRodgers (2000) and provide the retrieval of molecular vertical profiles by fitting one or more narrow spec-tral intervals (microwindows). The SFIT2 algorithm has been described in previous works (Pougatchev et al.,1995a,b; Rinsland et al.,1998). It was used for the spec-tral inversion of the FTIR data at all stations except Kiruna. The profiles of this latter 20
station have been retrieved using the PROFFIT9 algorithm (Hase,2000). It has been shown recently (Hase et al.,2004) that the retrieved profiles and total column amounts obtained by these two different algorithms under identical conditions are in excellent agreement (within 1% for total column amounts of N2O and HNO3).
In both codes SFIT2 and PROFFIT9, the retrieved state vector contains the retrieved 25
ACPD
6, 8335–8382, 2006
Comparisons between g-b FTIR and
MIPAS N2O and HNO3
C. Vigouroux et al. Title Page Abstract Introduction Conclusions References Tables Figures J I J I Back Close Full Screen / Esc
Printer-friendly Version Interactive Discussion well as the retrieved scaling factors for the interfering species column amounts, and
fitted values for some model parameters. These can include the baseline slope and instrumental lineshape parameters such as an effective apodization. For the stations Jungfraujoch, Wollongong, Lauder and Arrival Heights, the atmosphere is divided in 29 layers, whereas for Kiruna it is divided in 44 layers. The 29 layers have a width of 5
2 km below 50 km, becoming progressively larger towards the top of the atmosphere, defined here as 100 km. The widths of the 44 layers of Kiruna progressively grow from 0.4 km at the ground to 2.3 km around 50 km altitude.
3.2 Retrieval parameters
3.2.1 Spectroscopic data and spectral windows 10
All stations are using the spectroscopic line parameters from the HITRAN 2000 database including official updates through 2001 (Rothman,2003). Wollongong added official updates up to August 2002 and additional lines from the Spectroscopic Atlas of Atmospheric Microwindows in the Middle Infra-Red (2nd edition) (Meier et al.,2004) but these do not include changes in the parameters for N2O or HNO3, or for the six 15
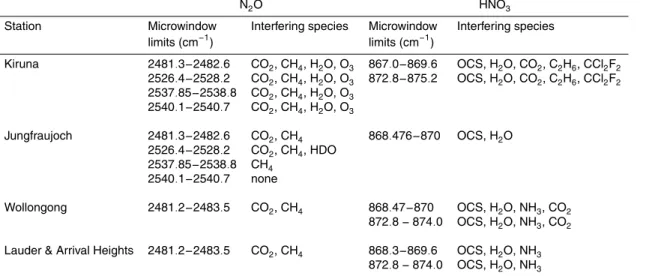
interfering species, given in Table1, that are fitted in Wollongong retrievals.
At all stations daily temperature and pressure profiles have been taken from the National Centers for Environmental Prediction (NCEP).
The retrieval microwindows used at the various stations are listed in Table1, together with the corresponding interfering species. The a priori profiles of these interfering 20
species are scaled simultaneously with the profile inversion of the target gases in the spectral fit procedure.
3.2.2 A priori information
Because the inversion problem is ill-posed, the Optimal Estimation Method needs some a priori information about the retrieval state vector parameters, including the a priori 25
ACPD
6, 8335–8382, 2006
Comparisons between g-b FTIR and
MIPAS N2O and HNO3
C. Vigouroux et al. Title Page Abstract Introduction Conclusions References Tables Figures J I J I Back Close Full Screen / Esc
Printer-friendly Version Interactive Discussion
EGU vertical vmr profile xa, and the associated a priori covariance matrix Sa (Rodgers,
2000).
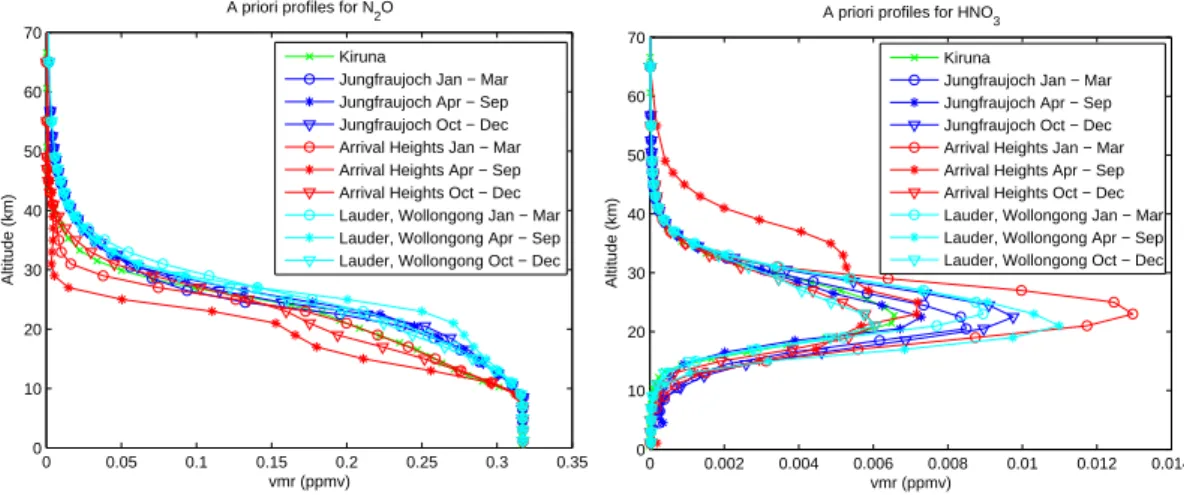
In Fig.1, we show the a priori N2O and HNO3vertical profiles used at each station. For the stations Jungfraujoch, Lauder, Arrival Heights and Wollongong, the a priori profiles have been taken identical to the climatological initial guess profiles from MIPAS 5
for the corresponding seasons and latitude bands (so-called IG2 profiles in the MIPAS Product Handbook). Three different seasonal profiles are used, representative of the periods January to March, April to September and October to December. For the Kiruna station, only one a priori profile is used for each species, namely the MIPAS IG2 profile for the April to September season corresponding to the latitude of Kiruna. For 10
HNO3at Kiruna, the MIPAS IG2 profile has been modified below 30 km because it was found more realistic to enhance the a priori amount of HNO3near the tropopause. 3.3 Characterization of the retrievals
As discussed inRodgers(2000), the Optimal Estimation Method allows the character-ization of the retrievals, i.e., the vertical resolution of the retrieval, its sensitivity to the 15
a priori information and the degrees of freedom for signal (DOFS). This is obtained by considering that the retrieved state vector xr is related to the true state vector x by:
xr = xa+ A(x − xa)+ error terms,
with xathe a priori state vector andA the matrix whose rows are called the averaging
kernels. The retrieved parameters are weighted means of the true and a priori state 20
vector parameters. The weight associated with the true state vector parameters is given by the averaging kernels matrixA which would be the identity matrix in an ideal
case where the retrieval would reproduce the truth. The actual averaging kernels matrix depends on several parameters including the solar zenith angle, the spectral resolution and signal to noise ratio, the choice of retrieval spectral microwindows, and the a priori 25
covariance matrix Sa. The elements of the averaging kernel for a given altitude give the sensitivity of the retrieved profile at that altitude to the real profile at each altitude,
ACPD
6, 8335–8382, 2006
Comparisons between g-b FTIR and
MIPAS N2O and HNO3
C. Vigouroux et al. Title Page Abstract Introduction Conclusions References Tables Figures J I J I Back Close Full Screen / Esc
Printer-friendly Version Interactive Discussion and its full width at half maximum is a measure of the vertical resolution of the retrieval
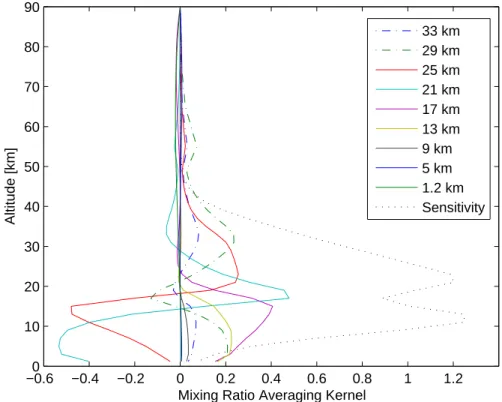
at that altitude. Figures 2and 3 show the mean averaging kernels for N2O at Arrival Heights and for HNO3at Lauder, respectively. We see that the best vertical resolution is approximately 8 km for N2O and 10 km for HNO3.
The DOFS of the ground-based retrievals are given by the trace of the averaging 5
kernel matrixA. Thus, they depend on the parameters given previously, which can be
different for each station and each spectrum. We have calculated, for each station, their mean value for the data used in this study. We list them for both molecules in Table2: for HNO3they vary from 1.9 at the Jungfraujoch station to 2.8 at Lauder, whereas for N2O they vary from 4.3 at the Jungfraujoch, thanks to the highest altitude of this station, 10
to 3.5 at Wollongong.
On top of the kernels plotted in Figs.2and3, we have added the so-called “sensitiv-ity” of the retrievals at each altitude to the measurements. This sensitivity at altitude k is calculated as the sum of the elements of the corresponding averaging kernel,P
iAki.
It indicates, at each altitude, the fraction of the retrieval that comes from the measure-15
ment rather than from the a priori information. A value larger than one means that the retrieved profile at that altitude is over-sensitive to changes in the real profile. It may be compensating for poor sensitivity to the true profile at other altitudes when the averag-ing kernels do not allow the separation of the altitude ranges correctly. A value close to zero at a certain altitude indicates that the retrieved profile at that altitude is nearly 20
independent of the real profile and is therefore approaching the a priori profile. In other words, the measurements have not significantly contributed to the retrieved profile at that altitude.
Figure2shows that the ground-based FTIR measurements of N2O at Arrival Heights have a sensitivity larger than 0.5 from the ground to about 30 km altitude. For the 25
HNO3retrievals at Lauder, the measurements have the largest sensitivity between 10 and 35 km, as shown in Fig.3. The altitude range with better sensitivity does not only depend on the species considered, but it is also different at the various stations in agreement with the different degrees of freedom given in Table2.
ACPD
6, 8335–8382, 2006
Comparisons between g-b FTIR and
MIPAS N2O and HNO3
C. Vigouroux et al. Title Page Abstract Introduction Conclusions References Tables Figures J I J I Back Close Full Screen / Esc
Printer-friendly Version Interactive Discussion
EGU For making relevant comparisons between the ground-based and satellite data, we
focus on the altitude ranges in which the sensitivity of the retrieved profiles to the measurements is sufficiently high. As we intend to compare partial column amounts in addition to the profile comparisons, we have adopted a strict criterion to define the altitude boundaries of these partial columns: the sensitivity, as defined above, must be 5
larger than 0.5, which means that the retrieved profile information comes for more than 50% from the measurement, or, in other words, that the a priori information influences the retrieval for less than 50%. We have added in Table 2 these vertical ranges for each molecule at each station.
4 BASCOE analyses
10
BASCOE (Belgian Assimilation System of Chemichal Observations from ENVISAT5) is a 4D-VAR data assimilation system derived from that described inErrera and Fonteyn (2001). This system is based on a 3-D chemical transport model driven by operational ECMWF analysis (Chabrillat et al., 20066 and Daerden et al., 20067). MIPAS v4.61 observations of H2O, NO2, O3, CH4, N2O, and HNO3 have been assimilated for the 15
year 2003. BASCOE ozone analyses have already been validated by Geer et al. (2006) who made intercomparisons of ozone analyses from different assimilation systems, including BASCOE.
The model calculates the evolution of 57 chemical species taking into account the advection, the chemistry and the PSC microphysics. Two configurations of BASCOE 20
are possible (Chabrillat et al., 20066): one with full PSC microphysics and another one
5
http://bascoe.oma.be/
6
Chabrillat, S. H., Van Roozendael, M., Daerden, F., et al.: Quantitative assessment of 3-D PSC-chemistry-transport models by simulation of GOME observations during the Antarctic winter of 2002, Atmos. Chem. Phys. Discuss., in preparation, 2006.
7
Daerden, F., Larsen, N., Bonjean, S., et al.: Synoptic PSCs in recent polar winters: simula-tions and comparison to observasimula-tions, Atmos. Chem. Phys. Discuss., submitted, 2006.
ACPD
6, 8335–8382, 2006
Comparisons between g-b FTIR and
MIPAS N2O and HNO3
C. Vigouroux et al. Title Page Abstract Introduction Conclusions References Tables Figures J I J I Back Close Full Screen / Esc
Printer-friendly Version Interactive Discussion with PSC parameterization. This study uses BASCOE analyses obtained by the
sec-ond configuration. The model extends from the surface up to 0.1 hPa using 37 levels with a horizontal resolution of 5◦ in longitude and 3.75◦ in latitude. Data assimilation is done using 4D-VAR with an assimilation window of one day. The background error standard deviation is set to 20% of the background field. Correlations are not taken 5
into account and the background covariance matrix is therefore diagonal. Additional to the MIPAS random error, a representation error of 8.5% that takes into account the difference of resolution between BASCOE and MIPAS has been specified for each as-similated observation (M ´enard et al.,2000). In order to prevent oscillating data entering into BASCOE, only values in the range [0.2, 200] hPa and [4, 200] hPa are considered 10
for N2O and HNO3, respectively (M. Ridolfi, private communication).
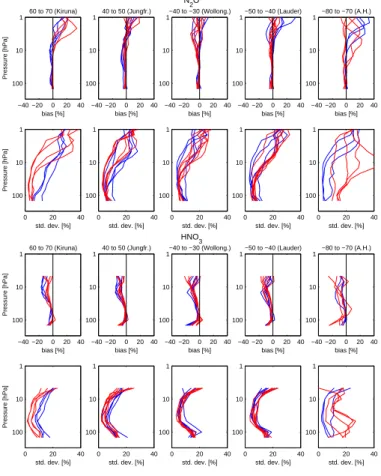
In order to evaluate how well BASCOE represents MIPAS, we plot, in Fig. 4, the monthly mean bias (<BASCOE-MIPAS>/<MIPAS>) and standard deviation (1σ) be-tween BASCOE and MIPAS profiles of N2O and HNO3in five 10◦latitude bands corre-sponding to each station. Generally, monthly mean N2O biases are lower than ±5%. 15
For some months, higher values are observed in the middle-high stratosphere: above 20 hPa around 75◦S, above 5 hPa around 35◦S and 65◦N and above 3 hPa around 45◦S and 45◦N. However, these cases occur in pressure ranges outside the limits used to compare FTIR and MIPAS, except for the Jungfraujoch station. For the latter case, one should not take into account profiles comparison with BASCOE for pressures 20
above 3 hPa. The effect on the comparison of partial columns of N2O above 3 hPa is negligible, since there is almost no N2O at high altitude (see Fig. 1). Standard devia-tions of monthly N2O comparisons are between 10% to 20% within the pressure limits of the comparisons between FTIR and MIPAS, except for Arrival Heights during local winter. We also observe a significant variability from month to month. Nevertheless, 25
this variability is comparable to the estimated assimilation error (random and represen-tativeness errors).
For HNO3, monthly mean biases are generally negative (BASCOE underestimates MI-PAS) and vary with altitude, latitude and month. The bias is minimal, within ±5%,
ACPD
6, 8335–8382, 2006
Comparisons between g-b FTIR and
MIPAS N2O and HNO3
C. Vigouroux et al. Title Page Abstract Introduction Conclusions References Tables Figures J I J I Back Close Full Screen / Esc
Printer-friendly Version Interactive Discussion
EGU around 80 hPa in the –80 to –70◦ latitude band, and around 100 hPa in the other
lati-tude bands. The biases are largest at 150 hPa and between 10 and 20 hPa, and vary from month to month between –10% and –30% for the worst case of Arrival Heights during local winter. Regarding the standard deviation, it is minimum around 50 hPa, the altitude at which the HNO3mixing ratio reaches its maximum. Within the pressure lim-5
its of the comparisons between FTIR and MIPAS, its value lies between 5% and 20% except at the South Pole where it can reach 25% in wintertime. Again, this variability is comparable to the estimated assimilation error.
Having the above statistics in mind, we can evaluate to which extent BASCOE is a proxy of MIPAS. In the case of N2O, we can say that BASCOE is a good proxy of 10
MIPAS, because the bias between both is negligible. However, it is clear that BASCOE HNO3 cannot be considered as a good absolute proxy of MIPAS because of the fact that BASCOE underestimates MIPAS HNO3. This must be kept in mind when BAS-COE will be compared to ground-based FTIR. The origin of this bias has not yet been clearly identified but one possible explanation is the following. In the assimilation sys-15
tem, observations of species will influence initial concentrations of other constituents if they are coupled in the chemical scheme. The fact that HNO3 observations are as-similated together with other species, in particular O3and NO2, and the possibility that MIPAS observations of these three species do not agree with the chemical equilibrium conditions in BASCOE, could explain the HNO3bias.
20
5 Comparison methodologies
5.1 Degradation of the MIPAS and BASCOE profiles to the ground-based FTIR reso-lution
When making intercomparisons of remote sounders having different vertical resolu-tions, one can use the method given by Rodgers and Connor (2003) to account for 25
ACPD
6, 8335–8382, 2006
Comparisons between g-b FTIR and
MIPAS N2O and HNO3
C. Vigouroux et al. Title Page Abstract Introduction Conclusions References Tables Figures J I J I Back Close Full Screen / Esc
Printer-friendly Version Interactive Discussion higher than that of the ground-based FTIR data. Therefore the MIPAS profiles xm are
considered to be ideal profiles compared to ground-based FTIR ones, and the aver-aging kernel matrix of MIPAS retrievals is approximated by the identity matrix. Before comparing MIPAS profiles to the ground-based ones, we smoothed them according to the characteristics of the ground-based data, following:
5
xs= xa+ A(xm− xa), (1)
in whichxs are the smoothed MIPAS profiles and xaandA are the a priori profile and
the averaging kernel matrix of the ground-based FTIR retrievals, respectively. The same degradation is made for the BASCOE profiles.
Having adopted this approach, the smoothing error must no longer be accounted for 10
in the uncertainties that are to be considered in the comparison results.
From here onwards, we will use the terms MIPAS and BASCOE profiles for the smoothed profiles. The partial columns amounts that are discussed in the paper have been calculated from the smoothed profiles.
5.2 Statistical sets of comparisons 15
The four statistics defined hereinafter will be described by the mean value of the dif-ferences (the “bias”) between MIPAS and FTIR and their standard deviation (1σ) (the “scatter”), in percent. To do so, we divide the mean value and the standard deviation of the absolute differences of partial columns and profiles by the mean of the FTIR par-tial columns and profiles, respectively. The mean value and standard deviation of our 20
statistics are thus referring to [<MIPAS-FTIR>±1σ]/<FTIR> in the tables and figures of Sect. 6. The scatter will be compared to the estimated random error on the di ffer-ences to discuss the agreement between both instruments. A bias between MIPAS and FTIR will be called “statistically significant” if the mean <MIPAS-FTIR> is larger than the error on that mean, i.e., larger than 3 ∗ σ/√N, with N the number of coincidences.
ACPD
6, 8335–8382, 2006
Comparisons between g-b FTIR and
MIPAS N2O and HNO3
C. Vigouroux et al. Title Page Abstract Introduction Conclusions References Tables Figures J I J I Back Close Full Screen / Esc
Printer-friendly Version Interactive Discussion
EGU 5.2.1 Comparisons between MIPAS and ground-based profiles for two different
collo-cation criteria
In order to obtain a statistically significant set of comparisons between the MIPAS and ground-based data, we have chosen spatial collocation circles of 1000 km radius around each of the ground-based stations. As the MIPAS tangent point can move 5
by more than 200 km in the horizontal direction during one scan, the criterion is applied such that at least one tangent point of the scan must lie within the collocation circle. The requirement on temporal coincidence is that the recording time difference between the MIPAS and FTIR profile is smaller than 3 h. Each individual MIPAS profile is compared to the mean of the FTIR profiles that are within ±3 h from the MIPAS 10
measurement time. It is justified to take the mean of the ground-based measurements as the concentrations of N2O and HNO3 are not expected to change in such a short lapse of time. Anyway, when the standard deviation of the FTIR data set within these 6 h periods is larger than the estimated random error of the FTIR measurements, we reject that coincidence from our comparison data set. We do not take the mean of the 15
MIPAS scans because their spatial locations and the quality of the profiles can be very different. We have not applied any additional coincidence criterion as to the potential vorticity of the air masses. This leads to larger scatter in the comparisons at the two high latitude stations as will be seen in Sect.6. This set of comparisons will be called “Statistics 1” in the paper.
20
To evaluate the impact of the collocation criterion, we will also show the results of comparisons of partial columns for a collocation of 400 km radius, with the additional requirement that all tangent points of the scan must be within the 400 km radius (“Statis-tics 2”). The same temporal criterion of ±3 h is used in “Statis(“Statis-tics 2”.
25
The latter collocation choice leads to very poor statistics. To get around the problem of collocation, we have introduced the use of profiles obtained by the 4D-VAR data assimilation system BASCOE which can be seen as proxies of MIPAS profiles, for the
ACPD
6, 8335–8382, 2006
Comparisons between g-b FTIR and
MIPAS N2O and HNO3
C. Vigouroux et al. Title Page Abstract Introduction Conclusions References Tables Figures J I J I Back Close Full Screen / Esc
Printer-friendly Version Interactive Discussion species, altitude ranges and periods discussed in Sect.4.
5.2.2 Two sets of comparisons using the 4D-VAR data assimilation system BASCOE For the purpose of this work, BASCOE analyses have delivered vertical profiles of N2O and HNO3, at the location of each station, four times a day, namely at 00:00 h, 06:00 h, 12:00 h and 18:00 h UT. The comparisons between the ground-based FTIR and BAS-5
COE data are divided in two sets. “Statistics 3” compares the means of the FTIR data sets involved in “Statistics 1”, not with the collocated MIPAS profiles themselves, but with the BASCOE profiles at the location of the station that are closest in time.
To enlarge the statistics for the comparisons, we also compare the BASCOE profiles with the means of the ground-based FTIR data that are available within the six hours 10
time ranges centered around the times of the BASCOE profiles, even if no correla-tive MIPAS measurements are available in these periods. This set of comparisons is referred to hereafter as “Statistics 4”.
5.3 Evaluation of data uncertainties
We have evaluated the random error covariance matrix on the difference MIPAS-FTIR 15
using the work ofRodgers and Connor(2003) for the intercomparison of remote sound-ing instruments, and ofCalisesi et al.(2005) for the regridding between the MIPAS and the FTIR data. As seen before, MIPAS profiles have a much higher vertical resolu-tion than ground-based FTIR profiles, so the random error covariance matrix of the comparison MIPAS-FTIR,Sδ
12 in Eq. (22) ofCalisesi et al.(2005), becomes simply:
20 Sδ 12 = Sx1+ AW12Sx2W T 12A T. (2) HereinSx
1 is the random error covariance matrix of the ground-based FTIR retrieved
profile x1,A is the FTIR averaging kernel matrix specified on the FTIR retrieval grid,
andSx
ACPD
6, 8335–8382, 2006
Comparisons between g-b FTIR and
MIPAS N2O and HNO3
C. Vigouroux et al. Title Page Abstract Introduction Conclusions References Tables Figures J I J I Back Close Full Screen / Esc
Printer-friendly Version Interactive Discussion
EGU MIPAS retrieval grid. W12 is a grid transformation matrix, defined by:
W12 = W?1W2, (3)
withW1andW2the transformation matrices of the FTIR and MIPAS retrieval products
x1and x2to the equivalent retrieval products y1and y2, respectively, on the same fine grid:
5
y2= bf W2x2 (4)
x1= W?1y1. (5)
W?1is the generalized pseudo-inverse ofW1. The random error matrix Sx
1 for the ground-based FTIR data has been evaluated
for a typical measurement at Kiruna with a solar zenith angle of 70◦ (F. Hase, private 10
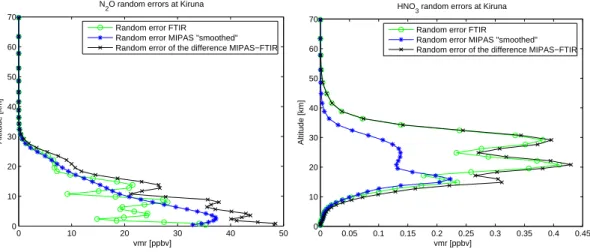
communication). For N2O, the random error matrix is dominated by the contributions from the baseline error, as well as the temperature profile uncertainties. For HNO3, the spectral noise is also a dominant error source. Figure5shows the square-root of the variances ofSx
1 for the FTIR N2O and HNO3retrievals at the Kiruna station.
The ESA MIPAS products include individual error covariance matrices with each 15
profile: they represent the errors due to the noise. As only a typical value is used for the ground-based FTIR uncertainty, we have taken for the MIPAS error covariance matrix due to noise,Sn, the mean of the matrices corresponding to all the MIPAS scans collocated within 1000 km around the stations.
An analysis of the various other sources of error of the MIPAS retrievals has been 20
made by the Atmospheric, Oceanic and Planetary Physics (AOPP) research team at Oxford University8. The systematic errors given by AOPP are typical ones for large latitude bands. These errors are given in percent in an altitude grid, and it is assumed that there are no correlations between errors, i.e., each systematic error covariance matrix is diagonal. The systematic errors are divided into two parts: purely system-25
atic errors and systematic errors with random variability. For the discussion about the
8
ACPD
6, 8335–8382, 2006
Comparisons between g-b FTIR and
MIPAS N2O and HNO3
C. Vigouroux et al. Title Page Abstract Introduction Conclusions References Tables Figures J I J I Back Close Full Screen / Esc
Printer-friendly Version Interactive Discussion scatter of the comparisons, we are interested only in the random error sources (noise
and systematic errors with random variability, namely: propagation of temperature ran-dom error on the retrievals, horizontal gradient effects, uncertainties on the profiles of interfering species and on the high-altitude column). Hereinafter, we’ll designate this random error by the short term “uncertainty”. The total error covariance matrix due 5
to all systematic error sources with random variability,Ssyst rand, has been calculated as the mean of the set of individual matrices in vmr units, obtained from the multi-plication of the typical matrix in percentage with the individual MIPAS profile for each coincidence case.
Then the contribution of the MIPAS uncertainties to the combined random error co-10
variance matrixSδ
12 in Eq. (2) is simply: Sx2=Sn+Ssyst rand.
Figure5shows the square-root of the variances of the smoothed MIPAS profile un-certainty matrixSx
2 for the N2O and HNO3retrievals obtained around the Kiruna
sta-tion, together with the square-root of the variances ofSx
1 andSδ12 for the FTIR profile
and for the absolute difference MIPAS-FTIR, respectively. 15
In the next section, the random error on the difference between MIPAS and FTIR profiles, i.e., the square-root of the variances ofSδ
12, will be represented by the shaded
areas around the statistical means of the MIPAS-FTIR difference profiles, in Figs.8and 11. As we have decided to show relative differences, the absolute errors have been divided by the mean of the FTIR profiles.
20
From the error covariance matrix of the difference MIPAS-FTIR, we have calculated the error ∆δ
P C associated with the difference of partial columns. This calculation is
made according to: ∆δP C = g
TS
δ12g, (6)
in which g is the operator that transforms the volume mixing ratio profile in a partial 25
column amount, between the boundaries that have been defined earlier (Sects. 3.3 and4; see also Tables3and5).
Since we discuss the results of the statistical evaluations in percentage values, in Tables 3 and 5, we calculate the relative error on the partial column differences by
ACPD
6, 8335–8382, 2006
Comparisons between g-b FTIR and
MIPAS N2O and HNO3
C. Vigouroux et al. Title Page Abstract Introduction Conclusions References Tables Figures J I J I Back Close Full Screen / Esc
Printer-friendly Version Interactive Discussion
EGU dividing the absolute error (Eq.6) by the mean of the FTIR partial columns. This relative
random error on the difference between MIPAS and FTIR partial columns is given in Tables3 and 5, and will be compared to the standard deviations of the comparisons statistics to verify whether both instruments are in agreement. This is the subject of the next section.
5
6 Results of the intercomparisons
6.1 Results for N2O
6.1.1 Comparisons of the partial columns of N2O
Table3 summarizes, for each station, the statistical results of the comparisons of the partial columns of N2O for the four sets described in Sect. 5.2. As seen in Sect. 2, 10
the vertical coordinate for the comparisons must be pressure rather than altitude. The pressure limits of the partial columns are included in Table3. The higher pressure limit corresponds to about 12 km (see the discussion on MIPAS observed lower altitudes in Sect.2) and the lower pressure limit is derived from the FTIR sensitivity (see Table2). We have decided to reject the MIPAS scans that do not cover these altitude ranges, 15
the partial columns used in the statistics are therefore not contaminated by some ex-trapolations with a priori profiles. However, some scans can have one or two missing values that are replaced by interpolated values in the profiles.
Table 3 shows that there is a good agreement between MIPAS and ground-based FTIR partial columns even with the less constrained collocation criteria (“Statistics 1”). 20
For Kiruna, Jungfraujoch and Lauder, there is no statistically significant bias between the two instruments considering the means and their error (about 2%, calculated as explained in Sect. 5) for “Statistics 1”. A small positive bias of 4±2% is obtained at Wollongong, and a negative one of –5±2% at Arrival Heights. The random errors of the relative differences of partial columns, estimated as seen in Sect.5.3, are about 6 25
ACPD
6, 8335–8382, 2006
Comparisons between g-b FTIR and
MIPAS N2O and HNO3
C. Vigouroux et al. Title Page Abstract Introduction Conclusions References Tables Figures J I J I Back Close Full Screen / Esc
Printer-friendly Version Interactive Discussion or 7% as indicated in the table. Agreement between both instruments should give a
standard deviation of the statistics similar to the estimated random errors. One expects that the remaining discrepancies of a few percent between the two instruments are due to spatial collocation criteria that are too wide. “Statistics 2”, made with a reduced collocation criterion of 400 km, have indeed lower standard deviations for the three 5
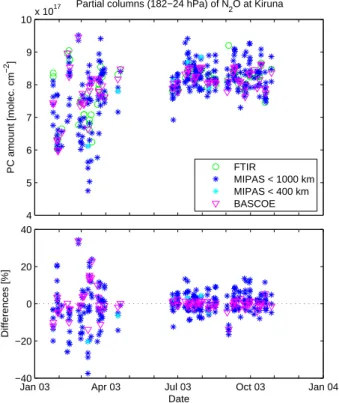
stations where the number of coincidences remains statistically significant (≥10). The reason why the standard deviation of the statistics is not reduced at the Kiruna station by using a stricter collocation criteria can be understood from the timeseries of the partial columns of N2O in this particular case, as shown in Fig. 6. We see that the variation of the N2O abundances is much higher during the winter-spring period 10
(January to end of March), probably related to subsidence in polar vortex conditions. Thus, the higher standard deviation of 9% at Kiruna for “Statistics 1” is due to the higher variability of N2O in time and space, making the collocation criterion less adequate for selecting comparable quantities. The standard deviation remains high (9%) even if the spatial collocation is set to 400 km, probably because in spring even a collocation 15
of 400 km is not sufficient to take into account the N2O spatial variability during this period. We can however not conclude because of the bad statistical conditions (only six coincidences, two of them occuring in spring).
At the Wollongong station also, “Statistics 2” suffers from a very small number of coincidences, in which essentially one out of the four MIPAS scans in coincidence, in 20
early March, is causing the large value of the standard deviation (10%). Eliminating this point reduces the bias and the standard deviation to 4±3%.
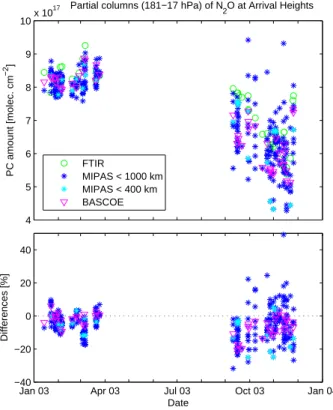
A similar problem to Kiruna is encountered at the Arrival Heights station as seen in Fig.7, with a high variability of N2O in local spring (September to end of November), thus giving rise to standard deviations of “Statistics 1” and “2” (10% and 9%, respec-25
tively) that are high compared to the random error of 6%. To confirm this interpretation, the statistics of the comparisons (relative differences between FTIR and MIPAS par-tial column values) at Kiruna and Arrival Heights, limited to the local summer-autumn period, are given in Table4. They show values for the standard deviations that are in
ACPD
6, 8335–8382, 2006
Comparisons between g-b FTIR and
MIPAS N2O and HNO3
C. Vigouroux et al. Title Page Abstract Introduction Conclusions References Tables Figures J I J I Back Close Full Screen / Esc
Printer-friendly Version Interactive Discussion
EGU agreement with the expected uncertainty for the relative differences, and that decrease
from “Statistics 1” to “Statistics 2”.
As said before, for the purpose of evaluating the impact of the collocation criteria on the comparison results, we have also compared the FTIR data with correlative data from BASCOE analyses, i.e., BASCOE analyses interpolated at the location of the 5
ground stations as proxies for perfectly collocated MIPAS measurements, in “Statis-tics 3” and “4”. A comparison in Table 3 of the results for “Statistics 1” to those for “Statistics 3”, which include identical sets of FTIR measurements, shows lower stan-dard deviations in the latter case, especially for the three mid-latitudes stations. A similar reduction in the standard deviations is observed in Table4for the two high lati-10
tude stations, Kiruna and Arrival Heights, when the reduced time period is considered. One also notices very small differences between the results (means and standard devi-ations) of “Statistics 3” and “Statistics 4” where BASCOE products are used even when there are no MIPAS observations that satisfy the temporal and spatial collocation cri-teria with the FTIR measurements. These results confirm that BASCOE products can 15
be used reliably as proxies of MIPAS observations at any time within the considered periods.
Still, in the winter-spring periods at high latitudes, where the spatial (and temporal) variability of the N2O partial column abundances is high, it appears that BASCOE, with its resolution of 5◦ in longitude and 3.75◦ in latitude, has more difficulties to correctly 20
capture this variability: the standard deviations of “Statistics 3” or “4” do not go down to the level of the random uncertainty (except “Statistics 3” for Arrival Heights). This is in agreement with Fig. 4which shows that the standard deviations of the statistics comparing BASCOE and MIPAS are larger for the months January to March at Kiruna, and September to November for Arrival Heights.
25
One could also notice that the comparisons of BASCOE and FTIR show a significant bias only for Arrival Heights, when the whole period January to December 2003 is considered.
ACPD
6, 8335–8382, 2006
Comparisons between g-b FTIR and
MIPAS N2O and HNO3
C. Vigouroux et al. Title Page Abstract Introduction Conclusions References Tables Figures J I J I Back Close Full Screen / Esc
Printer-friendly Version Interactive Discussion the statistical standard deviations of the observed partial column differences can be
slightly smaller than the estimated random uncertainties associated with them. This could lead to the conclusion that the uncertainty estimates for the FTIR profiles are conservative. However, we’ll see in the profile comparisons in the next section that the ratio between the statistical standard deviation and the random error varies a lot with al-5
titude (Fig.8). The overestimation of the random error appears only in the troposphere and lower stratosphere where the amount of N2O is important.
6.1.2 Comparisons of the vertical profiles of N2O
Figure8shows the statistical means and associated standard deviations of the relative differences between the vertical profiles of N2O from the ground-based FTIR observa-10
tions and MIPAS v4.61 (“Statistics 1”) and BASCOE products (“Statistics 3”), at the five contributing stations.
The black horizontal bars in Fig.8indicate the pressure limits of the partial columns defined in Table 3. As stated before, the MIPAS profiles are extrapolated with the MIPAS initial guess (IG2) values outside the vertical ranges of the measurements. The 15
ground-based FTIR profiles and the smoothed MIPAS profiles tend towards the a priori profiles at altitudes where the sensitivity of the retrievals to the measurements tends to zero. This explains why the relative difference profiles and associated errors all tend to zero at high altitudes.
For Kiruna, we see in Fig.8a positive bias (below 3%) between MIPAS and FTIR at 20
low altitudes becoming negative (below 5%) for pressure smaller than 100 hPa. This behaviour is similar for both whole and reduced periods. Considering the error on the mean of the differences (not plotted here, but calculated as discussed in Sect.5), this bias is statistically significant only for pressure below 80 hPa. The same kind of shape is seen at Lauder, the higher positive bias at low altitude (below 4%) being also 25
statistically significant. At Jungfraujoch, the bias is positive (below 4%) for pressure greater than 40 hPa and become negative above (below 5%, for pressure greater than 20 hPa; below 10% above). At Wollongong, a high positive bias is observed (below 5%
ACPD
6, 8335–8382, 2006
Comparisons between g-b FTIR and
MIPAS N2O and HNO3
C. Vigouroux et al. Title Page Abstract Introduction Conclusions References Tables Figures J I J I Back Close Full Screen / Esc
Printer-friendly Version Interactive Discussion
EGU for pressure greater than 55 hPa with a maximum of 21% at 25 hPa). At Arrival Heights
a positive significant bias is seen for the whole altitude range, below 8% and 5% for the whole and reduced period, respectively. The shape of the bias look very similar for both compared data sets, MIPAS and BASCOE, confirming what has been seen in Fig.4, and showing also that they are probably not related to collocation issues, but rather to 5
the shapes of the FTIR retrievals. As the DOFS for the FTIR N2O retrievals between the considered pressure limits is between 1.3 (Kiruna) and 2.7 (for Jungfraujoch), the detailed shape of the FTIR profiles strongly depends on the retrieval settings.
As seen with the partial columns comparisons in Table3, the standard deviations of the relative differences are reduced when using collocated BASCOE products instead 10
of the correlative MIPAS data. When comparing the random error and the statistical standard deviations, one should consider that the error calculation has been made using a typical case at Kiruna where the sensitivity is below 0.5 for altitudes greater than 25 km (Table 2). We observe that the statistical standard deviations are lower than the estimated random error for pressures greater than 100 hPa (around 15.5 km), 15
in the troposphere and low stratosphere, where the N2O amount is important. 6.2 Results for HNO3
6.2.1 Comparisons of the partial columns of HNO3
Analogous to the presentation for N2O in Table3, Table5gives the statistical results, at each station, for the comparisons between FTIR and MIPAS or BASCOE HNO3partial 20
column values, according to the four statistical approaches described in Sect. 5.2. The partial column limits (in pressure units) are also included in the second column of Table5.
The first striking observation is that there exists a negative bias between the FTIR and MIPAS data, of order 11 to 19%. It has already been observed in previous work 25
(Oelhaf et al.,2004b;Blumenstock et al.,2004b) and explained by a scaling factor of 13% that was applied to the HNO3line intensities in the spectroscopic data base used
ACPD
6, 8335–8382, 2006
Comparisons between g-b FTIR and
MIPAS N2O and HNO3
C. Vigouroux et al. Title Page Abstract Introduction Conclusions References Tables Figures J I J I Back Close Full Screen / Esc
Printer-friendly Version Interactive Discussion for the MIPAS v4.61 retrievals as compared to the databases used for the
ground-based FTIR retrievals (see Sect. 3.2.1). If the same spectroscopy would have been adopted for the MIPAS and FTIR retrievals, the remaining biases, after a correction of 13%, would not have been statistically significant except for Arrival Heights. At the latter station, a positive bias of 6% would still be significant compared to the error on 5
the mean of 4%.
In the case of HNO3, the use of BASCOE analyses as proxies for the MIPAS data appears to be more problematic when one is looking at absolute concentration values. The comparisons between BASCOE and FTIR do not show the systematic bias that is observed in the direct MIPAS-FTIR comparisons, except at Wollongong. The bias be-10
tween BASCOE assimilation analyses for HNO3and the MIPAS HNO3data, discussed in Sect.4and shown in Fig.4, is clearly seen in Figs. 9and 10. Even if the products of BASCOE seem to be closer to the ground-based FTIR products, it is not possible to conclude that the MIPAS measurements of HNO3are too high. Still, BASCOE nicely reproduces the seasonal variation.
15
The second noticeable fact in Table5is that the standard deviations of all statistics are significantly larger than expected on the basis of the random uncertainties of the relative partial column differences which are only 3 or 4%. If the same spectroscopy would have been adopted for the MIPAS and FTIR retrievals, the standard deviation would decrease by a factor of 0.863. This would give, for “Statistics 4”, a standard 20
deviation of 4% in the best case of Arrival Heights limited to the January-March period, up to 10% in the worst case of Arrival Heights when the whole year 2003 is considered. This means that additional unexpected random differences appear when comparing the FTIR and MIPAS products.
The additional uncertainties can largely be explained by the uncertainties due to 25
spatial variability of HNO3. It is clearly seen in Table 5 by comparing “Statistics 1” and “2”, that a stricter collocation criterion reduces in a significant way the standard deviations. One could expect that the use of BASCOE would reduce the standard deviations to the level of the estimated random uncertainty, as observed for N2O at the
ACPD
6, 8335–8382, 2006
Comparisons between g-b FTIR and
MIPAS N2O and HNO3
C. Vigouroux et al. Title Page Abstract Introduction Conclusions References Tables Figures J I J I Back Close Full Screen / Esc
Printer-friendly Version Interactive Discussion
EGU mid-latitude stations, but this is not the case, as shown by “Statistics 3” and “4” in the
table. This means that the BASCOE resolution (5◦ in longitude and 3.75◦ in latitude) is not sufficient to reproduce the HNO3 spatial variability, as it was the case for N2O at high latitude during the period with high variability. We see in Fig.4that the standard deviations of the statistics on the differences between BASCOE and MIPAS are larger 5
during the periods of higher variability (January to March for Kiruna, and September to November for Arrival Heights).
An additional, related contribution to the observed larger standard deviations comes from the so-called horizontal smearing effect, as follows. In reality, both the MIPAS and ground-based FTIR data stem from observations that are integrated measurements 10
along their respective line-of-sights, that are oriented differently in space. Moreover, the sighted airmasses have a horizontal extension, that depends on the observation geometry and spectral characteristics, and that may become as large as 500 km. In other words, if the observed target species’ concentration is non-uniform in space, over distances smaller than the sampling distances, the target species’ abundances 15
sampled by FTIR and MIPAS, and therefore also by BASCOE, may be different. 6.2.2 Comparisons of the vertical profiles of HNO3
Figure 11 presents, for the five stations, the relative differences between the vertical profiles of HNO3for the two comparison ensembles, “Statistics 1” and “3”, analogously to Fig.8for N2O.
20
The profiles comparisons confirm the conclusions as to bias and standard deviations discussed in the previous section. First, the expected positive bias between MIPAS and FTIR, due to the use of different spectroscopy, is observed in the profiles compar-isons. The shape of the bias is different from station to station: it is mainly located at 100 hPa for Jungraujoch and 30 hPa at Kiruna, whereas at Wollongong, Lauder and 25
Arrival Heights (reduced period), the highest biases are observed at about 100 and 15 hPa. A similar shape for these three stations is not surprising as they used a similar retrieval strategy (choice of micro-windows, a priori covariance matrix,...). The DOFS
ACPD
6, 8335–8382, 2006
Comparisons between g-b FTIR and
MIPAS N2O and HNO3
C. Vigouroux et al. Title Page Abstract Introduction Conclusions References Tables Figures J I J I Back Close Full Screen / Esc
Printer-friendly Version Interactive Discussion for the FTIR HNO3 retrievals between the considered pressure limits is between 1.5
(for Jungfraujoch) and 2.4 (for Lauder); therefore, the detailed shape strongly depends on the retrieval settings. Second, we can see from the different biases obtained using BASCOE compared to the MIPAS ones, that the assimilation is not as good as for N2O, as already discussed in Sect.4. Third, we see that the estimated random error (shaded 5
area) is lower than the standard deviations, as obtained for the partial columns, prob-ably due to high spatial and temporal variability of HNO3and the horizontal smearing effect discussed in the previous section. At high altitude, the relative differences go to zero but not the random uncertainty because the error calculation uses, for all the stations, a typical averaging kernel matrix of Kiruna, which has a sentivity different from 10
zero even at high altitude.
7 Conclusions
Comparisons have been performed between MIPAS and ground-based FTIR vertical profiles of N2O and HNO3, covering the full year of 2003. The MIPAS data were pro-vided by the ESA v4.61 data processor. The FTIR profiles have been retrieved at five 15
NDACC sites distributed in latitude, namely Kiruna (68◦N), Jungfraujoch (46.5◦N), Wol-longong (34◦S), Lauder (45◦S) and Arrival Heights (78◦S). The consistency between the retrievals from the five stations has been optimised. For the first time, the same FTIR data have also been compared with corresponding results from the 4D-VAR data assimilation system BASCOE that were obtained in the configuration in which BAS-20
COE assimilates the ESA v4.61 products for the six primary MIPAS species (H2O, O3, NO2, HNO3, CH4, and N2O). This was done to evaluate the impact of the spatial col-location criteria on the comparison results and to judge the appropriateness of using BASCOE results as proxies for MIPAS profiles in the stratosphere.
Considering the comparisons between the N2O MIPAS and FTIR lower stratosphere 25
partial columns during the year 2003, the biases are small and significant only for Wollongong (+4±2%) and Arrival Heights (–5±2%). The scatter is less than 7% for
ACPD
6, 8335–8382, 2006
Comparisons between g-b FTIR and
MIPAS N2O and HNO3
C. Vigouroux et al. Title Page Abstract Introduction Conclusions References Tables Figures J I J I Back Close Full Screen / Esc
Printer-friendly Version Interactive Discussion
EGU the three mid-latitude stations and less than 10% for the high latitude ones. This was
obtained using a coindicence criterion of 1000 km radius around the stations, and it has been demonstrated that the use of BASCOE reduces the collocation problem: the standard deviations between BASCOE and FTIR partial columns are less than 4% and 7% for the mid-latitude and high latitude stations, respectively. It has also 5
been shown that, because the spatial resolution of the BASCOE data used here is limited to 5◦ longitude by 3.75◦ latitude, it represents less accurately the N2O field in regions/periods with high temporal/spatial variability, such as in polar vortex conditions. Out of these periods, the standard deviation for the high latitude stations is also less than 4%, which is within the estimated random error. BASCOE profiles can indeed be 10
considered to be good proxies for the MIPAS N2O data. Concerning the N2O profiles comparisons, we observed that the biases are quite low: below 5% for Kiruna, Lauder, and Arrival Heights during the reduced time period in the whole considered pressure range; below 5% and 10% at Jungfraujoch for pressure greater and lower than 20 hPa respectively; below 8% for Arrival Heights during the whole year 2003; below 5% at 15
Wollongong for pressure greater than 5 hPa but a high bias (21%) is obtained at 25 hPa. The standard deviations are within the limits of uncertainty for pressure approximately greater than 100 hPa. For upper altitudes, the standard deviations are much larger than the estimated random error.
Regarding the comparisons of HNO3 MIPAS and FTIR partial columns, a known 20
bias, which is due to a scaling factor of 13% of the line-intensities in the different spec-tral databases, has been confirmed. Taking this fact into account, we would not have seen any statistically significant biases except at Arrival Heights (+6±3%). The stan-dard deviations, corrected by the factor 0.863 for eliminating the effect of the different line-intensities, would be less than 15% at all stations except Arrival Heights where it 25
would be 21%. These large standard deviations are clearly due to the too loose coinci-dence criterion of 1000 km. Considering the high spatial variability of HNO3, even with a collocation of 400 km, the statistics of the comparisons show standard deviations that are larger (by about a factor 2 to 4) than expected on the basis of the random
uncer-ACPD
6, 8335–8382, 2006
Comparisons between g-b FTIR and
MIPAS N2O and HNO3
C. Vigouroux et al. Title Page Abstract Introduction Conclusions References Tables Figures J I J I Back Close Full Screen / Esc
Printer-friendly Version Interactive Discussion tainty of the MIPAS-FTIR differences. This is explained by the fact that the HNO3fields
exhibit variabilities on small (<400 km) spatial scales that cannot be distinguished in the comparisons because the collocation is never perfect.
The use of BASCOE instead of MIPAS profiles cannot completely solve the colloca-tion problem because the spatial resolucolloca-tion of BASCOE is not sufficient and because, at 5
present, the variations of the HNO3field across the horizontal extension of the probed airmasses, which we call the horizontal smearing effect, are not taken into account appropriately. Even if the standard deviations of comparisons between BASCOE and FTIR are not within the estimated random error, they are quite reasonable: after cor-rection with the 0.863 factor, they are less than 10% for all the stations, during the 10
whole year 2003. Concerning the biases between BASCOE and MIPAS, it turns out that in its present status, BASCOE does not provide as good proxies for the MIPAS HNO3 profiles as for N2O, because it uses assimilation convergence criteria that are too much relaxed.
This paper has also demonstrated that ground-based FTIR measurements, despite 15
their low vertical resolution, are usefull for satellite validation because they allow a sta-tistical approach. They have been sollicitated for additional validation efforts including other independent data from ballon, aircraft and satellite.
Acknowledgements. The authors thank the European Commission, and the Belgian
Fed-eral Science Policy and ESA for funding this work through the projects UFTIR
(EVK-2002-20
00159), and Prodex CINAMON (ESA contracts 15151 and 15064) and TASTE (ESA contract 18028/04/NL/AR), respectively. They also acknowledge their national authorities for supporting the observations and the many people who have participated to them. In addition, we wish to thank the Stiftungsrat of the Jungfraujoch for supporting the facilities allowing to perform long term and regular observations at that site. The authors are also grateful to M. Ridolfi (University
25
of Bologne) and U. Cortesi (IFAC-CNR) for discussions on MIPAS errors, and J. C. Lambert and C. De Clercq (BIRA-IASB) for discussions on interpretations of the results.
ACPD
6, 8335–8382, 2006
Comparisons between g-b FTIR and
MIPAS N2O and HNO3
C. Vigouroux et al. Title Page Abstract Introduction Conclusions References Tables Figures J I J I Back Close Full Screen / Esc
Printer-friendly Version Interactive Discussion
EGU
References
Blom, C. E., Camy-Peyret, C., Catoire, V., Chance, K., Oelhaf, H., Ovarlez, J., Payan, S., Pirre, M., Piesch, C., and Wetzel, G.: Validation of MIPAS temperature profiles by stratospheric bal-loon and aircraft measurements, Proceedings of the Second Workshop on the Atmospheric Chemistry Validation of Envisat (ACVE-2), Frascati, 3–7 May 2004, ESA Special Publication
5
SP-562, August 2004. 8338
Blumenstock, T., Mikuteit, S., Hase, F., Boyd, I., Calisesi, Y., De Clercq, C., Lambert, J.-C.,
Koopman, R., McDermid, S., Oltmans, S., Swart, D., Raffalski, U., Schets, H., De Muer, D.,
Steinbrecht, W., St ¨ubi, R., and Wood, S.: Comparison of MIPAS O3 profiles with
ground-based measurements, Proceedings of the Second Workshop on the Atmospheric Chemistry
10
Validation of Envisat (ACVE-2), Frascati, 3–7 May 2004, ESA Special Publication SP-562,
August 2004a. 8338
Blumenstock, T., Mikuteit, S., Griesfeller, A., Hase, F., Koop, G., Kramer, I., Schneider, M., Fischer, H., Gil, M., Moreta, J. R., Navarro Coma, M., Raffalski, U., Cuevas, E., Dix, B., and Schwarz G.: Validation of MIPAS and SCIAMACHY data by ground based spectroscopy at
15
Kiruna, Sweden, and Iza ˜na, Tenerife Island (AOID-191), Proceedings of the Second Work-shop on the Atmospheric Chemistry Validation of Envisat (ACVE-2), Frascati, 3–7 May 2004,
ESA Special Publication SP-562, August 2004b. 8356
Calisesi Y., Soebijanta V. T., and van Oss R.: Regridding of remote soundings:
For-mulation and application to ozone profile comparison, J. Geophys. Res., 110, D23306,
20
doi:10.1029/2005JD006122, 2005. 8349
Camy-Peyret, C., Payan, S., Dufour, G., Oelhaf, H., Wetzel, G., Stiller, G., Glatthor, N., Blu-menstock, T., Blom, C. E., Keim, C., Mikuteit, S., Engel, A., Pirre, M., Moreau, G., Catoire,
V., Bracher, A., Weber, M., and Bramstedt, K.: Validation of MIPAS CH4 profiles by
strato-spheric balloon, aircraft, satellite and ground based measurements, Proceedings of the
Sec-25
ond Workshop on the Atmospheric Chemistry Validation of Envisat (ACVE-2), Frascati, 3–7
may 2004, ESA Special Publication SP-562, August 2004a. 8338
Camy-Peyret, C., Dufour, G., Payan, S., Oelhaf, H., Wetzel, G., Stiller, G., Blumenstock, T., Blom, C. E., Guld, T., Glatthor, N., Engel, A., Pirre, M., Catoire, V., Moreau, G., De Mazi `ere,
M., Vigouroux, C., Mahieu, E., Cortesi, U., and Mencaraglia, F.: Validation of MIPAS N2O
30
profiles by stratospheric balloon, aircraft and ground based measurements, Proceedings of the Second Workshop on the Atmospheric Chemistry Validation of Envisat (ACVE-2),
![Table 3. Statistical means and standard deviations [<X-FTIR>±1σ]/<FTIR> [%] of the N 2 O partial columns confined between the given pressure limits](https://thumb-eu.123doks.com/thumbv2/123doknet/14702383.565210/36.918.42.690.343.478/table-statistical-standard-deviations-partial-columns-confined-pressure.webp)
![Table 5. Statistical means and standard deviations [<X-FTIR>±1σ]/<FTIR> [%] of the HNO 3 partial columns confined between the given pressure limits](https://thumb-eu.123doks.com/thumbv2/123doknet/14702383.565210/38.918.49.668.345.508/table-statistical-standard-deviations-partial-columns-confined-pressure.webp)