Developing a natural gas trading hub in China
By
Zhao Zhu
B.E. Thermal Engineering
Tsinghua University, 2014
SUBMITTED TO THE MIT SLOAN SCHOOL OF MANAGEMENT IN PARTIAL
FULFILLMENT OF- THE REQUIREMENTS FOR THE DEGREE OF
MASTER OF SCIENCE IN MANAGEMENT STUDIES
AT THE
MASSACHUSETTS INSTITUTE OF TECHNOLOGY
MASSA
JUNE 2016
C
2016 Zhao Zhu. All rights reserved.
I
The author hereby grants to MIT permission to reproduce
L
and to distribute publicly paper and electronic
copies of this thesis document in whole or in part
in any medium now known or hereafter created.
CHUSETTS INSTITUTE
)F TECHNOLOGY
UN 0 8 2016
IBRARIES
Signature of Author:
Certified by:
Accepted by:
Signature redacted
MIT Sloan School of Management
May 6, 2016
Signature redacted_ __
John Parsons
Senior Lecturer/ MBA Program Finance Track Head
Thesis Supervisor
Signature redacted
Rodrigo S. Verdi
Associate Professor of Accounting Program Director, M.S. in Management Studies Program MIT Sloan School of ManagementDeveloping a natural gas trading hub in China
By
Zhao Zhu
Submitted to MIT Sloan School of Management
on May 6, 2016 in Partial fulfillment of the
requirements for the Degree of Master of Science in
Management Studies.
ABSTRACT
Natural gas demand is expected to grow rapidly in China in the coming decade with the policy target of
increasing the natural gas contribution to the energy supply from less than 6% in 2014 to 10% in 2020.Ensuing the 2013 national pricing reform, China started to launch more fundamental market reform in the
natural gas industry and proposed to set up a gas hub in Shanghai. At the same time, there are also heated
discussions for Asia to set up a benchmark gas hub with the growing needs for gas-to-gas pricing. This
study discusses how China can successfully develop the Shanghai benchmark hub with deep analysis of
both the unique features of the China's gas market and the development of the successful hubs in the US
and Europe. By identifying the critical physical and market conditions of a successful hub such as
sufficient infrastructures, the open access to the network and a more competitive market structure, the
study summarizes the key takeaways of the international experiences that are most relevant to China's
current situation. Then the author proposes the detailed pathway for the development of the Shanghai gas
hub. The preliminary proposal argues that the reform should first start from LNG by distributing the costs
of the large take-or-pay contracts which were signed at high prices. Then more substantial reform should
be implemented with setting up an Independent System Operator (ISO) in charge of the operation and the
investment of pipelines, LNG terminals and other infrastructures, yet still leaving the ownership of the
assets to the three big oil companies. Such unbundling should start from the national level with the
conditions that big consumers should be permitted direct connection to the trunk pipelines. Additionally,
a new mechanism incentivized the ISO to efficiently expand and connect the network should be designed.
Thesis Supervisor: John Parsons
Acknowledgements
Working on this thesis is one of the most unforgettable and enjoyable experiences for me in MIT. During
the process of writing this paper, I have received numerous help and advice from the thoughtful academic
mentors, policy makers and industry experts across four countries in China, the US, the UK and
Netherlands.
First, I want to thank my thesis advisor Prof. John Parsons for all the challenging questions he asked me. I
still remember how frustrated I was when I came out of our first meeting after I arrived at MIT. I failed to
answer almost all the questions and was then too nervous to ask any questions in my original question list.
Certain experiences had often repeated afterwards. However, it was those questions, which seemed
obvious at the first glance but were indeed fundamental to understanding the topics, that helped me to
analyze the problems deeply. Actually, I later found this process of being challenged and then thinking
critically is the most exciting moment for me in MIT. Another unforgettable quote from Prof. Parsons is
that "don't rely your writing on the literature because most literature is written on an average standard.
However, I want you to become a good writer that is above the average." I find I'm extremely fortunate to
have the opportunity to be both challenged and encouraged by Prof. Parsons, which is the most valuable
learning
process during my studying at MIT.
Additionally, I want to thank Prof. Ignacio Perez-Arriaga from MIT and Prof. William Hogan from
Harvard for teaching me the fundamental principles of the electricity market, which
I
then took reference
a lot for working out the natural gas problems. I also appreciated both of the world experts' help in
introducing me to the policy makers and industry specialists in both the US and Europe.
During the past half year, I travelled extensively in the US and Europe, interviewing those who either
personally experienced the liberalization of the natural gas market or who are currently running the gas
market. The major institutions I visit include the independent gas regulators and the pipeline operators.
Thanks for the help of all the interviewees, I'm very fortunate to have direct exposure to the insightful
details of the liberalization process in the two continents dated back to
1990s.
Finally, I want to thank my colleagues in the SHPGX. They not only helped me to gain a deeper
understanding of many unique features of the China's gas market but also raised many interesting
questions they encountered during the work, which help me to better evaluate the possible solutions that
are more fit into China's context.
Table of Contents
Introduction ...
7C hapter 1. C hina's Natural G as M arket...8
1.1 D em and and Supply...8
1.1.1
Consum ption ... 81.1.2
Production ... 81.1.3 Im
ports ... 91.2 Pipeline gas m arket...10
1.2.1
Upstream ...
10
1.2.2 M idstream : pipelines...10
1.2.3
Dow
nstream ... 111.2.4 Sum m arization of the pipeline gas m arket structure... 12
1.3 The LNG m arket...12
1.3.1 U pstream ... 13
1.3.2 M idstream : LN G trucks ... 13
1.3.3
Dow
nstream ... 141.3.4 Sum m arization of the LN G m arket structure... 15
C hapter 2. M ove to gas-to-gas pricing ... 16
2.1 Basic pricing formation mechanisms for natural gas... 16
2.2 N atural gas pricing in Asia ... 17
2.2.1 Current natural gas pricing in Asia... 17
2.2.2 The rationale for gas-to-gas pricing in Asia ... 18
2.3 N atural gas pricing in China...20
2.3.1 Before the 2013 pricing reform ... 20
2.3.2 The 2013 pricing reform ...
20
2.3.4 The rationale for gas-to-gas pricing in China ... 22
Chapter 3. The rationale of developing a natural gas hub in China...24
3.1 W hat is a natural gas hub ... 24
3.2 C onditions for a successful hub ... 24
3.2.1 Physical conditions ... 24
3.2.2 M arket conditions ... 24
3.3 The rationale for China and Asia to develop a natural gas benchmark hub...24
3.3.1 For China ... 24
3.3.2 For A sia...25
Chapter 4. International experiences of establishing successful natural gas hubs...26
4.1 H enry H ub...26
4.1.1 Physical preconditions ... 26
4.1.2 Setting up the com petitive gas m arket ... 26
4.2.1 Physical conditions ... 29
4.2.2 Setting up the com petitive gas m arket ... 29
4.3 The TTF and Europe's gas roundabout ... 32.
4.3.1 Physical conditions ... 32
4.3.2 Setting up the com petitive m arket ... 32
4.4 The US versus European gas hubs ... 33
Chapter 5. Preliminary proposal for the hub development in China ... 35
5.1 Icebreaking
from LN G ... 355.1.1 Open-access LN G term inals ... 35
5.1.2 Introducing International LN G players...36
5.1.3 Developing A sian price index... 37
5.2 Un bundling natural gas suppliers from the network operator ... 37
5.2.1 The m odel of Independent System Operator (ISO )... 37
5.2.2 The national versus the distributed network... 38
5.3 N ew m echanism s for the netw ork investm ent... 39
5.4 Acceleration of the reform with the Shanghai Petroleum and Natural Gas Exchange (SH PG X) ... 40
5.4.1 Shareholders and m arket participants ... 40
5.4.2 The trading activities...41
C onclusions...43
Reference ... 44
A ppendix...47
Interviewee Lists
... 51Introduction
The natural gas demand in China has been more than triple in the past decade. With China's even more
severe environment pollution and the commitment to reduce the carbon emissions, natural gas is targeted
to increase from less than 6% of the energy consumption in 2014 to 10% in 2020 in the Twelfth Five
Year Plan. To reach the goal, the Chinese government has launched a national natural gas pricing reform
program since 2011. A combination of the netback and oil indexation mechanism is adopted, and
Shanghai city gate price is chosen as the benchmark price. To further increase the efficiency of the natural
gas market and make gas competitive among the power mix, a more fundamental reform is in the
progress. Many topics such as the open access to the network and setting up a natural gas hub in Shanghai
are under heated discussion.
At the same time, Asia gas markets, which highly rely on LNG import, are facing increasing challenges of
the current Japan Crude Cocktail (JCC) linked price mechanism. The soaring oil prices in the early 2010s
coupled with the Fukushima nuclear accident in 2011 make the LNG buyers in great financial distress. As
the Asian countries continuously moving away from oil, the oil-indexed pricing no longer consistantly
reflects the supply and demand of the natural gas market, and thus, there are growing interests in moving
to gas-to-gas pricing mechanism. A natural gas benchmark hub in Asia is expected to greatly contribute to
the development of the Asian gas market.
Aimed to prompt the market liberalization of the gas industry in China and set up the Asian natural gas
benchmark hub, the Shanghai Petroleum and Natural Gas Exchange (SHPGX)' was launched in July
2015 with a strategic alliance of National Development and Reform Commission (NDRC) and Xinhua
News Agency in China.
While previous studies discussed the pros and cons of hub development in major Asian countries such as
Singapore, Japan, Korea and China, the author thinks the Shanghai hub has certain physical and market
advantages that other Asian hubs are incomparable with. However, the natural gas market in China is still
at an early stage of development. Therefore, the goal of this paper is to propose a detailed pathway of how
China can successfully develop the Shanghai benchmark hub with the recent natural gas market reform.
The study first takes a thorough revision of the natural gas market in China. In particular, it reveals
several unique features of China's gas market such as the domestic LNG market. Chapter 2 reasons the
needs to move to gas-to-gas pricing both for China and Asia by reviewing the current pricing mechanism.
Chapter 3 identifies China's strength and weakness in developing a benchmark gas hub in Asia based on
the analysis of the critical physical and market conditions of a successful natural gas hub. Chapter 4 takes
an in-depth analysis of the successful hubs (Henry Hub, National Balancing Point and Title Transfer
Facility) in the US and Europe based on the interviews with the pipeline operators and the regulators that
personally went through the liberalization process in these countries. Most importantly, the study
summarizes the key takeaway that is most relevant to China's current situation. Based on all the previous
discussion, Chapter
5
gives the preliminary proposal on the first stage of the development of Shanghai gas
hub.
1 Though the SHPGX is called "Exchange", its functions are very different from those of the traditional exchange. This will be discussed in more details in Chapter 5.
Chapter 1. China's Natural Gas Market
The consumption of natural gas in China rose substantially in the past decade. Compared to 51 billion cubic meters (bcm) in 2005, the consumption in 2014 rose to 188 bcm (BP 2015). While Japanese consumption represented the mainstay of Asian natural gas demand, China surpassed Japan as the largest natural gas consumer in Asia in 2010. An even larger gas demand is expected in the future as China seeks alternatives to coal with the severe environment pollution.
In
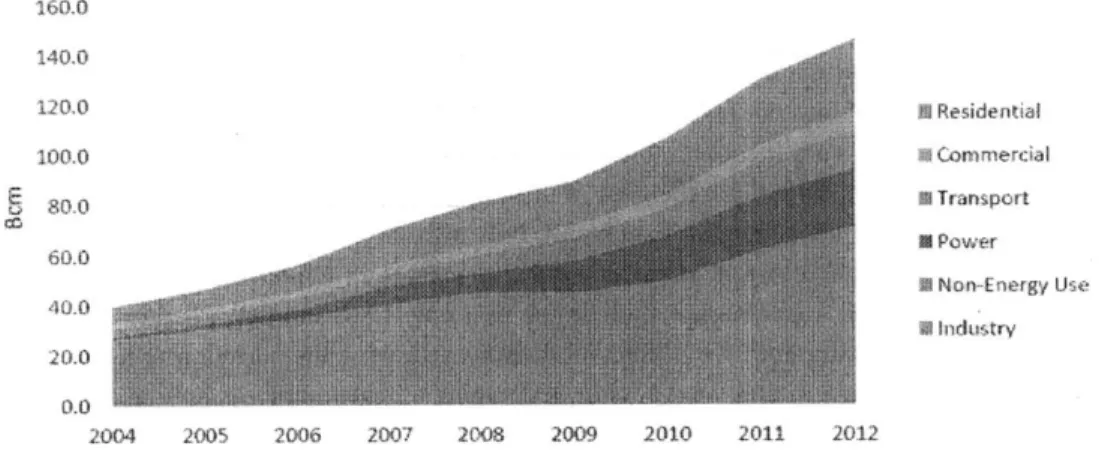
the Twelfth Five Year Energy Plan, natural gas was targeted to reach 10% of the total energy demand by 2020 (NDRC 2012). Nevertheless, natural gas only accounted for 6.3% of China's overall energy consumption by the end of 2014.Currently, industry accounted for the largest share of gas consumption. The consumption of natural gas in non-industrial sectors only became important until the 2000s. Followed by industry consumption (34%), residential and power generation respectively accounted for 20% and 18% of the gas consumption in 2012. Power generation is considered one of the most potential sectors for the future growth in natural gas consumption because it only accounted for 2.2% of national electricity generation in 2012. Transportation is another sector expected to have high growth in the future. As the leading country in the Compressed Natural Gas (CNG) vehicles, transportation accounted for 10% of natural gas consumption in 2012 (Li
2015).
Figure 1. Natural Gas Consumption by use between 2004 and 2012 (Li 2015)
200 20 b 0) 210?7 2&1)8 20(19 211) 2 1 21)12
Though China more than tripled the domestic gas production since 2003, the production was still hard to keep up with the roaring demand (Figure 2). It produced 123.5 bcm natural gas in 2014 from four key regions (the Tarim Basin, the Sichuan Basin, the Ordos Basin, and the South China Sea Basin) which covered 90% of China's total domestic gas production (EIA 2015).
Comparatively, the unconventional gas production was still limited (1.95% of gas production). Though EIA estimated that China had the largest shale gas reserves of 31.6 trillion cubic meters (tcm) in the world, the shale gas production in 2013 only accounted for 0.17% (0.2 bcm) of the China's gas production. The slow growth forced the government to cut half of its original target (60 bcm) for the shale
gas production in 2020, which made the future development of shale gas more unclear (Renmin 2014).
Figure 2. China's natural gas production and consumption, 2004-2014 (Source: BP)
200 - .. 160 - -1 4
0...
--- -1 20
--- --- -- -- ---S100 80
--
---
---60 40 20
0
7
2004 2005 2006 2007 2008 2009 2010 2011 2012 2013 2014 production w consumption k l' i 13As China's natural gas consumption outstripped domestic supply since 2007, there are rising imports of
both liquefied natural gas (LNG) and pipeline gas. China's total gas imports volume was 58.3 bcm (31%
of the gas consumption) in 2014. Imports of pipeline gas (31.3 bcm) were a bit more than those of LNG
(27 bcm).
Imports of pipeline gas didn't start until 2010 when the first pipeline imports flowed to China from Turkmenistan through the first Central Asia Gas Pipeline (CAGP). Currently, other countries supply gas through CAGP including Uzbekistan and Kazakhstan. Additional to the first and second line of the
CAGP, the third line, which started to operate by the end of 2015, and the fourth line, which is expected
to complete construction by the end of 2020, will add up to the annual capacity of 85 bcm, almost triple the current gas imports (Sergey and Danwei 2015). The CAGP are connected to China's West-East gas pipelines that pass through China from its western border all the way to Shanghai.
Additional to CAGP, there are two new sources of imports from Myanmar and Russia. In 2013, the Myanmar Gas Pipeline started to deliver 12 bcm gas to Guangxi and Yunnan regions. In 2014, China and Russia finalized a natural gas agreement that allowed China to purchase and transport gas from the Power of Siberia pipeline with up to 38 bcm annUally of natural gas for 30 years starting in 2018 (Xinhua News Agency 2015). Another Russia's Atai pipeline, which could deliver gas of 88 bcm annually, is also
currently under negotiation (Paik 2015).
If
this agreement is reached, it will greatly crowd out the futureLNG imports because the overall pipeline imports will add up to 223 bcm, more than the overall natural
gas consumption in 2014.
China is also a major LNG importer. In 2012, China rose to become the third-largest LNG importer in the world, after Japan and South Korea. While Qatar is the biggest LNG exporting country to China (34%), the remaining LNG imports came from Australia (24%), Indonesia (16%) and Malaysia (13%). China currently has II LNG receiving terminal along the urban coastal, the capacity of which is 45 bcm
annually. If the further 13 terminals in the planning stages are eventually built, it will take China's LNG
import capacity to 150 bcm annually (Russell 2014). However, due to China's ever-growing LNG expansion and economic slowdown, the utilization factor of the receiving terminal is only about 50% (Paik 2015).
This study divides China's natural gas market into two markets, the pipeline gas and LNG markets, based on whether the natural gas is delivered to the end users through pipelines or LNG trucks. The reason of such division is the distinct market structures and players. While the pipeline gas market is dominated by monopolistic sellers and buyers, the LNG market is highly competitive with many private companies. Section 1.2 and 1.3 will analyze these two markets respectively from the upstream, midstream to downstream.
The upstream of the pipeline gas market in China is controlled by the big three oil companies, China National Petroleum Corporation (CNPC), China Petroleum & Chemical Corporation (Sinopec) and China National Offshore Oil Corporation (CNOOC).
The three oil companies are the only legal direct importers of natural gas in China. For the production, CNPC was the first to produce natural gas in China in Changqing field in Shaanxi Province, though this field is depleting recently. CNPC is the largest gas producer in China (75% of the gas production) in 2014 with most of its production from the Tarim and the Sichuan basin. Sinopec constituted 16% of the overall gas production in 2014. Most of the production of Sinopec came from Puguang field in Sichuan basin, which was discovered in 2005 and estimated to have the reserves of 500-550 bcm (IEA 2014). Comparatively, CNOOC only produced a small amount of onshore natural gas. The majority of its natural gas business is LNG imports. Other small players such as Shaanxi Yanchang Petroleum (municipal), Xinjiang Guanghui (private), Henan CBM (private) are mainly producing unconventional natural gas.
Figure 3. Natural gas production in China (Source: Paik 2015)
100 80 60
40
20 0 --- ---- -.--- . 2002 2005 2010 2014CNPC - SINOPEC CNOOC and others
With the production of CNPC in Changqing field, the
1"
Shaanxi-Beijing gas pipeline was put into construction in 1996. This is also the start of the large-scale construction of natural gas pipelines for China (Gao 2013). In the following decade, China expanded its natural gas pipelines quickly, the total length of which was estimated to be nearly 85,000 km in 2014. CNPC is the largest owner of the trunk pipelines (75%) (lEA 2014). One of the most significant projects is the West-East Gas Pipelines owned by CNPC, which connect the consumption regions in the East Coast to the West. With two lines in operation, one line in construction and another two lines in plan, the project delivers natural gas from Western China and Central Asia to the major target consumer markets in Southeast China. Once thewhole project is completed, it will have a total length of more than 20,000 km and an annual delivery capacity of 77 bcm (CNPC 2013). The detailed information of major natural gas pipelines is shown in Appendix I and 2.
In 2014, National Energy Administration (NEA) issued Third-party Access to Oil and Gas Pipelines.
The guidelines permitted the third parties the access to the natural gas pipelines and related infrastructure (such as storage, liquefaction, LNG etc.) that have excess capacity on a non-discriminatory basis (NEA 2014). However, the guidelines didn't have any practical impact on the operation due to the monopoly power of the three oil companies. The details the open access to pipelines will be analyzed in Chapter 3,4 and 5.
Different from the up and midstream, the natural gas distribution in China is crowded with more than 800 private and foreign companies in 2015. While no companies have the dominance, the largest distribution companies that have inter-regional business are Towngas (Hongkong company), ENN (private), China Gas holdings (private), China Resources Gas (State-owned), Kunlun Energy (owned by CNPC), Beijing Gas (municipal) and Shanghai Gas (Figure 4). It was not until 2008, CNPC's gas distributors arms, Kunlun Energy, entered into the sector and tried to squeeze out non-state firms such as China Gas that had entered the business more than a decade ago (Zhu 2012).
However, the gas distribution in China is not a competitive market because once a gas distributor wins the bid for the franchise, it becomes a local monopoly. The gas distribution company makes profits by buying gas from the upstream at the city gate price and selling it to the end-users at the price set by the local government. Though the end-users price is based on the city gate price plus the distribution cost, there is flexibility in calculating the distribution cost considering the local monopoly power. Moreover, many gas distributors actually make profits through the installation fees rather than the distribution pipeline rate. The average installation fees of a new apartment are about 3000 RMB (460 USD), which is about twice
of the original cost (Petroleum Online Newspapers 2014).
Figure 4. The sales of the major natural gas distribution companies (Source: Jing 2015)
12 1
0
-... 8 6 4 -2 0Towngas China Beijing Shanghai China Gas ENN Kunlun
Resources Gas Gas Energy
Table
1.
Market structure of the pipeline gas marketUpstrean Midstream Downstream
State-owned monopoly State-owned monopoly Local monopoly
* CNPC, Sinopec, CNOOC CNPC, Sinopec, CNOOC - 800 hundred local gas
(pipeline imports and majority companies
of gas production) * Top companies: Towngas, ENN,
- Small players (mainly China Gas, China Resources
unconventional): Yanchang, Gas, Kunlun Energy, Beijing
Xinjiang Guanghui, Henan Gas and Shanghai Gas
CBM
The LNG market is a market very peculiar to China. The upstream of the LNG market is either LNG imports or the liquefaction plants that liquefied pipeline gas. About two-thirds of the LNG in the LNG market comes from liquefaction plants from January to October in 2015 (Figure 6). The LNG is then delivered through LNG trucks to the end-users. While the end-users used to be either industry or residential sector in the remote areas that were inaccessible to pipelines, because of the expansion of pipelines the primary end-users are now shifting to LNG fueling stations for heavy vehicles as an alternative to diesel. The supply chain of the LNG market in China is shown in Figure 5.
Figure 5. The LNG market in China
Pipeline gas Liquefaction
plants LNG Terminals Upstream LNG Fuel Stations LNG Trucks
Midstream
Regasification DownstreamFigure 6. The supply of the LNG market in China (Source: SCI 2015)
10 thousand tons
Liquefaction Plants
L/tNG Terniiials
2009
2010
2011
2012
2013
70. 00%
SupplyIncrease
60.07%
b0. 00%
- 40. 00
30. 00%
20.00%1-10.
0%
24--15--a-0.
001
20[l4
2015 Jan-Oct
Residential or Industrial End-users1000
S00
600
4oo
0
-1.3.1 Upstream
1. Liquefaction plants
Most of the liquefaction plants are owned by private companies (the list of top LNG Liquefaction companies is shown in Appendix 4). The first liquefaction plant was set up in Henan Province in 2001 with a capacity of 0.3 mcm/day (million cubic meters/day). The industry grew rapidly since 2008 (Figure 6) and reached the capacity of 64 mcm/day in 2014. Different from the liquefaction plant for LNG exports in other countries, the average capacity of an LNG liquefaction plant in China is about
1
mcm/day (ICIS2015a).
2. LNG Terminals
The three oil companies are currently the only owners of LNG receiving Terminals, with CNOOC as the first mover in the LNG business and the largest owners of LNG receiving terminals. China's first LNG receiving terminal, Dapeng LNG terminal in Guangdong Province owned by CNOOC, was put into operation in 2004. Among the eleven LNG terminals in operation, CNOOC owns seven operational LNG receiving terminals with a total capacity of 24.9 mt/yr (million tons/year). CNPC owns the three operational LNG receiving terminals in Dalian, Rudong and Tangshan, with a combined capacity of 10 mt/yr. Sinopec is the last to start its LNG business. Its first terminal in Qingdao began operations in 2014. The sole control of the three oil companies in LNG terminals didn't change until 2015 when the NDRC approved the first privately owned LNG receiving terminal project in Zhoushan by ENN. However, the construction was postponed until January 2016 (AsiaChem 2016). The detailed information of LNG Terminal projects is shown in Appendix 3.
There are two requirements for directly importing LNG to China. 1) The permission from the Ministry of Commerce. Different from oil, as long as a gas company has the business license in China, it can automatically gain the approval. 2) The access to harbors and receiving terminals, which needs to be approved by NDRC. In 2014 Third-party Access to Oil and Gas Pipelines issued by NEA also permitted the third-party access to LNG terminals (Qu 2013). In August 2014, CNPC's LNG terminal in Jiangsu opened to Shenergy Group (owned by the provincial government) as the first third-party access of LNG terminals practice in China. Later in 2014 and 2015, the terminal was opened to ENN (private) and Pacific Gas Company (Foreign). Though theoretically there are no policy obstacles for companies other than the big three oil companies to directly importing the LNG to China, there are still many challenges in practice. This will be discussed in more details in Chapter 5.
1.3.2 Midstream: LNG trucks
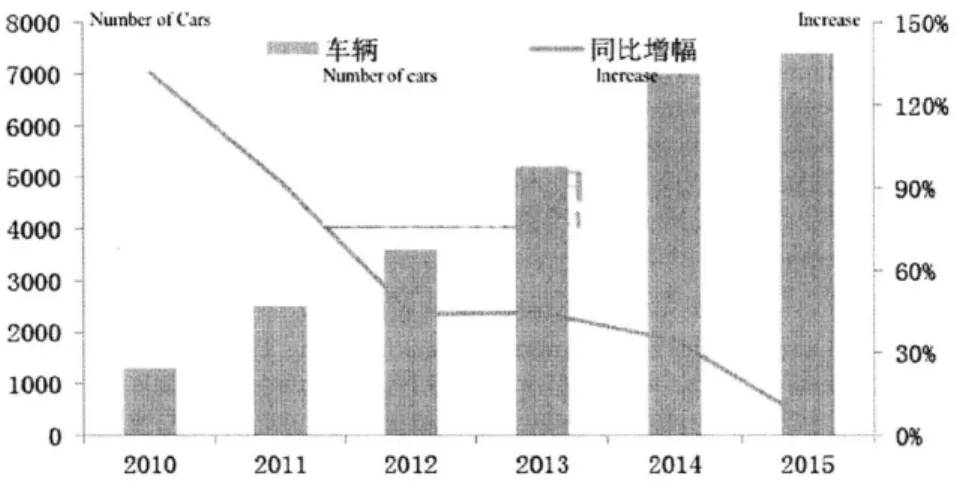
The LNG trucks are mainly owned by private companies (the list of top companies owning LNG trucks is shown in Appendix 4). On average, an LNG truck is able to deliver about 30,000 cubic meters of LNG per trip. While transporting LNG via trucks used to be a lucrative business with long delivery distance, the penetration of LNG imports and the sharp growth in the number of LNG trucks greatly depressed this
logistic market (Figure 8) (ICIS 2015b).
Figure 8. Number of LNG
logistic
trucks in China (Source: SCI 2015)'ace
150% NumnbI Of Cas 120% 90% 60% 30% 2010 2011 2012 2013 2014 2015The major end-users of the LNG market are LNG fueling stations for heavy-duty trucks powered by LNG. Such trucks mainly transport cargoes, which are different from the LNG logistic trucks for transporting LNG. The LNG fueling stations are owned by multiple players (The list of top companies owning LNG fueling stations is shown in Appendix 4).
China is currently the leading country for natural gas vehicles in the world. CNG, accounting for 97 percent of vehicles running on natural gas, is the major competitor with LNG vehicles. However, compared with CNG that has lower energy density, LNG is better for heavy-duty vehicles that are in constant operation and need to be refilled quickly (Bloomberg 2016). The location of LNG fueling station is also more flexible than that of CNG since CNG is usually delivered through pipelines. More than 100,000 LNG powered vehicles were running on the road in 2014 (GE Reports 2015). More growth is expected because the gas price at fueling stations in China is far lower than the diesel price and there are more than 330,000 of heavy-duty trucks on the road (Jones 2015). Though the number of LNG fueling stations was more than triple from 2012 to 2014, the lack of fueling infrastructure is the largest constraint (Figure 9).
Figure 9. Number of LNG fueling stations in China (Source: SCI 2015)
146,
Numtbcr o" G l ' ia-Naons.u
2400 2000 1600 1200 800 400 0 2011 2012 2013
8000
7000 6000 5000 4000 3000 2000 1000 0 0% -~, 240% 160% s0% 2014 2015 0%h'! I t L _vMIMR
Numher oi LN6 nlim,,,Ianuzv;13.4 Summarization of the LNG rmarket structure
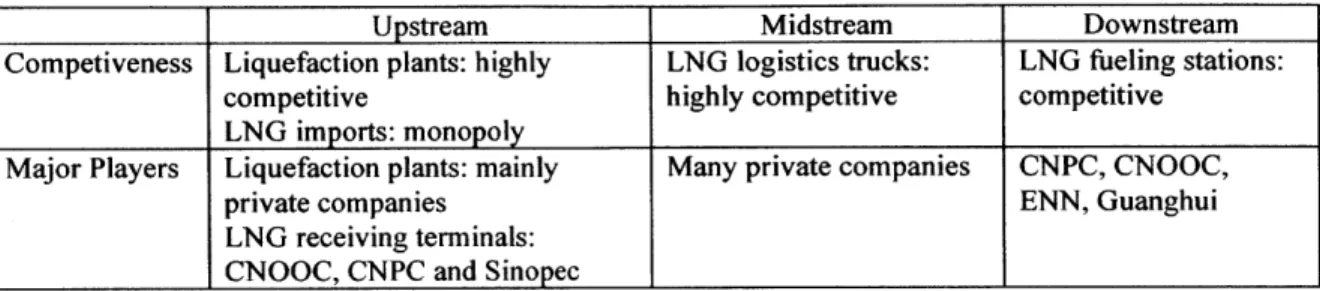
Table 2. Market structure of the LNG market
Upstream Midstream Downstream
Competiveness Liquefaction plants: highly LNG logistics trucks: LNG fueling stations:
competitive highly competitive competitive
LNG imports: monopoly
Major Players Liquefaction plants: mainly Many private companies CNPC, CNOOC,
private companies ENN, Guanghui
LNG receiving terminals: CNOOC, CNPC and Sinopec
Chapter 2. Move to gas-to-gas pricing
While historically the majority of natural gas pricing is either oil-indexed or government regulated in
Asian countries, there is an increasing interest in gas-to-gas competitive pricing to increase the efficiency.
This section will separately review the natural gas pricing system across Asian countries and specifically
in China to argue the rationale for both to move to the gas-to-gas pricing.
2.1 Basic pricing formation mechanisms for
natural gas
There are generally two formation mechanisms for a natural gas price, market-based or regulation-based.
Under the market-based mechanism, gas price is determined by the supply and demand in a market,
which can also trade commodities other than natural gas. In comparison, the regulated gas price is decided
by the government directly (IEA 2013). The International Gas Union (IGU) has identified four major
market-based pricing mechanisms and four major government-regulated pricing mechanisms (IGU 2015).
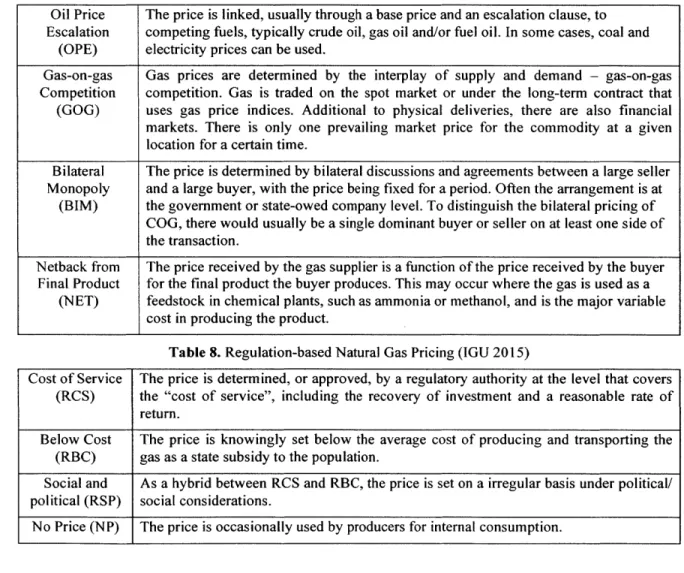
Table 3. Market-based Natural Gas Pricing (IGU 2015)
Oil Price
The price is linked, usually through a base price and an escalation clause, to
Escalation
competing fuels, typically crude oil, gas oil and/or fuel oil. In some cases, coal and
(OPE)
electricity prices can be used.
Gas-on-gas
Gas prices are determined by the interplay of supply and demand
-
gas-on-gas
Competition
competition. Gas is traded on the spot market or under the long-term contract that
(GOG)
uses gas price indices. Additional to physical deliveries, there are also financial
markets. There is only one prevailing market price for the commodity at a given
location for a certain time.
Bilateral
The price is determined by bilateral discussions and agreements between a large seller
Monopoly
and a large buyer, with the price being fixed for a period. Often the arrangement is at
(BIM)
the government or state-owed company level. To distinguish the bilateral pricing of
COG, there would usually be a single dominant buyer or seller on at least one side of
the transaction.
Netback from
The price received by the gas supplier is a function of the price received by the buyer
Final Product
for the final product the buyer produces. This may occur where the gas is used as a
(NET)
feedstock in chemical plants, such as ammonia or methanol, and is the major variable
cost in producing the product.
Table 8. Regulation-based Natural Gas Pricing (IGU 2015)
Cost of Service
The price is determined, or approved, by a regulatory authority at the level that covers
(RCS)
the "cost of service", including the recovery of investment and a reasonable rate of
return.
Below Cost
The price is knowingly set below the average cost of producing and transporting the
(RBC)
gas as a state subsidy to the population.
Social and
As a hybrid between RCS and RBC, the price is set on a irregular basis under political/
political (RSP)
social considerations.
Figure 10 shows the pricing formation of natural gas in different parts of the world. In Asia oil indexation and regulation are the dominant price mechanism. The US and the UK are the two most competitive markets with the majority of the gas based on gas-to-gas pricing since the liberalization of the natural gas market in the 1990s. Comparatively, the liberalization process in the continental Europe still leaves a large portion of its gas indexed to oil. In the Middle East, the Former Soviet Union and Africa, gas prices are highly regulated (IGU 2015).
Figure 10. The price formation of natural gas consumption in 20142 (Source: IGU 2015)
100% r -90% 80% 70% 60% 50%
40%
30%
20%
10%0%
Asia US UK Europe Middle Former Latin Africa
East Soviet America
Union
D OPE 0 GOG I Other market-based 11 Rgulation based
The increase of efficiency with gas-to-gas pricing
Because the production and the network of natural gas need huge upfront investments, long-term forward contracts are a typical element of financing for sellers to gain the following two advantages:
1)
they gain the information on demand that is revealed in a market price, and 2) they are likely to negotiate a higher sale price for their products since they can avoid the ex-post bargaining problem (Parsons 1989). However, the long-term contracts currently cause much inefficiency. Due to the lack of a gas market in the most part of the world, the price for the long-term contract is usually fixed or indexed to an alternative fuel such as oil. Such price doesn't match the supply and demand of natural gas at all time. The rigidity of the long-term contract creates the risk that makes the buyers less willing to pay a higher price or contract a higher volume. Therefore, there is inefficiency in the market when many trades that could happen don't take place.Moving to gas-to-gas pricing makes everyone better off because the long-term contract indexed to the gas price indices increases the flexibility of the trading. By delivering the right price signals to the sellers and the buyers, it matches the current supply and demand with larger contract volumes at a higher price on average.
7. 4aualt gai pr in Asii.
222..1,
Curerent ura gasA Vrig nACompared to the world average, the natural gas trade in Asia has a higher percentage of oil-indexed pricing (Figure 10). The major countries consuming natural gas in Asia are China, Japan, Korea, and
Taiwan. However, all these countries except China do not have significant domestic gas resources and access to international pipelines, and thus have to rely heavily on LNG imports.
In 1969, LNG was first imported into Japan, and through the early 1970s, the price was fixed. This ensured the suppliers to recover their huge initial investments with certainty. However, after the oil shock in the 1970s, the price of LNG was gradually raised in line with the price of the Japanese Crude Cocktail (JCC). In the 1990s, the low oil prices caused LNG suppliers to suffer from deteriorating project economics and the new pricing mechanism, S-curve, was introduced (Figure 11). S-curve reduces the slope at the upper and lower pivot points and thus has the effect of protecting the buyer from high oil prices and the seller from low oil prices.
PLNG($/MMBtu) = A - Pjcc($/bbl) + B
($/MMBtu)
Figure11.
The notional S-curve of LNG contract (Source: EY 2016)$14
Str~iiqht in contract
S-tur-,e contract
S 1 $ $24 $30 $36 $4? S48 S54 S6. $66 $72 $78 S > 90 $96
Oil prim eUSS/barreO
Though the JCC mechanism worked well in the past, many problems arose recently with increasing demand after the Fukushima accident and the needs for natural gas to be competitive with fuel other than oil in the end-users market.
As the crude oil prices soaring above $100/bbl in the early 2010s, LNG prices in Asia also dramatically increased. The Fukushima nuclear accident in 2011 further placed Japanese LNG buyers in an even more difficult financial situation as they were forced to import increasing quantities of LNG at prices substantially higher than those of Europe and North America (Rogers and Stern 2014). The 2012 average natural gas price was roughly $16/MMBtu in Japan, $9/MMBtu in Europe but only $3/MMBtu in the US (Ritz 2014). Though LNG prices plunged 60 percent of the peak price in 2012 to $7/MMBtu in 2015 with the sharp drop in crude oil prices (Paton 2015), the great loss since 2010 let the Asian importers realized the inefficiency of the current pricing mechanism based on oil-indexation. Therefore, a lot of discussions over whether the JCC mechanism should be retained, or replaced with either the index to the Henry Hub
price or more aggressively gas-to-gas pricing in Asia.
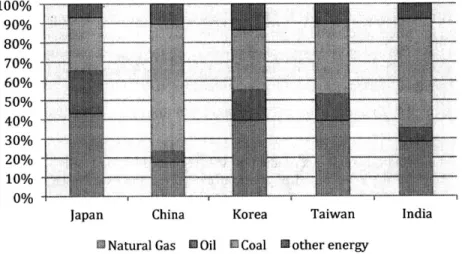
Moreover, because oil is no longer the dominant competing fuel with natural gas in Asia, the oil-indexed pricing doesn't reveal the true value of natural gas and thus makes it at a disadvantage in competing in the power mix. For Japan, while oil constituted 91% of the total energy consumption in 1979, it dramatically decreased to 22% in 2014 with coal as a comparable competitor (28% of total energy consumption). In other Asian countries, there is even less rationale of the oil-indexed pricing because oil has never been a major competitor with natural gas in history and now. In China gas, which accounts for a small
environment issues. India is very similar to China where the economy is still heavily relying on coal considering its cost advantage. For Korea and Taiwan, though coal is not dominant in total energy consumption, it is highly competing with gas in the power generation (Source: BP 2015).
Figure 12. Consumption by fuel in 2014 (Source: BP 2015) 100%
90%
80%
70% 60%50%
30%
20 L.10%
0%
-
a
Chin
Japan
ChinaFT~]
Korea TaiwanL Natural Gas
Oil
E Coal [ other energyAdditionally, with the initial investments of LNG infrastructure were gradually paid back in some country like Japan, long-term contracts are no longer needed for suppliers to recover their huge initial investments. Thus, there is an increasing trend of short-term or spot cargoes in Asia (Figure 14). However, the price for the spot-traded LNG in Asia is still highly related to the oil price and only slightly deviates from the oil-indexed level with the market conditions such as the relationship between a buyer and a seller and the availability of surplus gas in the LNG supply chain. Nevertheless, the increase in spot trade of LNG is still a good indication for the liquidity of LNG market in Asia.
Figure 13. LNG annual supply to Asia by contract category (bcm) (Source: Rogers and Stern 2014)
SSpot T'adec' LNG
SShort Term Contracts aMedium&LengTernVoumes
1LXI j Tai LNG Surpty
2~C? ~8 29 ~I2I2 2M:
23 Natural gas pricing in China
2.3.1
Before
the 2013 pricing reformBefore the natural gas pricing reform in 2013, China's natural gas had long been priced on cost-plus approach. The end-users' price is derived from adding up ex-plant prices, transmission tariffs and distribution fees. There are four categories of ex-plant prices (Fertilizer, Direct industry supply, City gas for industry and City gas for other uses) and six categories of end-users' prices (Residential, Commercial,
Industrial, Heating, Cooling, Electricity generation, Compression) (NDRC 2010, Jing 2015).
End users'prices = Explant prices + Transmission tariffs + Distribution fees
1) Ex-plant prices
The ex-plant price of the onshore natural gas production was regulated by the NDRC. While the NDRC set the basis and the range of the price based on the four categories, the exact price was based on the negotiation of the supply and demand sides. The ex-plant price of the offshore natural gas production (10% of the whole production) was directly decided by sellers and buyers. The import of pipeline gas or LNG that would inject into the pipelines followed the ex-plant price of the onshore natural gas production (NDRC 2010).
2) Transmission tariffs
For the pipelines that were invested by the government before 1984, the transmission tariff was set at a union price. The majority of such pipelines were located around the oil and gas field. For the pipelines that were invested by companies after 1984, the transmission tariff was calculated line by line and needed to be approved by NDRC. The majority of such pipelines were long distance, interprovincial pipelines (Jing 2015). The transmission tariff was usually calculated based on the following formula (Sergey and
Danwei 2015).
Transmission tariff =
Construction cost + Operation cost + Appropriate margin + Cost Variation of distance + Taxes
3) Distribution fee
The calculation of the distribution fee was very similar to the transmission tariff, except for that it was regulated by the local government.
The cost-plus approach worked well when the natural gas still developed at a preliminary stage in China. With the growing consumption outpacing the production, the old pricing mechanism faced with many challenges. Firstly, while natural gas imports were more expensive than the domestic production, they received the same price. Thus, the import companies are faced with great losses. Additionally, the cost-plus approach worked well when the gas was from a single origin and delivered by a single pipeline. As the increase of the inter-transportation between different pipelines that deliver gas from different origins, it was hard to figure out where the gas was from originally and what pipelines the gas went through. Finally, because ex-plant gas and end-users' gas was divided into different categories, many disputes arose on which price the gas distribution companies should pay the upstream suppliers for a certain type of end-users' gas.
23.2 The
2013pricing reformn
To solve the above problems, China launched a national natural gas pricing reform program since 2011. The reform was implemented nationwide in 2013. The new natural gas pricing is based on a combination of netback and oil-indexation mechanisms. Moreover, two types of natural gas volumes are proposed for
incremental volume is defined as the amount of natural gas consumption beyond that in 2012 (NDRC 2013). With the price of the existing volume adjusted by steps from 2013 to 2015, a single natural gas price except for the residential end-users was formed in 2015.
Table 4. The timeline of the reform (NDRC 201 1, NDRC 2013, NDRC 2014, NDRC 2015)
Time Reform
2011 Tested in pilot provinces of Guangdong and Guangxi.
2013 The nationwide city gate prices for the incremental volumes of natural gases were formulated by the new pricing approach. The old categories of end-users' prices were abandoned.
2014 The city gate prices for the existing volumes were increased, and those for the incremental volumes were adjusted by the new pricing approach.
2015 A new single natural gas price for the existing and incremental volumes was formulated except for the residential end-users' price.
Under the new approach, NDRC regulated the city gate price, which is the wholesale price the local gas distributors pay to pipeline operators to purchase gas. The city gate price is in principle the sum of the ex-plant price and the transmission tariff. The ex-ex-plant price and the end-users' price is set as follows (Jing
2015).
Explant price = City Gate price - Transmission tariff
Endusers' price = City Gate price + Distribution fee
Residential
Ex-plant Transmission City Gate Distribution
price tariff price feeprce
Nonresidential
Decided by NDRC Decided by the price
local government Figure 14. The pricing mechanism in China after the 2013 reform
Moreover, the city gate price at Shanghai is chosen as the reference price for all the city gate prices because Shanghai is both a large natural gas consumer and an important energy trading center in China. Take the gas from Xinjiang to Beijing as an example. The city gate price in Beijing is calculated as follows.
PBeijing = PShanighai -
Transmission fee from
Shanghai to Beijing+ Transmission fee from Xinjiang to Beijing
The primary principle for the new pricing is that the value of natural gas can be largely represented by the value of two substitutes, fuel oil (FO) used in the industrial sector and liquefied petroleum gas (LPG) used in the residential sector. Thus, the formula of the city gate price in Shanghai is defined as follows.
H NG H NG
PShanghai
City Gate price =K(axPFO
X+
flXPLPGx)x (1
+ R)
HFO HLPG
Where,
K is the discount factor set by the NDRC to encourage the use of natural gas (currently 0.85); a and fl are the weights for fuel oil and LPG (currently 60% and 40%);
PFO and PLPG are the average imported fuel oil and LPG prices;
HNG, HFO
and
HLPGare the heating value of
natural
gas, fuel oil and LPG (8000, 10000, 120000
kcal/m
3);
R is the value added tax (VAT) rate for natural gas (currently 1 3%) (Source : Jing 2015)
After the 2013 reform, the price of the existing volume stayed at a lower level than that of the incremental volume until 2015. With the plunge in the oil prices since 2014, there was also fall in the price of the incremental gas.
Figure 15. The change of the city gate price of natural gas in China (source: Sergey and Danwei 2015)
Though the 2013 reform improved the natural gas pricing system in China, there are still many problems with the current pricing mechanism and thus gas-to-gas pricing is proposed.
Just
like
the problem in other Asian countries, natural gas is competing with cheap coal rather than oil in China. With the even severe air pollution caused by coal, manylocal
governments issued the directives that aimed to transfer the fuel of boilers fr-om coal to gas after the central government issued the Planon
Preventing the Air Pollution in 2013 (The State Council 2013). While oil accounts for 6%1/ of the energy consumption in China, it is mainly deployed as a transportation fuel. Because the Shanghai city gate price is linked to the price of fueloil
and LPG, the supply of natural gas might deviate alot
from the demand with the current pricing mechanism.The current pricing schemne is still based on the vertically integrated market structure where the production is bundled with the pipeline transportation. Without separate prices for natural gas as a comm-odity and the pipeline
tariff,
independent producers will find it hard to enter the industry. This is especially troublesome to the production of unconventional gas, the advancement of which is mainlynot led by Chevron or other large international oil companies, but instead by thousands of small and
medium sized private companies. As mentioned in Chapter 1, though China is estimated to have a huge
reserve of shale gas, the shale gas production in 2013 only accounted for 0.17% (0.2 bcm) of the China's
gas production due to the insufficient drilling technology and high costs. Therefore, gas-to-gas pricing is
expected to provide the incentives for independent producers to invest and commercialize the current
immature technology, and scale up the shale gas production.
3. The
inefficiency of the
distribution
Since the end-users' price is still regulated by the local government based on the city gate price, there is
usually an interval between the adjustments of the city gate price and the end-users' price. Thus, the
pricing signals are delayed to be delivered to the end-users. Additionally, as discussed in section 1.2.3, the
collusion between the distribution company as a local monopoly and the local government further creates
the institutional inefficiencies of the market.
4. Gas subsidy from industry to residential
Though the delivering cost of natural gas to the industry is lower than that to the residential sector, the
residential gas price is set at a lower level by the government due to the political reasons. This greatly
undermines the cost competitiveness of natural gas among the power mix for the industry and electricity
generation. Therefore, gas-to-gas pricing can reveal the true value of gas to different end-users and
contribute to the adoption of natural gas to a larger extent.
Chapter 3. The rationale of developing a natural gas hub in China
3.1 What is a natural gas hub
The natural gas hub, sometimes also regarded as the market center, is where physical flows of gas are connected through a network point (a physical hub) or a wider geographical area (a virtual hub). The key services provided by hubs include the receipt/delivery access to two or more pipeline systems and administrative services that facilitate the transfer of gas ownership.
Gas hubs bring together many buyers and sellers. By providing a reliable price signal in a liquid market, hubs help match supply and demand at low transaction costs. Thus, many hubs also provide new and innovative services such as access to internet-based natural gas trading platforms that expedite and improve the natural gas transportation process. Additionally, the price of the benchmark hub such as Henry Hub in the US also provides the price benchmark for the whole region.
3.2 Conditions for a successful hub
To develop a successful natural gas hub, there are several necessary physical and market conditions. Chapter 4 will use the international experiences to explain how different conditions play a role in the development of a gas hub.
.21 Physical conditions
1. The geographic location of the hub is important because it determines the interconnectivity to other gas market areas.
2. There should be a diversified supply, such as domestic production, pipeline gas, and LNG.
3. Sufficient physical infrastructures ensure physical transactions. Thus, the availability of storage, LNG receiving terminals and the well-developed gas network is crucial.
3.2.2
Marketconditions
A competitive market is the foundation of a liquid natural gas trading hub. To build a competitive natural gas market, the study identifies the following two conditions as the most important drivers:
1. Non-discriminatory access to pipelines and LNG facilities by suppliers
2. A competitive market structure with sufficiently large number of market participants
These two conditions are also the two biggest obstacles to the liberalization of the natural gas market according to the past international experiences. Without open-access, natural gas won't be able to reach the end-users. Without a competitive market structure, non-discriminatory access will only become an
administrative rule.
Additional to the two market conditions, an independent regulator is usually needed to supervise the natural monopoly of the netwo-rk and ensure the market competition. Furthermore, transparency of the information is also important to avoid the price manipulation.
3.3
The rationale for
China
and
Asia
to
develop
a
natural
gas
benchmnark hub
13.1 For China
With the commitment to reaching peak carbon emissions in 2030 and the severe air pollution, China is determined to replace more coal with other cleaner sources in the short term. Natural gas is one of the most promising alternatives. However, as discussed in Chapter 1, natural gas only accounts for 6.3% of China's overall energy consumption by the end of 2014. Therefore, the author thinks one of the most
important motivations for China to develop a natural gas hub is to boost its natural gas consumption, in
particular in the sector of industry and electricity generation.
A successful natural gas hub can bring together many buyers and sellers. With more players, the more
competitive market will help direct gas to where it is most needed from whoever can supply it most
cheaply. Transparent price signals and standardization of contracts will help to reduce the transaction cost
and increase the market liquidity. Such price signals will also help the investors to make decisions of
efficient investment. Additional to increase the efficiency of the market, a successful hub will help to
ensure the energy security by diversifying sources of supply.
The current pricing system in China discussed in Section 2.3 fails to provide an efficient signal to the
buyers and sellers. Thus, not sufficient investments are made in the upstream and by the end-users to fully
bring out the value of natural gas in China. The expansion of the network and the connectivity between
different pipelines and LNG terminals are slow due to the monopoly and the insufficient incentives from
the downstream. This is a chicken and egg problem. Without a developed network, the end-users, in
particular industrial consumers in China, find it expensive and inconvenient to consume natural gas.
Without sufficient end-users, pipeline companies don't have the incentives to invest in the infrastructures.
Additionally, because China is continuously increasing its natural gas import, the hub can also help
ensure the energy security with diversified supply to keep up with the increasing natural gas consumption.
3.3.2
For Asia
As the indexation to oil continuously creates problems in Asia, an Asian gas hub can help to form
competitive prices that reveal the true value of natural gas and increase the cost competitiveness in Asian
markets. While most of the Asian countries rely on natural gas imports, Asia encompasses various
national gas markets in various stages of development. By analyzing four economies including China,
Singapore, Japan, and Korea, the lEA report considered Singapore as the most potential candidate
because of the push from its government for increasing competition both from the consumer and supplier
side (IEA 2013).
However, the biggest obstacle for Singapore is its limited sources of supply (no domestic production and
pipeline gas, LNG only) despite the push from the government in building LNG terminals and storage
facilities. Though Singapore tries to repeat its success of a key trading hub for other commodities like oil,
questions remain whether the single supply of LNG will be attractive to sellers and buyers in Asia when
more than half of gas imports in China, the biggest consumer in Asia, are through pipelines.
China, on the other hand, is considered by lEA lacking hands-off government approach and dominated
with vertically integrated energy companies. However, on the other hand, China is a high profile
candidate to meet many physical conditions of a successful hub. With domestic natural gas production,
LNG and the pipeline gas from Central Asia, Myanmar and Russian, China has a diversified supply.
There are eleven LNG Terminals in operation along the east coast and five more terminals already in
construction. Moreover, while pipeline gas is dominated by the vertically integrated companies, the
domestic LNG market discussed in Chapter
1
is a highly competitive market with little government
control. Therefore, the author will propose a detailed pathway of how China can meet the essential market
conditions of developing a gas hub and thus tap the full potential of its physical advantages. However, the
paper doesn't argue that China will be the only country that develops an Asian benchmark hub. Asia
might need more than one benchmark hubs to accommodate different national markets.
Chapter 4. International experiences of establishing successful natural
gas hubs
To better understand how the physical and market conditions contribute to a successful hub, this Chapter
analyzes these two aspects of the three most successful hubs in the world. They are Henry Hub in the US,
National Balancing Point (NBP) in the UK, and the Title Transfer Facility (TTF) in Netherlands.
Compared to the physical conditions, establishing a competitive natural gas market is a more complicated
process, which will be discussed in more details in this study.
4.1
Henry
Hub
Although the concept of natural gas hubs first evolved in the late
1980s,
it was fast-tracked after the
issuance of FERC Order 636, which promoted the concept of the market center. The Federal Energy
Regulation Commission (FERC) suggested the centers could provide the services for pipeline shipper and
customers so that the interchange of natural gas across pipeline systems can be greatly increased (EIA
2008).
The development of Henry Hub was more a market-driven process, though the FERC did strategically
promote Henry Hub as the major market center even before the launch of NYMEX futures. Initially, the
FERC also thought about the market centers in Texas, but it later abandoned the idea because Texas
natural gas market was highly regulated and there were a lot of political issues (O'Neill 2016). In 1990,
Henry Hub was chosen as the physical delivery location for the Henry Hub Natural Gas Futures Contract
at the New York Mercantile Exchange (NYMEX). The introduction of financial players further increased
the liquidity of the hub.
4 Physical preconditions