HAL Id: hal-02749872
https://hal.archives-ouvertes.fr/hal-02749872
Submitted on 3 Jun 2020
HAL is a multi-disciplinary open access archive for the deposit and dissemination of sci-entific research documents, whether they are pub-lished or not. The documents may come from teaching and research institutions in France or abroad, or from public or private research centers.
L’archive ouverte pluridisciplinaire HAL, est destinée au dépôt et à la diffusion de documents scientifiques de niveau recherche, publiés ou non, émanant des établissements d’enseignement et de recherche français ou étrangers, des laboratoires publics ou privés.
Inter-comparison of ground gravity and vertical height
measurements at collocated IGETS stations
Séverine Rosat, J.-P Boy, J. Bogusz, A. Klos
To cite this version:
Séverine Rosat, J.-P Boy, J. Bogusz, A. Klos. Inter-comparison of ground gravity and vertical height measurements at collocated IGETS stations. International Association of Geodesy Symposia, 2020. �hal-02749872�
Inter-comparison of ground gravity and vertical height
measurements at collocated IGETS stations
S. Rosat1,*, J.-P. Boy1, J. Bogusz2, A. Klos2
1
Institut de Physique du Globe de Strasbourg; UMR 7516, Université de Strasbourg/EOST, CNRS, 5 rue René Descartes, 67084 Strasbourg Cedex, France
2 Faculty of Civil Engineering and Geodesy, Military University of Technology, Warsaw,
Poland
*Corresponding author
E-mail address: [email protected] Tel: (+33) 3 68 85 01 16
Fax: (+33) 3 68 85 02 91
Abstract
Vertical displacements and time-varying gravity fluctuations are representative of various deformation mechanisms of the Earth occurring at different spatial and temporal scales. The inter-comparison of ground-gravity measurements with vertical surface displacements enables to estimate the transfer function of the Earth at various time-scales related to the rheological properties of the Earth. In this paper, we estimate the gravity-to-height changes ratio at seasonal time-scales due mostly to hydrological mass variabilities. We investigate this ratio at nine sites where Global Navigation Satellite System (GNSS) and Superconducting Gravimeter continuous measurements are collocated. Predicted gravity-to-height change ratios for a hydrological model are around -2 nm/s²/mm when there is no local mass effect. This is in agreement with theoretical modeling for an elastic Earth’s model. Spectral analysis of vertical displacement and surface gravimetric time-series show a coherency larger than 50% at seasonal time-scales at most sites. The obtained gravity-to-height change ratios range between -5 and -2 nm/s²/mm for stations Lhasa, Metsahovi, Ny-Alesund, Onsala, Wettzell and Yebes. At Canberra and Sutherland, this ratio is close to zero. Finally, at Strasbourg site the coherency is low and the ratio is positive because of local mass effects affecting gravimetric records.
Keywords
Vertical deformation; surface gravity variations; hydrological loading; GNSS; Superconducting Gravimeters; Earth’s transfer function
Introduction
Vertical displacements and time-varying gravity are representative of various deformation mechanisms of the Earth occurring at different spatial and temporal scales. We can quote for instance post-glacial rebound, tidal deformation, surficial loading, co- and post- seismic as well as volcanic deformations. The involved temporal scales range from seconds to years and the spatial scales range from millimeters to continental dimension. Daily Global Navigation Satellite System (GNSS) solutions precisely monitor local deformation while sub-daily gravimetric
measurements integrate Newtonian mass redistribution and deformation at a site. The inter-comparison of the ground-gravity measurements with vertical surface displacements enables to estimate the transfer function of the Earth at various time-scales related to the elastic and visco-elastic properties of the Earth. We can hence achieve a separation of the contribution of mass redistribution from surface deformation.
In this paper, we estimate the gravity-to-height change ratios, later on denoted dg/du, at seasonal time-scales. We will focus on the ratio obtained with GNSS and Superconducting Gravimeter (SG) observations. We consider stations contributing to the IGETS (International Geodynamics and Earth Tide Service) where both techniques are available with records longer than several years i.e. Canberra (Australia), Lhasa (Tibet, China), Metsahovi (Finland), Ny-Alesund (Norway), Onsala (Sweden), Strasbourg (France, Boy et al. 2017), Sutherland (South Africa), Wettzell (Germany) and Yebes (Spain). In the past, de Linage et al. (2007, 2009) computed this ratio for surface loading models (hydrological, atmospheric and oceanic). Rosat et al. (2009) already performed a comparison of GNSS and SG measurements with hydrological model at the Strasbourg (France) station, but they have computed neither the spectral coherency nor the gravity-to-height changes ratio. In the present paper, using collocated gravity and displacement measurements, we will estimate the gravity (g) to height (u) change ratio dg/du that we compare with theoretical predictions from the MERRA2 (Gelaro et al., 2017) model. In the following, we first explain the methods used to compute the transfer function and the gravity-to-height change ratio. We then remind quickly about the data processing. Finally, we show the results for the hydrological surface loading predictions and for GNSS and SG observations at nine IGETS sites.
2. Methodology and data processing
2.1 Spectral coherency and gravity-to-height ratio
We compute the magnitude squared coherence estimate of the GNSS and SG time-records given by
= ²/ , (1)
where Pxxand Pyy are the Power Spectral Density (PSD) estimates of x denoting the
height changes (du) and y denoting the gravity variations (dg), respectively, and Pxy
is the cross-PSD between x and y. The PSD is obtained using the Welch's averaged, modified periodogram method, i.e. the signals x and y are divided into sections of 4 years with 75% overlap and tapered with a Hamming window. For each section, a modified periodogram is computed and the eight periodograms are averaged. The transfer function between the surface gravity changes and vertical height changes is computed in the same way using
( ) = ( )/ ( ). (2)
The ratio dg/du corresponds to the real part of the transfer function. Please note that in case the coherency is low, computing the transfer function between both datasets would be meaningless.
2.2 GNSS data processing
We compute daily displacements from a global set of 117 worldwide stations using the GAMIT/GLOBK (v10.6) software (Herring et al. 2015). We use the latest tropospheric mapping function (VMF1; Böhm et al. 2006) with a priori values of zenith hydrostatic delay derived from the ECMWF meteorological reanalysis fields and residual Zenith Wet Delays (ZTDs) estimated at 2-hour intervals with two gradients per day. Standard solid Earth tide, ocean tidal loading (using FES2014a; Carrère et al. 2016) and pole tide corrections are applied to follow standards recommended by the International Earth Rotation and Reference Systems Service convention (IERS2010) (Petit and Luzum, 2010). We slightly modify the GAMIT software to include in our processing 3-hourly atmospheric and non-tidal oceanic loading effects at the observation level using ECMWF surface pressure field and TUGO-m (Carrère and Lyard, 2003) barotropic ocean model forced by air pressure and winds (see Boy and Lyard, 2008; Gegout et al. 2010).
2.3 SG data processing
Superconducting Gravimeters (SG) are Level-3 products from IGETS
(http://igets.u-strasbg.fr/data_products.php; Voigt et al. 2016) that is to say they are
1-minute gravity residuals after cleaning for gaps, large steps and spikes and after particular geophysical corrections (including solid Earth tides, polar motion, tidal and non-tidal loading effects) as described on the IGETS website. Hydrological loading effects are hence remaining. We have applied a low-pass filter and decimated the gravity residuals to one hour, and then we have performed a simple moving average to have daily solutions. We have selected records to avoid major instrumental trouble or changes of instruments. As for GNSS solutions, we have finally decimated SG time-series to 10 days.
3. Results
3.1 Gravity-to-height ratio from surface loading computations
Surface loading computations are available from the EOST loading service at
http://loading.u-strasbg.fr/. We consider the hydrological loading computed from
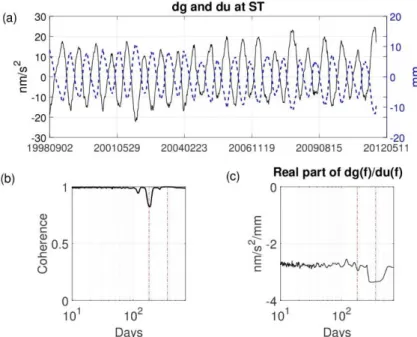
MERRA2 model in terms of surface gravity and vertical height changes between January 1980 and April 2018. The spatial and temporal resolutions of MERRA2 are, respectively, 0.625° (∼50 km) in latitude and longitude and 1 h. The loading computation was performed up to degree 72. The complete hydrological loading model for surface gravity changes is the sum of a local contribution (simple Bouguer approximation using an admittance of -4.2677 nm/s2/cm assuming all local mass changes are located above the sensor) and a “non-local” contribution computed using Green’s functions (Farrell, 1972) as described in Boy et al. (2002) and at the EOST loading website. The vertical displacement due to elastic hydrology loading is also computed using Green’s functions. In Fig. 1, Fig. 2 and Fig. 3 we have plotted an example at the underground Strasbourg (France) station respectively for the non-local, local and total contributions of the hydrological loading. The time-series of dg and du are in subplots (a), the magnitude squared coherence in (b) and the real part of the transfer function is in (c). de Linage et al. (2009) have shown that theoretically the ratio dg/du should tend to -2.6 nm/s²/mm for large spherical harmonic degrees when there is no local load. The non-local part
provides a ratio dg/du of -3.3 nm/s²/mm at annual periods and of -2.7 nm/s²/mm (Fig. 1 (c)) at shorter periods (below semi-annual). There is an agreement between MERRA2 predictions and theoretical modeling by de Linage et al. (2009). At the annual period, we have a drop of coherence between dg and du. At semi-annual time-scales, hydrological models exhibit rather high-frequency content on most continental area like Europe resulting in almost no displacement but some gravity signal.
Fig. 1 Non-local surface loading gravity and vertical changes predicted at Strasbourg (France) from MERRA2 hydrological model. (a) dg (black line) and du (dashed blue line) surface loading time-series; (b) magnitude squared coherence; (c) real part of the transfer function between dg and du. Vertical dashed red lines indicate the annual and semi-annual periods.
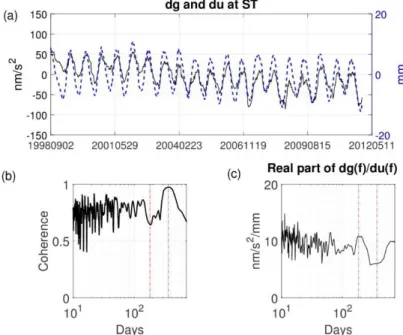
Gravimetric effects are known to be more sensitive to local masses while vertical changes, which correspond to a displacement (so a double integration of gravity), are less sensitive to local effects. Fig. 2 illustrates the smaller coherence between du and local dg effects. In the case of underground station in Strasbourg the ratio dg/du becomes positive and large as already noted by de Linage et al. (2009). Fig. 3 represents the total gravimetric loading effect versus the vertical displacement. The obtained dg/du ratio at annual period is 6 nm/s²/mm. This ratio is even larger around 10 nm/s²/mm at periods smaller than 100 days (cf. Fig. 3 (c)).
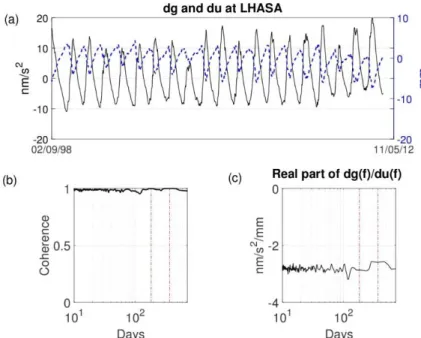
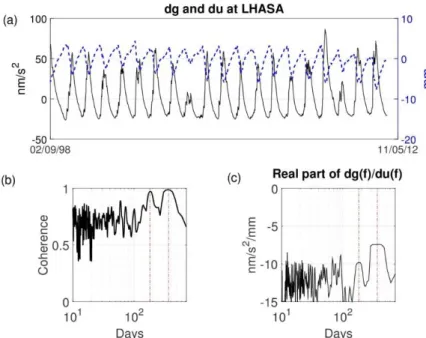
We provide another example for station Lhasa (Tibet, China) which is above ground. In Fig. 4, Fig. 5 and Fig. 6 we respectively compare the non-local, local, and total gravimetric contributions to vertical loading displacement. For this station, the annual coherency is close to one. The hydrological signal is below the station and the ratio dg/du is close to -7 nm/s²/mm at the annual period and around -10 nm/s²/mm at the semi-annual period.
Hydrological signal is coherent between vertical displacement and surface gravity loading predictions from MERRA2 model at annual and semi-annual periods for all the stations we have considered. We however do not show the plots since they
are similar to the ones already shown for Strasbourg and Lhasa stations. We will now use SG and GNSS observations to retrieve the dg/du ratio.
Fig. 2 Local surface loading gravity and vertical changes predicted at Strasbourg (France) from MERRA2 hydrological model. (a) dg (black line) and du (dashed blue line) surface loading time-series; (b) magnitude squared coherence; (c) real part of the transfer function between dg and du. Vertical dashed red lines indicate the annual and semi-annual periods.
Fig. 3 Total surface loading gravity and vertical changes predicted at Strasbourg (France) from MERRA2 hydrological model. (a) dg (black line) and du (dashed blue line) surface loading time-series; (b) magnitude squared coherence; (c) real part of the transfer function between dg and du. Vertical dashed red lines indicate the annual and semi-annual periods.
Fig. 4 Non-local surface loading gravity and vertical changes predicted at Lhasa (Tibet) from MERRA2 hydrological model. (a) dg (black line) and du (dashed blue line) surface loading time-series; (b) magnitude squared coherence; (c) real part of the transfer function between dg and du. Vertical dashed red lines indicate the annual and semi-annual periods.
Fig. 5 Local surface loading gravity and vertical changes predicted at Lhasa (Tibet) from MERRA2 hydrological model. (a) dg (black line) and du (dashed blue line) surface loading time-series; (b) magnitude squared coherence; (c) real part of the transfer function between dg and du. Vertical dashed red lines indicate the annual and semi-annual periods.
Fig. 6 Total surface loading gravity and vertical changes predicted at Strasbourg (France) from MERRA2 hydrological model. (a) dg (black line) and du (dashed blue line) surface loading time-series; (b) magnitude squared coherence; (c) real part of the transfer function between dg and du. Vertical dashed red lines indicate the annual and semi-annual periods.
3.2 Gravity-to-height ratio from GNSS and SG time-series
We show the transfer functions between vertical surface displacement and surface gravity measurements at Strasbourg (France) and Lhasa (China) in Fig. 7 and Fig. 8. We can see that at the Strasbourg station the coherency is close to 50% at the annual period, while at Lhasa, the seasonal coherency is close to 100%.
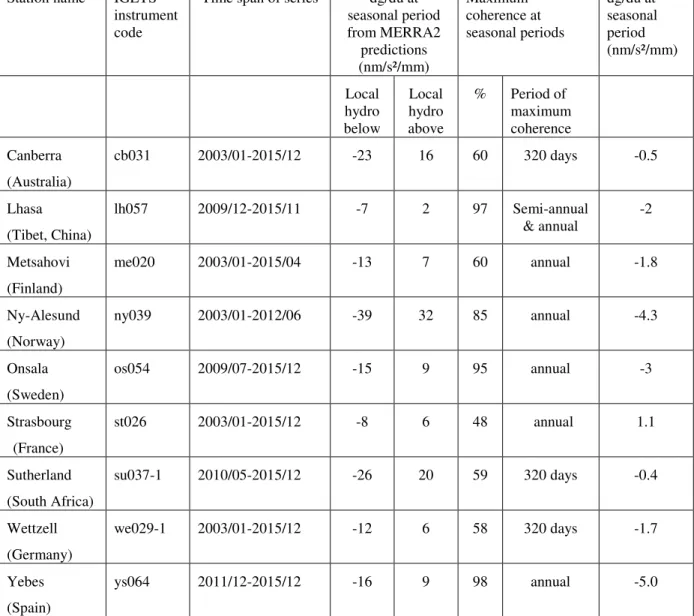
Table 1 summarizes values of coherence and of dg/du ratios at seasonal time-scales for the nine stations considered here. We have indicated the period at which the coherency is maximum and its corresponding dg/du value. At sites where the local hydrological system is more complicated than a varying underground water table, the coherence is less than 50%. That is the case of Strasbourg for instance. At the other sites, the coherence at annual time-scales is larger than 50%. Please note that for Wettzell station, we used the GNSS time-series from GRAZ station, which is located 300 km away from the SG instrument, explaining a coherence as low as 50 %. At Lhasa, the coherence is also close to 100% at the semi-annual period. Table 1 shows that we can distinguish 3 groups of stations: Lhasa, Metsahovi, Ny-Alesund, Onsala, Wettzell and Yebes for which the ratio dg/du is negative and roughly lies between -2 and -5 nm/s²/mm. Hydrological models have most of their spectral energy below degree 10 corresponding to theoretical dg/du values closer to -3 than to -2.6 nm/s²/mm elastic values (de Linage et al. 2009). So the obtained negative values agree rather well with theoretical predictions. The second group is Strasbourg station for which the ratio is positive illustrating the strong influence of local hydrological masses above the gravimeter. The third group contains Canberra and Sutherland for which the ratio is close to zero. Hydrological loading signals in gravity are indeed smaller at these two sites while vertical displacement is similar.
When comparing the dg/du ratio from MERRA2 hydrological predictions and the dg/du ratio for real observations, we can see that despite the good coherence at the annual period for most sites, the values are quite different. We should further investigate the impact of data pre-processing and the influence of local hydrological masses.
Fig. 7 Surface gravity and vertical changes recorded at Strasbourg (France). (a) dg (black line) and du (dashed blue line) time-series; (b) magnitude squared coherence; (c) real part of the transfer function between dg and du. Vertical dashed red lines indicate the annual and semi-annual periods.
Fig. 8 Surface gravity and vertical changes recorded at Lhasa (Tibet, China). (a) dg (black line) and du (dashed blue line) time-series; (b) magnitude squared coherence;
(c) real part of the transfer function between dg and du. Vertical dashed red lines indicate the annual and semi-annual periods.
Station name IGETS instrument code
Time span of series dg/du at seasonal period from MERRA2 predictions (nm/s²/mm) Maximum coherence at seasonal periods dg/du at seasonal period (nm/s²/mm) Local hydro below Local hydro above % Period of maximum coherence Canberra (Australia) cb031 2003/01-2015/12 -23 16 60 320 days -0.5 Lhasa (Tibet, China) lh057 2009/12-2015/11 -7 2 97 Semi-annual & annual -2 Metsahovi (Finland) me020 2003/01-2015/04 -13 7 60 annual -1.8 Ny-Alesund (Norway) ny039 2003/01-2012/06 -39 32 85 annual -4.3 Onsala (Sweden) os054 2009/07-2015/12 -15 9 95 annual -3 Strasbourg (France) st026 2003/01-2015/12 -8 6 48 annual 1.1 Sutherland (South Africa) su037-1 2010/05-2015/12 -26 20 59 320 days -0.4 Wettzell (Germany) we029-1 2003/01-2015/12 -12 6 58 320 days -1.7 Yebes (Spain) ys064 2011/12-2015/12 -16 9 98 annual -5.0
Table 1 Time spans of analyzed GNSS and Superconducting Gravimeter time-series and estimated ratios dg/du at the period of their maximum coherence. Maximum coherence of MERRA2 predictions is at the annual period. For predicted MERRA2 dg/du ratios, we have considered both cases of local hydrological masses below and above the instrument.
4. Summary
We have verified the spectral coherency at seasonal time-scales between surface deformation and surface gravity changes recorded at nine collocated sites. The ratio of surface gravity perturbations over vertical height changes strongly depends on the local masses fluctuations. We have shown that the seasonal signal is coherent at eight sites over the nine studied here. The obtained dg/du ratios at the annual period are different between real observations and hydrological loading predictions. Influence of data pre-processing and local hydrological masses should be further
investigated. Interpreting the obtained dg/du ratios in terms of rheological properties of the Earth would be the next step.
Acknowledgments
We thank two anonymous reviewers and the editor for their suggestions to improve this paper. This study was funded under the International Emerging Action (n°8056, former international program for scientific cooperation PICS) of CNRS.
References
Bendat, J. S. and A. G. Pearsol, 2010. Random Data: Analysis and Measurement Procedures, (4th ed). Wiley, Hoboken, N.J
Böhm, J., Werl, B. and H. Schuh, 2006. Troposphere mapping functions for GPS and VLBI from ECMWF operational analysis data, J. Geophys. Res., 111, B02406, doi:10.1029/2005JB003629 Boy, J.-P., Gegout, P. and J. Hinderer, 2002. Reduction of surface gravity data from global atmospheric pressure loading. Geophys. J. Int., 149, 534–545.
Boy, J.-P. and F. Lyard, 2008. High-frequency non-tidal ocean loading effects on surface gravity measurements, Geophys. J. Int., 175, 35-45, doi: 10.1111/j.1365-246X.2008.03895.x.
Boy, J.-P., Rosat, S., Hinderer, J. and F. Littel, 2017. Superconducting gravimeter data from Strasbourg - level 1. GFZ Data Serv. https://doi.org/10.5880/igets.st.l1.001
Carrère, L. and F. Lyard, 2003. Modeling the barotropic response of the global ocean to atmospheric wind and pressure forcing - comparisons with observations, Geophysical Research Letters, 30 (1275), doi: 10.1029/2002GL01647
Carrère, L., Lyard, F., Cancet, M., Guillot, A. and N. Picot, 2016. FES 2014, a new tidal model - Validation results and perspectives for improvements, ESA Living Planet Conference, Prague. de Linage, C., Hinderer, J. and Y. Rogister, 2007. A search for the ratio between gravity variation and vertical displacement due to a surface load, Geophys. J. Int., 171, 986-994.
de Linage, C., Hinderer, J. and J.-P. Boy, 2009. Variability of the Gravity-to-Height Ratio Due to Surface Loads, Pure Appl. Geophys., 166, 1217-1245.
Farrell, W.E. 1972. Deformation of the earth by surface loads. Rev. Geophys. Space Phys. 10, 761-797.
Gegout, P., Boy, J.-P., Hinderer, J. and G. Ferhat, 2010. Modeling and Observation of Loading Contribution to Time-Variable GPS Sites Positions, IAG Symposia, 135 (8), 651-659, doi: 10.1007/978-3-642-10634-7_86.
Gelaro, R., McCarty, W., Suarez, M.J., Todling, R., Molod, A.M., Takacs, L.L., Randles, C., Darmenov, A., Bosilovich, M.G., Reichle, R.H., Wargan, K., Coy, L., Cullather, R.I., Akella, S.R., Bachard, V., Conaty, A.L., da Silva, A., Gu, W., Koster, R.D., Lucchesi, R.A., Merkova, D., Partyka, G.S., Pawson, S., Putman, W.M., Rienecker, M.M., Schubert, S.D., Sienkiewicz, M.E., Zhao, B., 2017. The modern-era retrospective analysis for research and applications, version-2 (MERRA-2). J. Clim. 30, 5419-5454. http://dx.doi.org/10.1175/JCLI-D-16-0758.1.
Herring, T. A., King, R. W., Floyd, M. A. and S. C. McCluskey, 2015. Introduction to GAMIT/GLOBK, Release 10.6, Mass. Inst. of Technol., Cambridge.
Petit, G. and B. Luzum, 2010. IERS Conventions (2010). IERS Technical Note No. 36, Verlag des Bundesamts für Kartographie und Geodäsie Frankfurt am Main, pp. 179
Rosat, S., Boy, J.-P., Ferhat, G., Hinderer, J., Amalvict, M., Gegout, P. and B. Luck, 2009. Analysis of a ten-year (1997-2007) record of time-varying gravity in Strasbourg using absolute and superconducting gravimeters: new results on the calibration and comparison with GPS height changes and hydrology, J. of Geodyn., 48, 360-365.
Voigt, C., Förste, C., Wziontek, H., Crossley, D., Meurers, B., Palinkas, V., Hinderer, J., Boy, J.-P., Barriot, J.-P., and H. Sun, 2016. Report on the data base of the international geodynamics and earth tide service (IGETS). Scientific technical report STR Potsdam, GFZ German Research Centre for Geosciences, 24 p. https:// doi.org/10.2312/gfz.b103-16087