HAL Id: hal-03239731
https://hal.sorbonne-universite.fr/hal-03239731
Submitted on 27 May 2021
HAL is a multi-disciplinary open access archive for the deposit and dissemination of sci-entific research documents, whether they are pub-lished or not. The documents may come from teaching and research institutions in France or abroad, or from public or private research centers.
L’archive ouverte pluridisciplinaire HAL, est destinée au dépôt et à la diffusion de documents scientifiques de niveau recherche, publiés ou non, émanant des établissements d’enseignement et de recherche français ou étrangers, des laboratoires publics ou privés.
and multiorgan dysfunction in COVID-19 patients with
obesity
Marie-Agnès Dragon-Durey, Xiaoyi Chen, Amos Kirilovsky, Nadine Ben
Hamouda, Carine El Sissy, Jules Russick, Etienne Charpentier, Yannick
Binois, Florence Marliot, Maxime Meylan, et al.
To cite this version:
Marie-Agnès Dragon-Durey, Xiaoyi Chen, Amos Kirilovsky, Nadine Ben Hamouda, Carine El Sissy, et al.. Differential association between inflammatory cytokines and multiorgan dysfunction in COVID-19 patients with obesity. PLoS ONE, Public Library of Science, 2021, 16 (5), pp.e0252026. �10.1371/jour-nal.pone.0252026�. �hal-03239731�
RESEARCH ARTICLE
Differential association between
inflammatory cytokines and multiorgan
dysfunction in COVID-19 patients with obesity
Marie-Agnès Dragon-Durey1,2,3,4,5, Xiaoyi ChenID5,6,7☯, Amos Kirilovsky5,8☯, Nadine BenHamouda1,2, Carine El Sissy1,2,3,5,8, Jules RussickID4,5, Etienne Charpentier2,9,
Yannick Binois2,10, Florence Marliot1,2,3,5,8, Maxime MeylanID4,5, Cle´mence Granier1,2,3,11,
He´lène Pere2,3,11,12, Antonin Saldmann1,2,3,11, Bastien Rance2,3,6,7,13, Anne
Sophie Jannot2,3,6,7,13, Ste´phanie Baron2,3,14, Mouna Chebbi2,3,14, Antoine Fayol2,3,15, Nathalie Josseaume4,5, Claire Rives-LangeID2,3,16, Pierre-Louis TharauxID2,3,11,
Bernard Cholley2,3,17, Jean-Luc Diehl2,3,17,18, Jean-Benoıˆt Arlet2,3,19, Michel Azizi2,3,20, Alexandre Karras2,3,10, Se´bastien Czernichow2,3,16, David M. Smadja2,3,18,21, Jean-Se´bastien HulotID2,3,11,15, Isabelle Cremer4,5, Eric Tartour1,2,3,11, Elie Mousseaux2,3,9,
Franck PagèsID1,2,3,5,8*
1 Laboratory of Immunology, 2 Hoˆ pital Europe´en Georges Pompidou, AP-HP, Paris, France, 3 Universite´ de Paris, Paris, France, 4 INSERM UMRS 1138, Cordeliers Research Center, Team Inflammation,
Complement, and Cancer, Paris, France, 5 Sorbonne Universite´ , Cordeliers Research Center, Paris, France,
6 INSERM UMRS 1138, Cordeliers Research Center, Team Information Sciences to Support Personalized
Medicine, Paris, France, 7 Laboratory of Information Sciences to support Personalized Medicine, Paris, France, 8 INSERM UMRS 1138, Cordeliers Research Center, Team Integrative Cancer Immunology, Paris, France, 9 Department of Radiology, 10 Department of Nephrology, 11 INSERM, Paris Cardiovascular Center / PARCC, UMR 970, Paris, France, 12 Laboratory of Virology, 13 Biostatistics and Public Health Department, 14 Department of Physiology, 15 Clinic Investigation Center 1418, 16 Department of Nutrition,
17 Department of Intensive Medicine, Reanimation, 18 INSERM UMR-S1140, Team Innovative Therapies in
Haemostasis, Paris, France, 19 Department of Internal Medicine, 20 Department of Vascular Medicine,
21 Department of Hematology
☯These authors contributed equally to this work.
*franck.pages@aphp.fr
Abstract
To investigate the mechanisms underlying the SARS-CoV-2 infection severity observed in patients with obesity, we performed a prospective study of 51 patients evaluating the impact of multiple immune parameters during 2 weeks after admission, on vital organs’ functions according to body mass index (BMI) categories. High-dimensional flow cytometric charac-terization of immune cell subsets was performed at admission, 30 systemic cytokines/che-mokines levels were sequentially measured, thirteen endothelial markers were determined at admission and at the zenith of the cytokines. Computed tomography scans on admission were quantified for lung damage and hepatic steatosis (n = 23). Abnormal BMI (>25) observed in 72.6% of patients, was associated with a higher rate of intensive care unit hospi-talization (p = 0.044). SARS-CoV-2 RNAaemia, peripheral immune cell subsets and cyto-kines/chemokines were similar among BMI groups. A significant association between inflammatory cytokines and liver, renal, and endothelial dysfunctions was observed only in patients with obesity (BMI>30). In contrast, early signs of lung damage (ground-glass opac-ity) correlated with Th1/M1/inflammatory cytokines only in normal weight patients. Later
a1111111111 a1111111111 a1111111111 a1111111111 a1111111111 OPEN ACCESS
Citation: Dragon-Durey M-A, Chen X, Kirilovsky A,
Ben Hamouda N, El Sissy C, Russick J, et al. (2021) Differential association between inflammatory cytokines and multiorgan dysfunction in COVID-19 patients with obesity. PLoS ONE 16(5): e0252026.https://doi.org/ 10.1371/journal.pone.0252026
Editor: Aleksandar R. Zivkovic, Heidelberg
University Hospital, GERMANY
Received: January 26, 2021 Accepted: May 8, 2021 Published: May 26, 2021
Copyright:© 2021 Dragon-Durey et al. This is an open access article distributed under the terms of theCreative Commons Attribution License, which permits unrestricted use, distribution, and reproduction in any medium, provided the original author and source are credited.
Data Availability Statement: All relevant data are
within the manuscript and itsSupporting informationfiles.
Funding: The funding resources were Universite´ de
Paris, The Cancer Research for Personalized Medicine (CARPEM), National Institute of Health and Medical Research (INSERM), and Assistance Publique-Hoˆpitaux de Paris (AP-HP). Study sponsors had no role in study design, data collection, analysis, interpretation, or writing of the
lesions of pulmonary consolidation correlated with BMI but were independent of cytokine levels. Our study reveals distinct physiopathological mechanisms associated with SARS-CoV-2 infection in patients with obesity that may have important clinical implications.
Introduction
Coronavirus disease 2019 (COVID-19), first identified on December 2019, is caused by the severe acute respiratory syndrome coronavirus-2 (SARS-CoV-2) [1,2]. Acute respiratory dis-tress syndrome (ARDS) sometimes associated with multiorgan failure is observed in a large proportion of COVID-19 patients [3]. The pathogenesis of severe forms of COVID-19 is char-acterized by hyperinflammatory syndrome, i.e. a cytokine storm [4]; with overproduction of inflammation-related molecules such as interleukin-6 (IL-6), C-reactive protein (CRP), and ferritin [5].
If low socioeconomic status [6] has been reported as risk factors for being infected, severe form of COVID-19 is mainly observed in patients of advanced age; with the 14.8%-20.2% fatal-ity rate for adults older than 80 years [7]. However, it also affects younger male patients with preexisting moderate comorbidities i.e. type II diabetes (33.8%), high blood pressure (56.6%), and overweight (41.7%), in US patients requiring hospitalization [8]. The association between high body mass index (BMI) and the need for invasive mechanical ventilation has been emphasized by studies from different countries [9–12]. This view is endorsed by a position statement concerning the prevention and management of patients with obesity infected by SARS-CoV-2 [13]. Obesity is considered as a state of excessive fat accumulation caused by a disruption of energy balance. It is marked by enhanced pro-inflammatory factors in blood and infiltration of immune cells in white adipose tissue. Imbalance in the expression of pro and anti-inflammatory adipokines secreted by adipose tissue contributes to the development of obesity-linked complications [14], e.g. insulin resistance and type II diabetes, atherosclerosis, and non-alcohol fatty liver disease (NAFLD) [15]). The interleukin (IL)-1-family cytokine members and tumor necrosis factor alpha (TNFα) are key inflammatory cytokines involved in fatty liver diseases [16,17]. In addition, other cytokines, such as MCP-1, IL-6, IL-8, IL-18, RANTES and Il-10 are also associated to fatty liver [18,19]. Pro-inflammatory responses in adipose microenvironment activate endothelial cells, which upregulate cell adhesion markers such as P and E-selectins [20] favoring infiltration of immune cells. Signs of liver dysfunction [21], acute kidney injury [22], and endothelium activation [23] have been reported in critically ill patients with COVID-19, however their association with obesity and inflammatory disor-ders remains elusive.
In the present study, we analyzed prospectively the association between the COVID-19-induced cytokines storm and vital organs, i.e. the lung, liver, and kidney in 51 severe patients according to their BMI and examined whether the severity of the SARS-CoV-2 infec-tion in overweight patients could be related to distinct cytokine profiles and/or a differential impact of inflammatory cytokines on multiorgan dysfunction.
Materials and methods
Patients
This prospective observational cohort study included 51 consecutive adult patients (� 18 years old) with available samples admitted to Georges Pompidou European Hospital (Paris, France)
report; and in the decision to submit the paper for publication. The corresponding author had full access to all the data in the study and had final responsibility for the decision to submit for publication.
Competing interests: I have read the journal’s
policy and the authors of this manuscript have the following competing interests: HP reports personal fees from MSD, Janssen, and Biomerieux. ET reports research grants from Servier and Vaxeal; reports honorarium fees from BMS and Merck-MSD; reports honorarium fees for participation on advisory boards from BMS and Astra-Zeneca. PLT reports honorarium fees for participation on advisory boards for Retrophin Inc not related to this work. JBA reports consultancy/expert testimony and honoraria from Novartis and Pfizer. BC reports receiving consulting fees and honoraria for lectures at symposia from Edwards Life Sciences, Orion Pharma, Amomed, and Nordic Pharma. MZ reports research grants from the French Ministry of Health, Quantum Genomics, and the European Horizon 2020 program; reports grant support and nonfinancial support from ReCor Medical and Idorsia; and reports personal fees from CVRx. JSH reports grants from Bioserenity, Sanofi, Servier and Novo Nordisk. J.S.H; reports speaker, advisory board or consultancy fees from Amgen, Astra Zeneca, Bayer, Bristol-Myers Squibb, Novartis, Novo Nordisk. SC reports personal fees from Novonordisk, Lilly, Kabi, Janssen-Cilag, Servier, outside the submitted work; reports other from MyGoodLife. FP reported receiving grants from Bristol-Myers and Squibb and HalioDx outside the submitted work; participation in Scientific Advisory Boards & Meetings for Bristol-Myers Squibb, Roche, Janssen, Merck, and Gilead. DMS received consulting fees or travels expenses from Boehringer Ingelheim, Le´o Pharma, Aspen and Carmat. None of them are related to the work described here. M-ADD reported having received speaker fees from BMS, Gilead and Roche outside the submitted work. The remaining authors declared no conflict of interest. This does not alter our adherence to PLOS ONE policies on sharing data and materials.
since March 23rd2020. All patients were diagnosed with COVID-19, i.e. positive for SARS--CoV-2 nucleic acid on real-time reverse transcription-polymerase chain reaction (RT-PCR) assays of nasopharyngeal swab specimens, in accordance with the World Health Organization (WHO) COVID-19 technical guidance (https://apps.who.int/iris/handle/10665/330854). Only critical cases of pneumonia defined as patients with respiratory rate > 30 breaths/min, severe respiratory distress, or SpO2 < 90% on room air at admission were included in this study. On admission, all patients required oxygen and 36 an intensive care unit (ICU) admission with invasive mechanical ventilation. Five patients received corticosteroids at admission and 17 anti-IL6R during hospitalization. This study received approval from the hospital institutional review board (CERAPHP.5—Comite´ d’Ethique de la Recherche, Assistance Publique Hoˆpi-taux de Paris, registration number of the committee: N˚ IRB #00011928, N˚ approval: 2020-CVD-03). All patients provided written informed consent for study participation prior to inclusion. Patients included in the present study were adult and informed that their medical data could be used for research purpose in accordance with the General Data Protection Regu-lation (EU 2016/679).
Data collection
Epidemiological, demographic, clinical, laboratory, treatment, and outcome data were extracted from patients’ electronic medical records and collected in the dedicated HEGP-REDCap™ database, which has been registered under the MR004 CNIL procedure. All data were reviewed by physicians (JSH, JLD), radiologists (EM, EC), virologist (HP), hematologist (DMS), immunologists (MADD, ET, FP), and biostatisticians (ASJ, BR, XC, MM, AK).
Routine laboratory tests
Routine laboratory tests on admission and during follow-up included the levels of liver enzymes: alanine aminotransferase (ALT), aspartate aminotransferase (AST), gamma-gluta-myltransferase (GGT), alkaline phosphatase, and total bilirubin (TBIL). Hepatic steatosis index (HSI) was calculated by adding an ALT/AST ratio to BMI, with two points added to the algorithm for diabetes and two for females [22]. Kidney parameters included baseline creati-nine values, the peak value of serum creaticreati-nine during follow-up (creaticreati-nine Max), the urine albumin/creatine ratio (ACR), the urine protein/creatine ratio (PCR), and the urinary concen-tration of sodium (UNa) and potassium (UK) from spot urine samples collected during the initial 48-h following admission.
Computed tomography (CT) examination and analysis. Twenty-three patients had available chest CT scan at admission (15 patients in conventional hospitalization unit and eight in ICU). Visual assessment of lung injuries was performed independently of care by two expert radiologists blinded to all clinical and biology data (EM, ET). Lung lobes were assessed for the presence of either ground-glass opacity (hazy areas of increased attenuation without obscuration of the underlying vasculature; GGO) or consolidation (homogeneous opacifica-tion with obscuraopacifica-tion of the underlying vasculature), or both in all patients [24,25]. The extent was further evaluated by the number of affected lobes (0 to 5). In case of discordance, a con-sensus was reached by the two experts before calculating the final visual GGO and consolida-tion scores. As previously described [26], hepatic steatosis was screened in all CTs by estimating the absolute value difference in attenuation between liver and spleen (CTL-S). A Threshold CTL-S value of -3.2 was used to define the presence of hepatic steatosis. A coronal height measurement of the hepatic hilum at the dome level was finally performed in all patients at CT.
Serum SARS-CoV-2 nucleic acid (RNAaemia). SARS-CoV-2 RNA was extracted from plasma (140μL) collected at the zenith of cytokines concentrations, using QIAamp1Viral RNA Mini Kit (QIAGEN1, Hilden, Germany), according to the manufacturer’s instructions. SARS-CoV-2 RNAaemia was quantified by droplet-based Crystal Digital PCR™ (Stilla Tech-nologies, Villejuif, France) on the Naica™ System (Stilla TechTech-nologies, Villejuif, France) using the commercial RT-PCR amplification kit (Novel Coronavirus (2019-nCoV) Digital PCR Detection Kit, Apexbio™, Beijing, China) following the manufacturer’s instructions. Plasma samples with one of the two ORF1 or N genes or both genes detected were considered as posi-tive samples and results were automatically analyzed using "Crystal reader" (Stilla) and "Crystal Miner" software (Stilla) based on the most amplified gene positive droplets. SARS-CoV-2 RNA concentrations (cp/mL) were finally calculated considering the extracted volume of plasma.
Flow cytometry. Peripheral blood mononuclear cells collected at admission were stained for CD3, DC-SIGN (Beckman Coulter, Brea, CA, USA) CD8, CD40, HLA-DR (BioLegend, San Diego, CA, USA), CD14, CD16, CD19, CD56, CD86, CD209 (BD Biosciences), CD163 (Miltenyi, Bergisch Gladbach, Germany), and Live/Dead Fixable Yellow (Thermofisher, Wal-tham, MA, USA) (details inS1 Table). Data were acquired on a Fortessa X20 flow cytometer (BD Biosciences) and analyzed were using Diva software (BD Biosciences). The Excyted pipe-line was used to normalize and cluster the data (https://github.com/maximemeylan/Excyted). Intensity values of events gated from live cells were normalized using the Logicle transforma-tion. Unsupervised clustering and Uniform Manifold Approximation and Projection (UMAP) were computed with 10.000 events for each sample using k = 30 [27].
Cytokines and chemokines measurements. The levels of 26 cytokines/chemokines (FGF2, Eotaxin, G-CSF, GM-CSF, MCP-1, MIP-1α, MIP-1β, PDGF-BB, RANTES, VEGF, IFN-γ, 1β, TGFβ, 2, 4, 5, 6, 7, 8, 9, 10, 12p70, 13, 15, IL-17A, IP-10) and two immune-related molecules (IL-1ra, sCD25) were measured by Luminex technology (Bio-Plex, Bio-Rad, 27-Plex Assays panel, Marnes-la-Coquette, France) according to the manufacturer’s instructions, in the patients plasma collected at days 1 (admission), 3, 6, 9, and 14. In patients treated with anti-IL6R therapy (17/51), only samples before immuno-therapy were analyzed. Plasma samples from 18 adult blood donors collected during the same period were used as controls. Plasma HO-1 and Neopterin concentrations were determined at day 1 by using enzyme-linked immunosorbent assay (ELISA) kits (Abcam, The Netherlands and IBL International, Germany, respectively) according to the user manuals.
Endothelial markers measurements. Soluble VCAM-1, E-selectin, P-selectin, VEGF-A, PlGF, basic-FGF, VEGFR-2, angiopoietin-1, angiopoietin-2, and endoglin were quantified at admission on the day of the cytokine peak in PPP with a Human Magnetic Luminex Assay from R&D systems (Lille, France). Data were assessed with the Bio-Plex 200 using the Bio-Plex Manager 5.0 software (Bio-Rad, Marnes-la-Coquette, France). Circulating endothelial cells were isolated from EDTA blood samples collected at day 14 by immunomagnetic separation with mAb CD146-coated beads and stained with the fluorescent probe acridine orange, as pre-viously described [28].
Statistics
The association between BMI categories and patient clinical characteristics was assessed by the chi-squared test and Fisher’s exact test for categorical parameters or the Kruskal-Wallis test for continuous parameters. The p-value for trend was computed from the Spearman’s test for con-tinuous parameters or the Mantel-Haenszel linear-by-liner association test for categorical parameters. For all pairwise comparisons the Wilcoxon-Mann-Whitney test was used followed by the Benjamini Hochberg test for multiple testing correction. In each BMI group, the
median ratios between patients and the concentrations of cytokines in healthy donors were displayed on each axes of a radar chart using the radarchart function from the fmsb package. The correlations between patient clinical parameters and cytokine concentrations were assess through the Pearson correlation test except for lung damages analysis where the Spearman’s rank correlation coefficient was computed and visualized in heatmaps. For all boxplots, the center was drawn through the median of the measurement, and the lower and upper bounds of the box corresponded to the first and third quartile. Whiskers beyond these points repre-sented 1.5 times the interquartile range. All analyses were performed with the statistical soft-ware R version 3.6.3 using gplots, ggplot2, ggpubr, and fmsb packages. A p value less than 0.05 was considered as significant.
Results
Clinical and biological characteristics
We prospectively collected data regarding clinical symptoms and outcomes for 51 hospitalized patients with confirmed COVID-19. Baseline clinical characteristics are shown inTable 1.
In total, 36 and 7 patients required the ICU interventions on admission and during follow-up, respectively. The mean BMI for all patients was 28.4± 5.2 kg/m2. Fourteen (27.5%) patients presented with normal weight (BMI � 25), 24 (47.1%) with overweight (25 < BMI < 30), and 13 (25.5%) with obesity (BMI � 30;Table 1). The mean duration from onset of clinical signs to admission was identical among BMI groups (7 days; range 2–16; p = 0.283). Patients who required ICU admission presented with a higher BMI than non-ICU patients (29.3± 0.80 ver-sus 25.8± 1.28; p = 0.048); only one patient with BMI�30 did not require ICU care. Patients with BMI � 30 tended to be younger than those with normal weight (BMI � 25; 64 versus 58 years; p trend = 0.069). Six (46.2%) patients with BMI � 30 died during hospitalization and these patients were significantly younger than those who died and had BMI�25 (60 (+/- 15) versus 78 (+/- 9) years, p = 0.041). Hypertension and diabetes were the most common comor-bidities (54.9% and 27.5%, respectively,Table 1). Diabetes, chronic obstructive pulmonary dis-ease, and cardiac disease other than arterial hypertension were mainly observed in patients with BMI � 30 (p = 0.024, p = 0.032, and p = 0.029, respectively,Table 1). When removing COPD patients from the analysis, the WHO scale remains correlated with BMI (p = 0.033,S2 Table). No difference for the plasmatic level of C-reactive protein, D-Dimers, troponin, and ferritin was observed at admission between BMI groups. Neutrophils to lymphocytes and CD4 to CD8 ratios did not differ between the BMI groups (S3 Table).
Immune profiles and BMI categories
On admission, 19 of 30 analyzed cytokines/chemokines or immune-related molecules were significantly increased in blood of patients with COVID-19 compared to controls (all p adjusted = 0.05 to < 0.001,S4 Table). Thirteen of these correlated with the severity of respira-tory distress, as evaluated by the WHO scale (S1 Fig). The immune landscape combined nine pro-inflammatory cytokines (e.g. TNFα, IL-8, IFNγ, MCP-1, MIP1α, and G-CSF) together with T helper type 2 or macrophage type 2 cytokines with anti-inflammatory properties (i.e. IL-10, IL-4 and HO-1;S1 Fig). The cytokine levels on admission were not influenced by sex except for IL-15 (S2 Fig), nor by BMI assessed as a continuous variable (S5 Table) or by cate-gory (BMI � 25, 25 < BMI < 30, or BMI � 30;Fig 1A, HSI<30 or >36,S3 Fig).
Strong similarity for the immune orientations (e.g. pro versus anti-inflammatory) was observed in patients according to BMI categories (Fig 1B). No difference was observed at the zenith for each cytokine measured from day 1 to day 14 between patients groups classified according to BMI (S3 Fig). Of note, patients receiving corticosteroids at admission (n = 5) had
Table 1. Demographic and clinical characteristics.
All Body Mass Index p overall p trend
< 25 25 < BMI < 30 � 30 N = 51 n = 14 n = 24 n = 13 Sex (%) 0.637 0.579 Female 12 (23.5) 2 (14.3) 7 (29.2) 3 (23.1) Male 39 (76.5) 12 (85.7) 17 (70.8) 10 (76.9) Age, years 60.0 (53.0–70.5) 64.5 (59.2–75.2) 59.0 (53.8–68.0) 58.0 (49.0–68.0) 0.174 0.069
Time from clinical signs to admission, days 7.0 (6.0–8.5) 7.00 (6.2–7.7) 7.00 (6.0–7.2) 7.0 (7.0–10.0) 0.571 0.524
ICU required on admission (%) 0.526 0.258
No 15 (29.4) 6 (42.9) 6 (25.0) 3 (23.1)
Yes 36 (70.6) 8 (57.1) 18 (75.0) 10 (76.9)
ICU required during hospitalization (%) 0.084 0.044
No 8 (15.7) 5 (35.7) 2 (28.3) 1 (7.7) Yes 43 (84.3) 9 (64.3) 22 (97.1) 12 (92.3) Death (%) 0.109 0.897 No 35 (68.6) 8 (57.1) 20 (83.3) 7 (53.8) Yes 16 (31.4) 6 (42.9) 4 (16.7) 6 (46.2) Comorbidities Diabetes (%) 0.053 0.024 No 37 (72.5) 12 (85.7) 19 (79.2) 6 (50.0) Yes 14 (27.5) 2 (14.3) 5 (20.8) 6 (50.0) AHT (%) 0.782 0.833 No 23 (45.1) 6 (42.9) 12 (50.0) 6 (46.2) Yes 28 (54.9) 8 (57.1) 12 (50.0) 7 (53.8)
Cardiac disease other than AHT (%) 0.12 0.032
No 44 (86.3) 10 (71.4) 21 (87.5) 13 (100.0)
Yes 7 (13.7) 4 (28.6) 3 (12.5) 0 (0.0)
AHT, diabetes, or other cadiac disease (%) 0.197 0.291
No 18 (35.3) 5 (35.7) 11 (45.8) 2 (15.4) Yes 33 (64.7) 9 (64.3) 13 (54.2) 11 (84.6) COPD (%) 0.069 0.029 No 47 (92.2) 14 (100.0) 23 (95.8) 10 (76.9) Yes 4 (7.8) 0 (0.0) 1 (4.17) 3 (23.1) Cancer (%) 0.432 0.116 No 48 (94.1) 12 (85.7) 23 (95.8) 13 (100.0) Yes 3 (5.9) 2 (14.3) 1 (4.2) 0 (0.0) Tabacco use (%) 1 1 No 27 (90.0) 7 (87.5) 13 (92.9) 7 (87.5) Yes 3 (10.0) 1 (12.5) 1 (7.1) 1 (12.5) Therapy CorticotherapyA(%) 1.000 0.950 No 46 (90.2) 13 (92.9) 21 (87.5) 12 (92.3) Yes 5 (11.9) 1 (7.7) 3 (15.8) 1 (10.0) Anti-IL-6R (Sarilumab)B(%) 0.597 0.345 No 34 (66.7) 11 (78.6) 15 (62.5) 8 (61.5) (Continued )
cytokine levels similar to other patients (p>0.05 for each, Wilcoxon test,S4 Fig). Cytokine assays post-therapy anti-IL6R were excluded from analysis. Characterization of peripheral blood mononuclear cells according to BMI categories using polychromatic flow cytometry showed no difference for percentages and absolute numbers of total T cells, CD4 T lympho-cytes, CD8 T lympholympho-cytes, B lympholympho-cytes, and NK-T cells (S5 Fig). A decrease trend for the absolute number of NK cells and subsets of monocytes was observed for increasing BMI cate-gories (S5A Fig). Uniform Manifold Approximation and Projection representation of the immune cell landscape (Fig 1C) revealed very similar patterns between BMI subgroups with no significant difference among clusters (S5B Fig). RNAaemia measured at the zenith was identical among BMI groups (Fig 1D). Altogether, the severity of COVID-19 in patients with obesity was neither associated with an increased production or a distinct pattern of cytokines or immune cells nor with a higher SARS-COV2 viremia.
Relationship between cytokine profiles and the COVID-19 severity
according to BMI
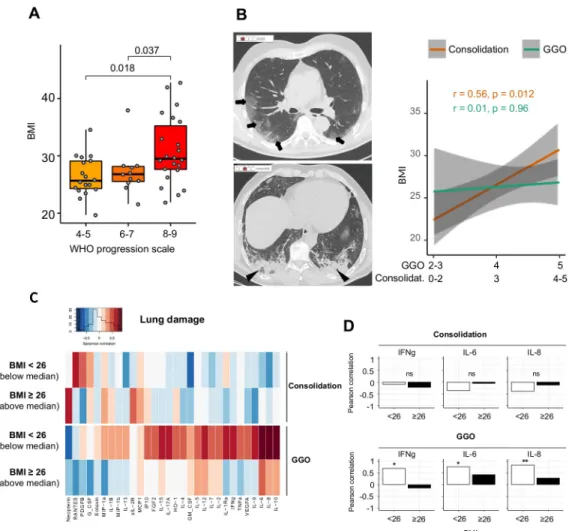
The severity of respiratory distress correlated with the BMI levels (Fig 2A).
Patients with mechanical ventilation and pO2/FIO2 < 150, spO2/FIO2 < 200, or vasopres-sors (WHO score 8), and vasopresvasopres-sors, dialysis, or extracorporeal membrane oxygenation (WHO score 9) presented with a significantly higher BMI as compared to those with 6–7 WHO score (i.e. requiring oxygen by NIV or high flow or mechanical ventilation and pO2 /FIO2 > 150 or spO2/FIO2 > 200; p = 0.037) and those without oxygen therapy, oxygen by mask, or nasal prongs (4–5 WHO score; p = 0.018). If we remove patients presenting with COPD from the analysis, the correlation between BMI and WHO progression scale remains significant (p trend = 0.033,S2 Table).
The BMI was correlated with the extent of consolidation (r = 0.56; p = 0.012), but not with GGO (r = 0.01; p = 0.96;Fig 2B) as assessed by CT when this examination performed at admis-sion was available (n = 19). No association between the cytokine’s levels and the extent of con-solidation and GGO was observed in patients with a high BMI (Fig 2C and 2D). Contrarily, a positive correlation was observed between the extent of GGO and cytokines involved in the Th1 immune orientation (IFNγ, IL-12) or inflammation (IL-6, IL-8, TNFα, IL-17a) in patients with low BMI (Fig 2D). Thus, pulmonary damages in BMI-high patients are distinguished by a higher propensity to make condensation and a lesser influence of cytokines.
Obesity is a positive risk factor for NAFLD. Computed tomography identified nine (out of 23; 39.1%) COVID-19 patients with CTL-Sattenuation values reflecting hepatic steatosis (Fig
3A) and 12 (out of 23; 52.2%) patients with liver dimensions compatible with hepatomegaly. In accordance, the biological HSI > 36, reflecting NAFLD, was observed in 43.1% of patients (22/51;Fig 3B) and leptin, produced by fat cells, was increased in blood of patients
Table 1. (Continued)
All Body Mass Index p overall p trend
< 25 25 < BMI < 30 � 30
N = 51 n = 14 n = 24 n = 13
Yes 17 (33.3) 3 (21.4) 9 (37.5) 5 (38.5)
ICU = Intensive care unit, COPD = Chronic obstructive pulmonary disease, AHT = arterial hypertension
APatients received corticotherapy at admission and during hospitalization.
BPatients received anti-IL6R treatment during hospitalization, none received it at admission.
Fig 1. (A) Box plots illustrating the concentration of cytokines according to the BMI levels in COVID-19 patients with
BMI � 25, 25 < BMI < 30, and BMI � 30. The colored squares associated with each cytokine illustrate the different orientations of the immune response (n = 42 patients). (B) Radar plots illustrating the fold increase of selected cytokines in patients with BMI � 25 (n = 11), 25 < BMI < 30 (n = 19), and BMI � 30 (n = 12), as compared to healthy donors (n = 18). (C) Characterization of peripheral blood mononuclear cells according to the BMI categories (above and below
with obesity (p = 0.012;Fig 3B). The severity of ARDS correlated with HSI (the WHO scale: 8–9 versus 4–5 p = 0.042;Fig 3B), as previously observed with BMI. At admission, 62.7% (n = 32/51) of patients presented with mild liver dysfunction (i.e. abnormalities in ALT, AST, TBIL, and/or GGT;S1 Table). No difference of cytokines levels was observed between patients
the median BMI of 26.8, n = 29) using polychromatic flow cytometry and Uniform Manifold Approximation and Projection representation of the 24 clusters identified. Each C stands for one of the 24 « Cluster » automatically identified and defined by the software. Each cluster corresponds to a group of cells with comparable phenotype i.e that express similar levels of the different markers (at their surface or intracellular) (D) Box plots comparing the SARS-CoV-2 RNAaemia measured at the zenith of the cytokines levels, in patients (n = 50) according to the BMI levels (BMI � 25, 25 < BMI < 30, and BMI � 30). Wilcoxon-Mann-Whitney test used for pairwise comparisons in Fig 1D followed by the Benjamini Hochberg test for multiple testing correction in Fig 1A.
https://doi.org/10.1371/journal.pone.0252026.g001
Fig 2. (A) Left part: box plots illustrating BMI in COVID-19 patients (n = 50) according to the level of respiratory
distress (the WHO scale). Wilcoxon-Mann-Whitney test used for pairwise comparisons. (B) Left part: High-resolution axial computed tomography (CT) images of two patients show ground glass opacity (GGO; arrows) with a low score #2 and consolidation (arrowheads) with a moderate score #3. Right part: The correlations between the consolidation scale, GGO scale, and BMI. R for the Kendall rank correlation coefficient. (C) The Spearman correlation heatmap depicting the negative (blue), positive (red), and no (white) correlation between consolidation or the GGO extent evaluated based on chest CT images and the blood cytokines levels in COVID-19 patients (n = 19) according BMI below or above 26, i.e. the median BMI of patients with available CT (D) Bar plots showing the Spearman rank correlation coefficient of IFNγ, IL-6, and IL-8 with consolidation (top) or the GGO extent (bottom) according to the BMI levels (n = 19;�p < 0.05;
��p < 0.01).
with low (<30) and high (>36) HIS (S6 Fig). However, of all patients, a significant positive correlation between liver function tests at admission and 5/7 inflammatory cytokines, 6/11 M1 cytokines, and 4/7 Th1 cytokines was observed only in those with obesity (Fig 3C). Correlation plots of IL12 and IL-2 with ALT and TBIL are illustrated inFig 3D. Altogether, COVID-19
Fig 3. (A) Axial computed tomography images showing normal (up) and low attenuation (down) values of the liver
parenchyma reflecting steatosis (n = 23). (B) Left panel: violin plot representing the biological hepatic steatosis index (HSI) according to BMI (� 25 in green, 25 < BMI < 30 in yellow, � 30 in red). Middle panel: Box plots depicting the plasma leptin levels of patients (n = 51) according to BMI (BMI � 25, 25 < BMI < 30, � 30). Wilcoxon-Mann-Whitney test used for pairwise comparisons Left panel: Box plots representing the HSI levels according to severity of pulmonary distress (the WHO scale). (C) The Pearson correlation heatmap depicts the negative (blue), positive (red), and no (white) correlation between markers of liver dysfunction (AST, ALT, gGT, TBIL, and PT) and the blood cytokines levels in in patients (n = 51) according to BMI (BMI � 25, 25 < BMI < 30, BMI � 30). (D) Linear regression curves estimated between ALT, total bilirubin, and plasma concentration of IL-1β, IL-12 and IL-2 in non-overweight patients (BMI � 25, in light blue) and in patients with obesity (BMI � 30, in dark blue). Patients with 25 < BMI < 30 are presented in grey.
patients with obesity frequently had imaging and biological signs of steatosis and a correlation was observed between liver dysfunction and inflammatory cytokines.
Overall, 58% of the total cohort (30/51 patients), showed kidney function impairment with increased serum creatinine on admission or during hospitalization (S3 Table). Peak level of serum creatinine during follow-up was higher in patients with BMI � 30 (267 versus 114μm/ L in patients with BMI � 25; overall p = 0.008,S3 Table). Most of inflammatory cytokines lev-els at admission correlated with the peak creatinine during hospitalization (e.g. IL-6 [r = 0.24; p = 0.0092], IFNγ [r = 0.48, p < 0.001], TNFα [r = 0.39; p < 0.001], and sIL2R [r = 0.5, p < 0.001];Fig 4A).
This association was reinforced in patients with obesity (Fig 4A). Nine proinflammatory cytokines compatible with M1 polarization (IL-8, FGF, sIL-2R, GM-CSF, TNFα, MIP1α, G-CSF, IFNγ, and MIP1β) correlated with renal dysfunction (i.e. peak of serum creatinine), but also with the ratio urine albumin/creatinine to protein/creatinine (ACR/PCR), reflecting glomerular involvement (Fig 4B).
Relationship between cytokine profiles and endothelial biomarkers
according to BMI
Multiorgan dysfunction in patients with obesity could be related to endothelial damage under cytokine disorders. We measured plasmatic endothelial markers at the zenith of inflammatory cytokines cumulation. Increased levels of endoglin, E and P-selectin, angiopoietin 2, and PIGF were observed in patients with BMI�30 (Fig 5AandS3 Table).
Concomitantly, markers of endothelial dysfunction correlated with cytokines levels of the Th1 immune orientation (IFNγ, TNFα), inflammation (IL-17a, MIP1α, G-CSF, TNFα, MIP1β, and IFNγ), and/or M1 activation (IL-6, IFNγ, TNFα, IP10, MIP1α, and MCP1), mostly in patients with obesity (Fig 5B). IL-8, a cytokine also produced by activated endothelial cells, was highly correlated with these inflammatory cytokines.
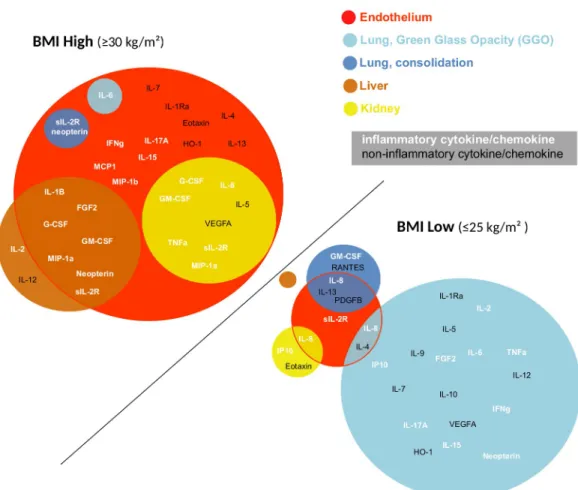
Overall, a correlation between distinct cytokine patterns and organ dysfunction was revealed in patients with obesity as compare to non-overweight patients (Fig 6).
This interaction did not appear to apply to lung damage. Contrarily, in normal weight patients, Th1/M1/inflammatory cytokines correlated with lung damage (i.e. GGO), with no obvious signs of liver, renal, or endothelial functions damage (Fig 6).
Discussion
Our study reveals distinct physiopathological mechanism associated with severe COVID-19 in patients with obesity. An association between inflammatory cytokines and liver, renal, and endothelial dysfunctions was revealed in patients with obesity. The severity of lung damage (i.e. consolidation at CT scans) correlated with BMI, but was independent of the cytokine lev-els. Contrarily, in normal weight patients, Th1/M1/inflammatory cytokines correlated with the early signs of lung damage (GGO), but without any obvious liver, renal, or endothelial dys-function. This could have significant implications for monitoring and treatment of SARS--COV2 infected patients. We did not observe significant difference between the BMI groups of biomarkers previously reported as reflects of COVID-19 inflammatory immune response such as neutrophils to lymphocytes or CD4 to CD8 ratios [29,30].
In patients with obesity, overproduction of cytokines evokes a preexisting chronic inflam-mation, since adipocytes secretion of pro-inflammatory molecules (e.g. MCP-1, IL-6, IL-18, TNF-α, IL-1β) together with a decrease of anti-inflammatory cytokines (e.g. IL-10) has been reported [31]. We did not observe any obvious difference in cytokine overproduction or immune orientation between obese and normal-weight patients in accordance with previous
Fig 4. (A) Top panel: Linear regression curves between plasma concentration of IL-6, IFNγ, TNFα, GM-CSF, and the maximum level of creatinine. Bottom panel: bar plots showing the coefficient of the Spearman correlation of IL-6, IFNγ, TNFα, and GM-CSF with the maximum level of creatinine according to BMI (BMI � 25, 25 < BMI < 30, BMI � 30;�p < 0.05;��p < 0.01,���p < 0.001). (B) The Spearman correlation heatmap depicts the negative (blue),
positive (red), and no (white) correlation between markers of kidney dysfunction (i.e. maximum creatinine, creatinine, the albumin/creatinine ratio with protein/creatinine, the Na/K ratio, and the blood cytokines levels according to BMI (BMI � 25, 25 < BMI < 30, BMI � 30).
observation [32]. A differential impact of inflammatory cytokines on liver, lung, kidney, and vascular/endothelial functions, involved in disease prognosis [33], was therefore assumed. The incidence of acute respiratory distress syndrome is increased in patients with obesity [34,35] and the effects of increased inflammatory cytokines are suspected. Here we showed that con-solidation at CT scan was clearly independent of the cytokine levels, but positively associated with BMI. Contrarily, a strong correlation was observed between inflammatory cytokines and the extent of GGO in normal-weight patients. This observation suggests distinct pathogenesis of pulmonary lesions in COVID-19 patients and their relationship with systemic inflamma-tion-related disorders. This field is of particular importance since anti-IL-6 receptor treat-ments, which attempt to reduce hyperinflammation and attenuate lung damage have shown variable levels of the efficacy in COVID19 patients [36–38].
The liver is a potential target for SARS-CoV-2 [39]. Hepatic dysfunction, seen in 14%-53% of patients with SARS-CoV-2 infection, is associated with severe disease [40]. Liver dysfunc-tion could be related to uncontrolled immune reacdysfunc-tion, cytopathic effect of the virus, and/or drug induced liver injury. SARS-Cov2 RNAemia was identical in all BMI groups as previously observed [41]. A significant correlation between liver dysfunction (AST, ALAT, TBIL, and prothrombin time) and inflammatory cytokines was solely observed in patients with obesity suggesting a preexisting liver abnormalities/sensitivity to cytokines such as TNFα involved in many forms of liver injury [16].
Acute kidney injury (AKI) has been reported to occur in 36.6% of COVID19 patients and in temporal association with respiratory failure. The mortality rate for AKI is 35% [22]. The causes of kidney involvement could be multifactorial. Besides cardio-renal syndrome, virus particles are observed in renal endothelial cells [42], tubular epithelium, and podocytes through an angiotensin converting enzyme 2-dependent pathway [43], suggesting a direct contribution of viremia to AKI. Furthermore, hyperinflammation, macrophage activation and
Fig 5. (A) Box plots illustrating the plasma levels of endothelial activation markers (IL-8, endoglin, E and P-selectins,
PIGF, Ang-2) according to BMI (BMI � 25, 25 < BMI < 30, BMI � 30). (B) The Spearman correlation heatmap depicts the negative (blue), positive (red), and no (white) correlation between plasma markers of endothelial activation and the blood cytokines levels in COVID-19 patients (n = 38) according to BMI (BMI � 25, 25 < BMI < 30, BMI � 30).
microthrombi in the context of endotheliitis have been suspected to contribute to AKI. We did not evidence correlation between viremia and the extent of AKI (r = 0.14, p = 0.35), arguing against a significant impact of SARS-CoV-2 viremia on kidney function. We showed an associ-ation between many inflammatory cytokines and kidney dysfunction, the greater part of which may be produced by activated type 1 macrophages. This association was strengthened in patients with BMI � 30.
Endothelial dysfunction has been reported as a main physiopathological feature in COVID-19, revealed by different histopathological studies [44,45] and partially explained by the high endothelial expression of angiotensin converting enzyme 2, the SARS-CoV-2 receptor [46]. Moreover, human obesity is associated with vascular endothelial dysfunction due to oxidative stress, inflammation, and the enzymatic pathways involving perivascular adipose tissue and vasculature [17,47,48]. Consistent with these studies, we observed a positive correlation between markers associated with endothelial dysfunction and BMI, suggesting that endothelii-tis may occur more frequently in patients with obesity. Accordingly, the levels of numerous inflammatory cytokines were associated with endothelial dysfunction in patients with obesity. It can be hypothesized that patients with obesity are more susceptible to the SARS-CoV-2 infection of endothelial cells and/or have sensitized endothelium more prone to microvascular lesions under inflammatory cytokines. Strikingly, dysfunction of kidney and liver in patients
Fig 6. Diagram representing the cytokines correlated with multiorgan damage of endothelial vessels, lung (consolidation and GGO), liver, and kidney in patients with obesity (BMI � 30) as compared to normal-weight patients (BMI � 25). Inflammatory cytokines are illustrated in white and noninflammatory in black.
with obesity involved a common subset of cytokines to that observed with endothelial dysfunc-tion, suggesting physiopathological similarities. Hyperinflammation observed in patients with-out obesity did not correlate with biological signs of endothelial dysfunction, but was strongly associated with the early signs of lung damage, evidenced by the occurrence of GGO on CT scans.
There are limitations to our study. First, the small number of studied patients leading to low statistical power, however, an extensive immune exploration allowed us to confirm the trends observed. Second, all patients presented with a severe form of the disease. A controlled group composed of patients who received home care or of high-risk patients who benefited from an early extensive immunomonitoring before the emergence of ARDS would have pro-vided important information to decipher mechanisms initiating the cytokinic storm. However, our results showing a comparable cytokine landscape and viremia among different BMI groups and a differential impact of hyperinflammation on vital organs functions in patients with obesity, the latter possibly due to a higher endothelial susceptibility, may help to better identify and manage patients who are at higher-risk for severe form of COVID-19.
Supporting information
S1 Table. Description of the antibodies used in flow cytometry experiments. (PDF)
S2 Table. Respiratory distress of patients without COPD. (PDF)
S3 Table. Biological characteristics. (PDF)
S4 Table. Cytokine levels in healthy donors and patients at admission. (PDF)
S5 Table. Cytokine levels at admission and correlation to BMI (as continuous variable). (PDF)
S1 Fig. Box plots illustrating a significant increase of the cytokines concentration in COVID-19 patients (n = 15) according to the level of respiratory functional status (the WHO scale). The cytokines levels of healthy donors (n = 18) are shown. The colored squares associated with each cytokine illustrate the different orientations of the immune response. (�p<0.05;��p<0.01,���p<0.001,����p<0.0001).
(PDF)
S2 Fig. Box plots illustrating the concentration of cytokines at admission according to the sex of COVID-19 patients (n = 42). Wilcoxon-MannWhitney tests used for pairwise compar-isons followed by the Benjamini Hochberg test for multiple testing correction.�P value <0.05.
(PDF)
S3 Fig. Box plots illustrating the zenith (maximum concentration) of each cytokine mea-sured from day 1 to day 14, according to the BMI levels in COVID-19 patients (n = 51). Wilcoxon-Mann-Whitney tests used for pairwise comparisons followed by the Benjamini Hochberg test for multiple testing correction.�Pvalue <0.05.
(PDF)
S4 Fig. Box plots illustrating the concentration of cytokines according to corticosteroids administration to COVID-19 patients (n = 51). Wilcoxon Mann-Whitney test used for
pairwise comparisons followed by the Benjamini Hochberg test for multiple testing correction. (PDF)
S5 Fig. (A). Percentage and absolute number (mean± standard deviation) of lymphocytes, B lymphocytes, NK cells, NK-T cells, T lymphocytes, CD4 and CD8 T cell subsets; classical, intermediate and non-classical, CD163 and CD163 monocytes. (B) Bar plots representing the percentage of different clusters identified by Excyted pipeline in COVID-19 patients according to the BMI categories (above and below the median BMI of 26.8). Exact p value is reported if significant.
(PDF)
S6 Fig. Box plots illustrating the concentration of cytokines according to HSI levels in COVID-19 patients (n = 51). Wilcoxon-Mann-Whitney test used for pairwise comparisons followed by the Benjamini Hochberg test for multiple testing correction.
(PDF)
S7 Fig. Box plots illustrating the concentration of cytokines according to the sex, age, arterial hypertension, diabetes, COPD among BMI > 30 COVID-19 patients. Wilcoxon-Mann-Whitney tests used for pairwise comparisons followed by the Benjamini Hochberg test for multiple testing correction.
(PDF) S1 Data. (XLSX)
Acknowledgments
The authors would like to thank Dr Fremeaux-Bacchi Veronique for expert advice concern-ing immune analyses and to acknowledge Magdalena Benetkiewicz (Sc.D.) for the editorial assistance.
Author Contributions
Conceptualization: Marie-Agnès Dragon-Durey, Franck Pagès.
Data curation: Marie-Agnès Dragon-Durey, Xiaoyi Chen, Etienne Charpentier, Yannick Binois, Florence Marliot, Maxime Meylan, Cle´mence Granier, He´lène Pere, Antonin Sal-dmann, Bastien Rance, Anne Sophie Jannot, Ste´phanie Baron, Mouna Chebbi, Antoine Fayol, Nathalie Josseaume, Claire Rives-Lange, Pierre-Louis Tharaux, Bernard Cholley, Jean-Luc Diehl, Jean-Benoıˆt Arlet, Michel Azizi, Alexandre Karras, Se´bastien Czernichow, David M. Smadja, Jean-Se´bastien Hulot, Isabelle Cremer, Eric Tartour, Elie Mousseaux, Franck Pagès.
Formal analysis: Xiaoyi Chen, Amos Kirilovsky, Bastien Rance, Anne Sophie Jannot. Funding acquisition: Franck Pagès.
Investigation: Nadine Ben Hamouda, Carine El Sissy, Jules Russick, Etienne Charpentier, Yannick Binois, Florence Marliot, Maxime Meylan, Cle´mence Granier, He´lène Pere, Anto-nin Saldmann, Bastien Rance, Anne Sophie Jannot, Ste´phanie Baron, Mouna Chebbi, Antoine Fayol, Nathalie Josseaume, Claire Rives-Lange, Pierre-Louis Tharaux, Bernard Cholley, Jean-Luc Diehl, Jean-Benoıˆt Arlet, Michel Azizi, Alexandre Karras, Se´bastien Czer-nichow, David M. Smadja, Jean-Se´bastien Hulot, Isabelle Cremer, Eric Tartour, Elie Mous-seaux, Franck Pagès.
Methodology: Xiaoyi Chen, Amos Kirilovsky, Nadine Ben Hamouda, Franck Pagès. Project administration: Franck Pagès.
Resources: Franck Pagès.
Supervision: Marie-Agnès Dragon-Durey, Franck Pagès.
Validation: Marie-Agnès Dragon-Durey, Xiaoyi Chen, Amos Kirilovsky, Nadine Ben Hamouda, Carine El Sissy, Jules Russick, Etienne Charpentier, Yannick Binois, Florence Marliot, Maxime Meylan, Cle´mence Granier, He´lène Pere, Antonin Saldmann, Bastien Rance, Anne Sophie Jannot, Ste´phanie Baron, Mouna Chebbi, Antoine Fayol, Nathalie Jos-seaume, Claire Rives-Lange, Pierre-Louis Tharaux, Bernard Cholley, Luc Diehl, Jean-Benoıˆt Arlet, Michel Azizi, Alexandre Karras, Se´bastien Czernichow, David M. Smadja, Jean-Se´bastien Hulot, Isabelle Cremer, Eric Tartour, Elie Mousseaux, Franck Pagès. Visualization: Xiaoyi Chen, Amos Kirilovsky, Franck Pagès.
Writing – original draft: Marie-Agnès Dragon-Durey, Franck Pagès.
Writing – review & editing: Marie-Agnès Dragon-Durey, Xiaoyi Chen, Amos Kirilovsky, Nadine Ben Hamouda, Carine El Sissy, Jules Russick, Etienne Charpentier, Yannick Binois, Florence Marliot, Maxime Meylan, Cle´mence Granier, He´lène Pere, Antonin Saldmann, Bastien Rance, Anne Sophie Jannot, Ste´phanie Baron, Mouna Chebbi, Antoine Fayol, Nathalie Josseaume, Claire Rives-Lange, Pierre-Louis Tharaux, Bernard Cholley, Jean-Luc Diehl, Jean-Benoıˆt Arlet, Michel Azizi, Alexandre Karras, Se´bastien Czernichow, David M. Smadja, Jean-Se´bastien Hulot, Isabelle Cremer, Eric Tartour, Elie Mousseaux, Franck Pagès.
References
1. Coronaviridae Study Group of the International Committee on Taxonomy of Viruses. The species Severe acute respiratory syndrome-related coronavirus: classifying 2019-nCoV and naming it SARS-CoV-2. Nat Microbiol. 2020; 5: 536–544.https://doi.org/10.1038/s41564-020-0695-zPMID:
32123347
2. Zhou P, Yang X-L, Wang X-G, Hu B, Zhang L, Zhang W, et al. A pneumonia outbreak associated with a new coronavirus of probable bat origin. Nature. 2020; 579: 270–273. https://doi.org/10.1038/s41586-020-2012-7PMID:32015507
3. Yang X, Yu Y, Xu J, Shu H, Xia J, Liu H, et al. Clinical course and outcomes of critically ill patients with SARS-CoV-2 pneumonia in Wuhan, China: a single-centered, retrospective, observational study. The Lancet Respiratory Medicine. 2020; 8: 475–481.https://doi.org/10.1016/S2213-2600(20)30079-5
PMID:32105632
4. Chatenoud L, Ferran C, Reuter A, Legendre C, Gevaert Y, Kreis H, et al. Systemic reaction to the anti-T-cell monoclonal antibody OKT3 in relation to serum levels of tumor necrosis factor and interferon-gamma [corrected]. N Engl J Med. 1989; 320: 1420–1421.https://doi.org/10.1056/
NEJM198905253202117PMID:2785642
5. Chen N, Zhou M, Dong X, Qu J, Gong F, Han Y, et al. Epidemiological and clinical characteristics of 99 cases of 2019 novel coronavirus pneumonia in Wuhan, China: a descriptive study. The Lancet. 2020; 395: 507–513.https://doi.org/10.1016/S0140-6736(20)30211-7PMID:32007143
6. Nayak A, Islam SJ, Mehta A, Ko Y-A, Patel SA, Goyal A, et al. Impact of Social Vulnerability on COVID-19 Incidence and Outcomes in the United States. medRxiv. 2020.https://doi.org/10.1101/2020.04.10. 20060962PMID:32511437
7. Onder G, Rezza G, Brusaferro S. Case-Fatality Rate and Characteristics of Patients Dying in Relation to COVID-19 in Italy. JAMA. 2020 [cited 16 Jul 2020].https://doi.org/10.1001/jama.2020.4683PMID:
32203977
8. Richardson P, Griffin I, Tucker C, Smith D, Oechsle O, Phelan A, et al. Baricitinib as potential treatment for 2019-nCoV acute respiratory disease. Lancet. 2020; 395: e30–e31. https://doi.org/10.1016/S0140-6736(20)30304-4PMID:32032529
9. Czernichow S, Beeker N, Rives-Lange C, Guerot E, Diehl J-L, Katsahian S, et al. Obesity doubles mor-tality in patients hospitalized for SARS-CoV-2 in Paris hospitals, France: a cohort study on 5795 patients. Obesity (Silver Spring). 2020.https://doi.org/10.1002/oby.23014PMID:32815621
10. Simonnet A, Chetboun M, Poissy J, Raverdy V, Noulette J, Duhamel A, et al. High Prevalence of Obe-sity in Severe Acute Respiratory Syndrome Coronavirus-2 (SARS-CoV-2) Requiring Invasive Mechani-cal Ventilation. Obesity (Silver Spring). 2020; 28: 1195–1199.https://doi.org/10.1002/oby.22831PMID:
32271993
11. Caussy C, Wallet F, Laville M, Disse E. Obesity is Associated with Severe Forms of COVID-19. Obesity (Silver Spring). 2020; 28: 1175.https://doi.org/10.1002/oby.22842PMID:32314861
12. Gao F, Zheng KI, Wang X-B, Sun Q-F, Pan K-H, Wang T-Y, et al. Obesity Is a Risk Factor for Greater COVID-19 Severity. Diabetes Care. 2020; 43: e72–e74.https://doi.org/10.2337/dc20-0682PMID:
32409499
13. Fru¨hbeck G, Baker JL, Busetto L, Dicker D, Goossens GH, Halford JCG, et al. European Association for the Study of Obesity Position Statement on the Global COVID-19 Pandemic. Obes Facts. 2020; 13: 292–296.https://doi.org/10.1159/000508082PMID:32340020
14. Ouchi N, Parker JL, Lugus JJ, Walsh K. Adipokines in inflammation and metabolic disease. Nat Rev Immunol. 2011; 11: 85–97.https://doi.org/10.1038/nri2921PMID:21252989
15. Younossi ZM, Loomba R, Anstee QM, Rinella ME, Bugianesi E, Marchesini G, et al. Diagnostic modali-ties for nonalcoholic fatty liver disease, nonalcoholic steatohepatitis, and associated fibrosis. Hepatol-ogy. 2018; 68: 349–360.https://doi.org/10.1002/hep.29721PMID:29222917
16. Kugelmas M. Cytokines and NASH: A pilot study of the effects of lifestyle modification and vitamin E. Hepatology. 2003; 38: 413–419.https://doi.org/10.1053/jhep.2003.50316PMID:12883485
17. Niederreiter L, Tilg H. Cytokines and fatty liver diseases. Liver Research. 2018; 2: 14–20.https://doi. org/10.1016/j.livres.2018.03.003
18. Lambrecht J, Tacke F. Controversies and Opportunities in the Use of Inflammatory Markers for Diagno-sis or Risk Prediction in Fatty Liver Disease. Front Immunol. 2020; 11: 634409.https://doi.org/10.3389/ fimmu.2020.634409PMID:33633748
19. Srinivas AN, Suresh D, Santhekadur PK, Suvarna D, Kumar DP. Extracellular Vesicles as Inflammatory Drivers in NAFLD. Front Immunol. 2020; 11: 627424.https://doi.org/10.3389/fimmu.2020.627424
PMID:33603757
20. Singh M, Benencia F. Inflammatory processes in obesity: focus on endothelial dysfunction and the role of adipokines as inflammatory mediators: We reviewed obesity-induced metabolic and immunological changes at the level of vasculature and emphasize on the importance of adipokines. International Reviews of Immunology. 2019; 38: 157–171.https://doi.org/10.1080/08830185.2019.1638921PMID:
31286783
21. Boettler T, Newsome PN, Mondelli MU, Maticic M, Cordero E, Cornberg M, et al. Care of patients with liver disease during the COVID-19 pandemic: EASL-ESCMID position paper. JHEP Reports. 2020; 2: 100113.https://doi.org/10.1016/j.jhepr.2020.100113PMID:32289115
22. Hirsch JS, Ng JH, Ross DW, Sharma P, Shah HH, Barnett RL, et al. Acute kidney injury in patients hos-pitalized with COVID-19. Kidney International. 2020; 98: 209–218.https://doi.org/10.1016/j.kint.2020. 05.006PMID:32416116
23. Korakas E, Ikonomidis I, Kousathana F, Balampanis K, Kountouri A, Raptis A, et al. Obesity and COVID-19: immune and metabolic derangement as a possible link to adverse clinical outcomes. Ameri-can Journal of Physiology-Endocrinology and Metabolism. 2020; 319: E105–E109.https://doi.org/10. 1152/ajpendo.00198.2020PMID:32459524
24. Liang T, Liu Z, Wu CC, Jin C, Zhao H, Wang Y, et al. Evolution of CT findings in patients with mild COVID-19 pneumonia. Eur Radiol. 2020 [cited 22 May 2020]. https://doi.org/10.1007/s00330-020-06823-8PMID:32291502
25. Bernheim A, Mei X, Huang M, Yang Y, Fayad ZA, Zhang N, et al. Chest CT Findings in Coronavirus Dis-ease-19 (COVID-19): Relationship to Duration of Infection. Radiology. 2020; 295: 200463.https://doi. org/10.1148/radiol.2020200463PMID:32077789
26. Lee SS, Park SH. Radiologic evaluation of nonalcoholic fatty liver disease. World J Gastroenterol. 2014; 20: 7392–7402.https://doi.org/10.3748/wjg.v20.i23.7392PMID:24966609
27. McInnes L, Healy J, Melville J. UMAP: Uniform Manifold Approximation and Projection for Dimension Reduction. arXiv:180203426 [cs, stat]. 2020 [cited 30 Oct 2020].http://arxiv.org/abs/1802.03426
28. Smadja DM, Gaussem P, Mauge L, Israe¨l-Biet D, Dignat-George F, Peyrard S, et al. Circulating endo-thelial cells: a new candidate biomarker of irreversible pulmonary hypertension secondary to congenital heart disease. Circulation. 2009; 119: 374–381.https://doi.org/10.1161/CIRCULATIONAHA.108. 808246PMID:19139384
29. Liu Y, Du X, Chen J, Jin Y, Peng L, Wang HHX, et al. Neutrophil-to-lymphocyte ratio as an independent risk factor for mortality in hospitalized patients with COVID-19. J Infect. 2020; 81: e6–e12.https://doi. org/10.1016/j.jinf.2020.04.002PMID:32283162
30. Wang F, Nie J, Wang H, Zhao Q, Xiong Y, Deng L, et al. Characteristics of Peripheral Lymphocyte Sub-set Alteration in COVID-19 Pneumonia. J Infect Dis. 2020; 221: 1762–1769.https://doi.org/10.1093/ infdis/jiaa150PMID:32227123
31. Cordeiro A, Costa R, Andrade N, Silva C, Canabrava N, Pena MJ, et al. Does adipose tissue inflamma-tion drive the development of non-alcoholic fatty liver disease in obesity? Clinics and Research in Hepa-tology and Gastroenterology. 2020; S2210740119302220.https://doi.org/10.1016/j.clinre.2019.10.001
PMID:32044284
32. Kooistra EJ, de Nooijer AH, Claassen WJ, Grondman I, Janssen NAF, Netea MG, et al. A higher BMI is not associated with a different immune response and disease course in critically ill COVID-19 patients. Int J Obes (Lond). 2021; 45: 687–694.https://doi.org/10.1038/s41366-021-00747-zPMID:
33495522
33. Favaloro EJ, Lippi G. Recommendations for Minimal Laboratory Testing Panels in Patients with COVID-19: Potential for Prognostic Monitoring. Semin Thromb Hemost. 2020; 46: 379–382.https://doi. org/10.1055/s-0040-1709498PMID:32279286
34. Gong MN, Bajwa EK, Thompson BT, Christiani DC. Body mass index is associated with the develop-ment of acute respiratory distress syndrome. Thorax. 2010; 65: 44–50.https://doi.org/10.1136/thx. 2009.117572PMID:19770169
35. Kang A, Sukkar L, Hockham C, Jun M, Young T, Scaria A, et al. Risk Factors for Incident Kidney Dis-ease in Older Adults: an Australian Prospective Population-Based Study. Intern Med J. 2020.https:// doi.org/10.1111/imj.15074PMID:33012112
36. Hermine O, Mariette X, Tharaux P-L, Resche-Rigon M, Porcher R, Ravaud P, et al. Effect of Tocilizu-mab vs Usual Care in Adults Hospitalized With COVID-19 and Moderate or Severe Pneumonia: A Ran-domized Clinical Trial. JAMA Intern Med. 2020.https://doi.org/10.1001/jamainternmed.2020.6820
PMID:33080017
37. Gupta S, Wang W, Hayek SS, Chan L, Mathews KS, Melamed ML, et al. Association Between Early Treatment With Tocilizumab and Mortality Among Critically Ill Patients With COVID-19. JAMA Intern Med. 2020.https://doi.org/10.1001/jamainternmed.2020.6252PMID:33080002
38. Salvarani C, Dolci G, Massari M, Merlo DF, Cavuto S, Savoldi L, et al. Effect of Tocilizumab vs Standard Care on Clinical Worsening in Patients Hospitalized With COVID-19 Pneumonia: A Random-ized Clinical Trial. JAMA Intern Med. 2020.https://doi.org/10.1001/jamainternmed.2020.6615PMID:
33080005
39. Jothimani D, Venugopal R, Abedin MF, Kaliamoorthy I, Rela M. COVID-19 and the liver. J Hepatol. 2020; 73: 1231–1240.https://doi.org/10.1016/j.jhep.2020.06.006PMID:32553666
40. Chen G, Wu D, Guo W, Cao Y, Huang D, Wang H, et al. Clinical and immunological features of severe and moderate coronavirus disease 2019. Journal of Clinical Investigation. 2020; 130: 2620–2629.
https://doi.org/10.1172/JCI137244PMID:32217835
41. Bermejo-Martin JF, Gonza´ lez-Rivera M, Almansa R, Micheloud D, Tedim AP, Domı´nguez-Gil M, et al. Viral RNA load in plasma is associated with critical illness and a dysregulated host response in COVID-19. Crit Care. 2020; 24: 691.https://doi.org/10.1186/s13054-020-03398-0PMID:33317616
42. Varga Z, Flammer AJ, Steiger P, Haberecker M, Andermatt R, Zinkernagel AS, et al. Endothelial cell infection and endotheliitis in COVID-19. Lancet. 2020; 395: 1417–1418. https://doi.org/10.1016/S0140-6736(20)30937-5PMID:32325026
43. Su H, Yang M, Wan C, Yi L-X, Tang F, Zhu H-Y, et al. Renal histopathological analysis of 26 postmor-tem findings of patients with COVID-19 in China. Kidney Int. 2020; 98: 219–227.https://doi.org/10. 1016/j.kint.2020.04.003PMID:32327202
44. Menter T, Haslbauer JD, Nienhold R, Savic S, Deigendesch H, Frank S, et al. Postmortem examination of COVID-19 patients reveals diffuse alveolar damage with severe capillary congestion and variegated findings in lungs and other organs suggesting vascular dysfunction. Histopathology. 2020.https://doi. org/10.1111/his.14134PMID:32364264
45. Carsana L, Sonzogni A, Nasr A, Rossi RS, Pellegrinelli A, Zerbi P, et al. Pulmonary post-mortem find-ings in a series of COVID-19 cases from northern Italy: a two-centre descriptive study. The Lancet Infec-tious Diseases. 2020; S1473309920304345.https://doi.org/10.1016/S1473-3099(20)30434-5PMID:
32526193
46. Zhang H, Penninger JM, Li Y, Zhong N, Slutsky AS. Angiotensin-converting enzyme 2 (ACE2) as a SARS-CoV-2 receptor: molecular mechanisms and potential therapeutic target. Intensive Care Med. 2020; 46: 586–590.https://doi.org/10.1007/s00134-020-05985-9PMID:32125455
47. Graupera M, Claret M. Endothelial Cells: New Players in Obesity and Related Metabolic Disorders. Trends Endocrinol Metab. 2018; 29: 781–794.https://doi.org/10.1016/j.tem.2018.09.003PMID:
30266200
48. Virdis A, Masi S, Colucci R, ChiriacòM, Uliana M, Puxeddu I, et al. Microvascular Endothelial Dysfunc-tion in Patients with Obesity. Curr Hypertens Rep. 2019; 21: 32. https://doi.org/10.1007/s11906-019-0930-2PMID:30949772