Publisher’s version / Version de l'éditeur:
National Research Council of Canada Aeronautical Report, 1956-01-25
READ THESE TERMS AND CONDITIONS CAREFULLY BEFORE USING THIS WEBSITE. https://nrc-publications.canada.ca/eng/copyright
Vous avez des questions? Nous pouvons vous aider. Pour communiquer directement avec un auteur, consultez la première page de la revue dans laquelle son article a été publié afin de trouver ses coordonnées. Si vous n’arrivez pas à les repérer, communiquez avec nous à PublicationsArchive-ArchivesPublications@nrc-cnrc.gc.ca.
Questions? Contact the NRC Publications Archive team at
PublicationsArchive-ArchivesPublications@nrc-cnrc.gc.ca. If you wish to email the authors directly, please see the first page of the publication for their contact information.
NRC Publications Archive
Archives des publications du CNRC
For the publisher’s version, please access the DOI link below./ Pour consulter la version de l’éditeur, utilisez le lien DOI ci-dessous.
https://doi.org/10.4224/21272069
Access and use of this website and the material on it are subject to the Terms and Conditions set forth at
Orenda P.S. 13 combustion chamber (42-in. diam.): tests at
atmospheric pressure
Prior, B. W.; Tyler, R. A.
https://publications-cnrc.canada.ca/fra/droits
L’accès à ce site Web et l’utilisation de son contenu sont assujettis aux conditions présentées dans le site LISEZ CES CONDITIONS ATTENTIVEMENT AVANT D’UTILISER CE SITE WEB.
NRC Publications Record / Notice d'Archives des publications de CNRC: https://nrc-publications.canada.ca/eng/view/object/?id=893abc94-7f66-459c-9b1b-08108fd0d4e3 https://publications-cnrc.canada.ca/fra/voir/objet/?id=893abc94-7f66-459c-9b1b-08108fd0d4e3
NA
E.
1-R.
/Sri-NATIONAL A ERONAUT ICAL ESTABLISHMENT
CANADA
LABORATORY REPORT LR - 154
SECRET
COPY NO.
ORENDA P. S. 13 COMBUSTION CHAMBER (42 -IN. DIAM.):
, TESTS AT ATMOSPHERIC PRESSURE
APR 20 1956 UPLAl'-<LS
LB•:.ARY
BY
B. W. PRIOR AND R. A. TYLER
CLASSIF I ED DOCUMENT - CONDITIONS OF RELEASE
I. THIS INFORMATION IS DISCLOSED FOR THE OFFICIAL USE. IN CANADA ONLY , OF THE RECIPIENT
ORGANIZATION AND SUCH OF ITS STAFF AS MAY BE AUTHORIZED UNDER SEAL OF SECRECY.
2. THE TRANSMISSION OUTSIDE CANADA OR REVELATION OF" THE INFORMATION IN ANY MANNER TO
AN UNAUTHORIZED PERSON WOULD BE A BREACH OF THE SECURITY REGULATIONS OF THE
GOVERNMENT OF CANADA .
OTTAWA
NATIO NAL AERONAU'l'ICAL ES'I'ABLISHMENT Canada
LABORATORY REPORT Gas Dynamics Section
Pages - Preface Text Appendix Figures 5 24 5 32
For: Orenda Engines Limited.
SECRET
Laboratory Report: LR-154
Date: 25 January 1956
Lab. Order: 106-16A
File: BM49-7-18
Reference: Minutes of the joint meeting of A.V. Roe Canada
Ltd. and N.A.E. at Ottawa, June 23, 1954.
Subject: ORENDA P.S. 13 COMBUSTION CHAMBER (42-IN. DIAM.):
TESTS AT ATMOSPHERIC PRESSURE
Prepared by: B.W. Prior and R.A. Tyler
Submitted by: A.J. Bachmeier
Laboratory Head Approved by: SUMMARY D.C. MacPhail Section Head J.H. Parkin Director
An Orenda P.S. 13 annular, vaporizing combustion chamber having a 42-in. diam. air casing has been tested at
atmospheric pressure without preheat. The following matters
were investigated: pressure loss, weak stability limits,
weak ignition limits, outlet temperature distribution, flame pattern, combustion roughness including its causes and effects,
Page - ( ii) LR-154
mechanical failures, carbon deposition, distortion due to overheating.
In most respects the performance of the combustor was satisfactory o However the cold pressure loss appeared
high (27 combustor q Gウセス@ at the design velocity of 109 ft.jsect)
and the outlet temperature distribution appeared to require improvement.
セ@.. ( q = PV
2
2
where p = combustor inlet air density based on measured
inlet total temperature and total pressure
v
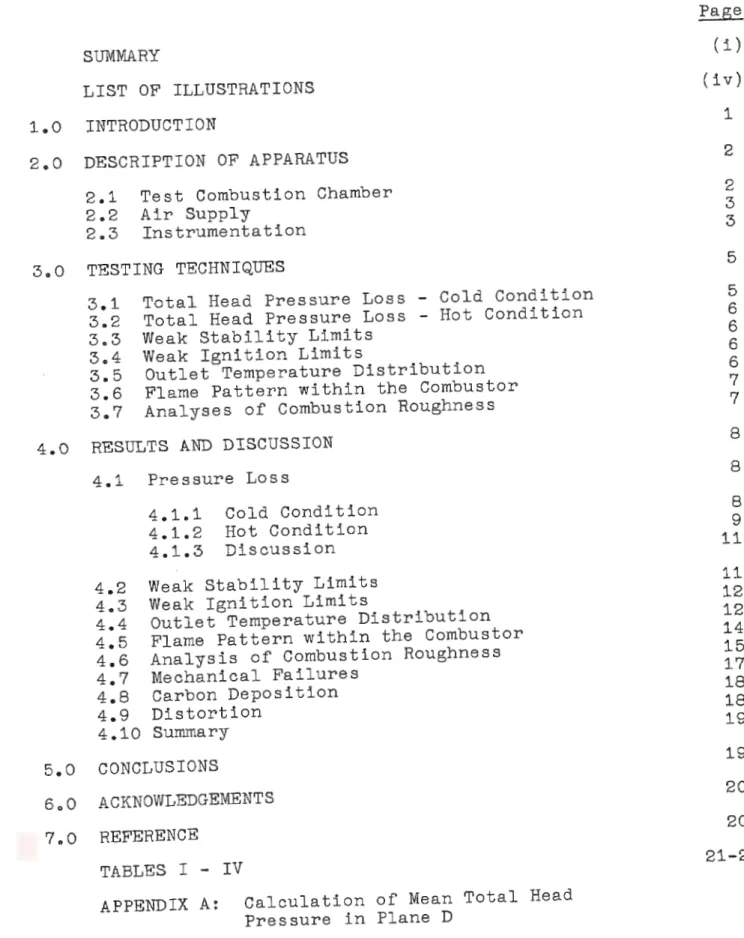
= combustor velocity based on maximum flow area.TABLE OF CONTENTS SUMMARY LIST OF ILLUSTRATIONS 1.0 INTRODUCTION 2.0 DESCRIPTION OF APPARATUS 3.0 2.1 2.2 2.3
Test Combustion Chamber Air Supply Instrumentation TESTING TECHNIQUES 3.1 3.2 3o3 3o4 3.5 3.6 3.7
Total Head Pressure Loss - Cold Condition Total Head Pressure Loss - Hot Condition Weak Stability Limits
Weak Ignition Limits
Outlet Temperature Distribution Flame Pattern within the Combustor Analyses of Combustion Roughness
4.0 RESULTS AND DISCUSSION
4.1 Pressure Loss 4.2 4.3 4.4 4.5 4.6 4.7 4.8 4.9 4.10 4.1.1 4.1.2 4.1.3 Cold Condition Hot Condition Discussion Weak Stability Limits Weak Ignition Limits
Outlet Temperature Distribution Flame Pattern within the Combustor Analysis of Combustion Roughness Mechanical Failures Carbon Deposition Distortion Summary 5.0 CONCLUSIONS ACKNOWLEDGEMENTS REFERENCE TABLES I - IV
APPENDIX A: Calculation of Mean Total Head
Pressure in Plane D Page - (iii) LR-154 ( i ) (iv) 1 2 2 3 3 5 5 6 6 6 6 7 7 8 8 8 9 11 11 12 12 14 15 17 18 18 19 19 20 20 21-25
Page - ( iv) LR -154
LIST OF ILLUSTRATIONS
Diagrammatic longitudinal section through P.S. 13
annular vaporizing combustor
Flame tube of P.S. 13 annular vaporizing combustor P9S. 13 annular vaporizing combustor - atmospheric pressure test rig with instrumentation installed Block diagram of combustion roughness analysing
equipment
Total head pressure distributions, Quadrants No. 1, 2, 3, 4
Total pressure loss between planes B and D and be-tween planes D and 0 as a percentage of the inlet pressure in each case:
screen in place screen removed
Totgl prGDDuro loaa 「ッエセッッョ@ planoo B and D a n a
be-tween planes . D and 0 in terms of combustor nominal q:
screen in place screen removed Weak stability limits:
screen in place screen removed Weak ignition limits:
screen in place screen removed Outlet temperature distributions
.. ... ·. セ@ ᄋᄋZセ O@ .. · .. : Figure 1 2 3 4 5a-d 6 7 8 9 10 1 1 12,13 14,15 16-20
セスLMャャゥエャ」セセM
MN⦅Z M{Gセ@
::. ; .;
ZB セ@
·
--:.. . --- .LIST OF ILLUSTRA'I' IONS (CON 1' 'D)
Ideal outlet temperature profile
Panoramic wave analyser traces from accelerometer attached to flame tube
Panoramic wave analyser traces from microphone Panoramic wave analyser traces from transducer
in fuel line
Analysis of combustor flame tube wall transverse vibra-cions
Analysis of combustor noise
Cracks in weld on inner wall of snout Cracks in weld on outer wall of snout
Carbon deposition on base plate, vaporizer tubes, etc.
Semi-quantitative summary.of イセウセャエウ@ of tests stability limits, ignit1on ャQュWエウL N ヲャ。セ・@
patterns, outlet temperature d1str1but1ons, and combustion roughness
on
Pressure readings from hole No. 1 of total head rake in Quadrants No. 1 and 3, セャ。ョ・@ D, when rake withdrawn in steps of 1/8 1n.
Example of total and static pressure profiles, p l a ne D Pa g e - ( v) LR-154 Figure_ 21 22 23 24 25 26 27a 2'7b 28,29 30 A-1 A-2
. . . . . セ@ . --.. -- --:- --... --MMセM Z]セセ M Zセ ] セ@
.:·:.:.:::::: __
M MM ] M M セMM MN@ MMセセ セ Z セセM][ ZZ@ .. . ᄋMセセZ ᄋ@ ⦅ Z Z NセZZ@-..._
-.. .._
... Page - 1 LR -154OREtJl)A P.S. 13 COMBUSTION CHAMBER (42-IN. DIAM.) セ@
TESTS AT ATMOSPHERIC PRESSURE
1.0 I NTRODUCTION
An Orenda P.S. 13 annular, vaporizing combustion chamber having a 42-in. diam. air casing has been tested at atmospheric pressure by the NoA.E. at the request of Orenda
Engines Limited. The flame tube was built to aircraft
standards, whereas the fuel system, air casing, and other ancillary equipment (with the exception of the ignition
system) were especially constructed for rig testing. The
air casing is suitable for testing at both atmospheric and sub-atmospheric pressures which are available with the
nセaッeッ@ facilities. The internal geometry is, however, identical with that which would be employed in a combustor to be installed in the engine, so that the aerodynami c and combustion aspects of the test results could be applied to such a combustor.
The complete base plate of the flame tube, includ-ing stiffeninclud-ing ridges, was stamped out of relatively light
sheet metalo This was an innovation and some interest
attached to its mechanical performance.
The primary fuel manifold was supported within the snout of the flame tube and the seven primary jets were s c re wed i n to fittings in the manifold, terminating at holes through
t he b as e plate. The main fuel manifold was external t o t h e
combust or and 32 main jets protruded through the air c a sing and out e r wall of the snout t o terminate at the upstre am e n ds of the v aporizing tubes. Except for the numbers of pr i mary a nd main fuel jets and the points at which they terminat e d thes e f uel sys t em arrangement s were not those to be insta lled in the e ng i ne.
The f ollowing tests were performed on the 」ッュ「オウエッ イセ@
(1 ) Determinat ion of the total head pressure loss unde r
hot and cold cond i t i ons
(2) Meas u reme nts of the weak stability and ignition
limit s
Page - 2 LR-154
(4) Studies of the flame patterns within the combustor (5) Studies of combustion roughness by analyses of the noise emitted by the . combustor, some of the mechanical vibra-tion modes of the flame tube, and the pressure pulsavibra-tions in the fuel supply to the combustor.
In addition to these specific tests attention was given to the following points throughout the test programme:
(1) Mechanical failures of components
(2) (3)
Carbon deposition within the flame tube
Distortion of the flame tube due to local overheatinl 2.0 DESCRIPTION OF APPARATUS
2.1 Test Combustion Chamber
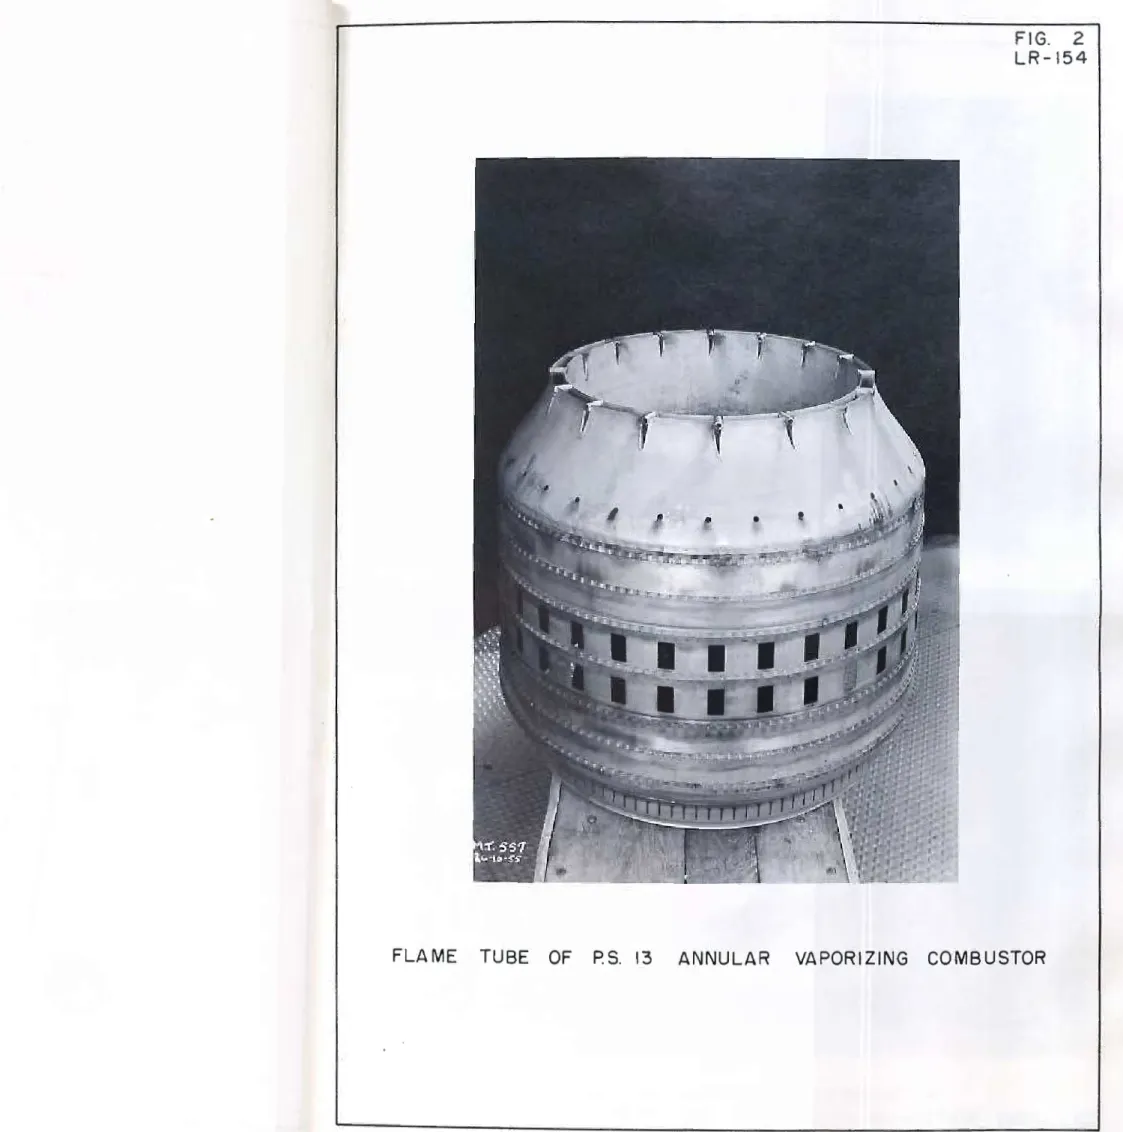
A diagrammatic longitudinal t combustor is shown in Figure
1 d sec ion through the tube is shown in Figure 2 • ' an a photograph of the flame
Each main fuel jet c · t
followed by a plain tube onsls s of a metering orifice by the flow of air past
エィAョAョセオ・ゥ@
セセッュゥコ。エゥッョ@
being effected of the 32 main fuel J·ets 0 e tube. The flow numbers 1 12 t 1 2 were measured and f u d t• 0 o 9. They were install d . 0
n
o vary from to make the fuel distribut· e 7n the combustor so aslon as unlform as possible. Each primary fu 1 · t
atomizer. e Je terminates in a small swirl The 16 large vanes A
supporting the flame tube
t'
t
perform the functionsor
ウキゥイセ@
from the air enterinsセセセ@
urally and of removing theremalns in the air as it lg combustor. This swirl the compressor so that it :aves the tenth stage stators of test combustor a row of
カ。ョAセ@
セセ」・セウ。Zケ@
to install in the rows of vanes Band C ro lmu.atlng these stators air entering theエ・ョエィーウエセオ」・@
a swlrl simulating thatセヲ@
セセ・@
ge compressor stators. e The screen is remov bl
of wire gauze in series af e and consists of two . the other of 4 mesh with on05eoo · 16
セ・ウィ@
with .018-in Pleces• -ln. Wlre • • wire and
Pag e - 3 LR-15 4
Two high energy igniter plugs were installed in the chamber to protrude approximately 1/4 in. from the flame tube wal l immediately downstream of the base plate, ea ch plug being approximately 45 degrees from the bottom of the chamber. Two of the primary jets terminated immediately upstream of the spark plugs. The spark plugs were energized by an exciter
box of the type currently being used on Orenda engines (24 volts, 12 joules).
2.2 Air Supply
In order to obtain sufficient air mass flow to produce the combustor design velocity it was necessary to use the avai. able supply (31 lbojsec. at 1 00 p.s.ioa.) to drive an injector drawing secondary air from the atmosphere and supply the total. combined air flow to the combustor. Control of the combustor air flow was obtained by throttling the compressor inlet, t hus varying the pressure upstream of the injector prima:r>y nozzle.. No independent control over the combustor inlet pressure and temperature was 。セ。ゥャ。「ャ・N@ The pressure キ。セ@
always approximately atmospherJ. c and the temperature var1ed in the range 50 to ·1 00°C.
Considerable development work was necessary to obtain a total head pressure distribution at outlet of the injector mixing pipe which was satisfactorily flat and steady, and to reduce the noise emitted by the primary ョッコセャ・セ@
A satisfactory outlet total pressure distribution was obta1ned. by keeping the secondary air inlet 」ャ・セイ@ of obstructions,
c arefully centring the primary nozzle lD the se?ondary aj.r inlet, and by providing sufficient mix i ng p i pe length.
The noise emitted by the p rimary nozzle WJas somewhat re duced by replacing the original conical.nozzle キゥエセ@ セ M」 ッョ ᆳ verging-diverging arrangement , but the no1se level st ill remained uncomfortably higho
2o3 Instrumentation
The instrumentation planes B, D, O, and Z are indi0ated on Figure セ ッ@ Figure 3 is a pho tograph ッセ@ エィセ@
c ombustor rig show:i. 1g all the rig instrumentat1.on ln pJ.ace •
A description of the instrumentat i on installeg in ea ch of the fou r planes followsg (in planes bセ@ D, and ' each of the four quadrant s are ident ic ally i nstrumented, the
· · th · h t l ook = quadrants being numbe red c lo c kw1se from e upper r1g .,
ing downstream. )
---- .. ·
..
Page - 4 LR-154
Plane B - One static wall tapping, 1/8-in. diam., in the annulus outer wall of each quadrant.
. . One total head pressure rake, with seven holes at
1/2-ln. 1ncrements of radius in each quadrant. The inner and
outer holes are each 0.54 in, from the adjacent walls the
annulus width at plane B being 4.08 in. '
Plane
D -
One static wall tapping,セPXYMゥョN@
diam . , in theannulus outer wall of each quadrant.
One total head pressure rake with six holes placed
at the centres of equal area annuli in each quadrant, These
rakes are rotated 30 degrees from the axial direction in order to
ィ。カセ@
app:oximately zero yaw angle with respect to the air flow dlrect1on in this plane.1 One stagnation thermocouple rake with six
thermo-セセセセイZセエーャ。セセセウAエイエセ・@
centres of equal area annuli in eachaxial di;ection.
HaセセオZセセケ。セセッ@
セセエ。エ・、@
30 degrees from theセPXU@ in. downstream from th e ermocouples are about
rakes, but this distance ise
ィエッャ・セ@
ッセ@
セィ・@
total pressureno s1gn1f1cant.)
Plane 0 - For cold pressure loss tests:
One static wall tapping 1/16-in. d.
wall of each quadrant. ' lam., in the outer
One averaging total head .
0.9 in. apart in each quadrant T rake Wlth three holes
at the centre of the annulus. • he centre hole was ーャ。セ・、@
For hot running:
One radially traversin st .
remotely operated installed i g agnatlon thermocouple
, n one quadrant at a t. ,
Pl lme.
ane
Z -
One stagnation thermocou le 2 .wall at top and at bottom of the dp t uc • ln. from the outer
Further instrumentation for the noise and
Vibration analyses:
. An accelerometer was used to .
Vlbrations of the flame tube Th Plck up mechanic 1
(shown in Fig. 1) · • e accelerometer t a
lS a tube passing throu h a tachment
g a hole in th a e a1r -·
...
セヲエゥヲィww
セ ]MM MM⦅@
=[セ M
--Page セ@ 5 LR - 154casing and welded to the flame tube. The accelerometer was
mounted so that only vertical movement of the tube was de t:ected and thus only transverse vibrations of the flame tube wall.,
A pressure transducer was used to pick up pressure ッウ」ゥャャ。 セ@
tions in the main fuel line. It was installed at two posi =
tions, one in the fuel line just ahead of the manifold and
the other just after the pumps. A muffled microphone was used
to pick up combustor noise. The microphone was positioned
about 8 ft. from the axis of the combustor, 3 ft. above the ground, and in the plane of the main fuel injectors.
The signals from the a ccelerometer, transducer and microphone were analysed by a panoramic wave analyser and photographs of the traces on the analyser screen were taken
with a SUセュュN@ camera. A block diagram of the equipment layout
is shown in Figure 4. Fuel flow:
The main and primary fuel flows were measured with a combination of an orifice plate and a rotameter.
3o0 TESTING TECHNIQUES
3o1 Total Head Pressure Loss セ@ Cold Condition
The total head pressure loss of the combus t or with = out c ombustion tak i ng place was measured over a range of a ir mass flows with and without the screen in place ahead of the
combus to ro The screen was removed i n order to i ncrease the
attain able maximum combustor veloc i ty, but; thi s ne ces s itated c hecking the effect on the inlet p ress ure d i stribution!' p res -· sure loss, and stab ilit y and i gni ti on limit so
As mentioned above, t he mass f l ow wa s cont rolled b y
t h rott;J.ing the compress o r i n let on l y ., Ca lculation o:f the a -.:r·
mass flo w wa s based on the press ure measur ements i n plane B
and the total temperature measurement s in plane
D.
The l os s o f total pressure was obtained from the
measurement of t o tal pres sure in plane s B, D, and Oo
The t otal head pressure rakes in planes.B and 0
were rota t ed in order to find the position where セ ィ・@ readings
were a maximumo This was f ound t o o cc ur when the ho l es f'a c ed
virt ually s trai ght upst re amo Cons e quently, the probes were
Page - 6
lrセQUT@
A nominal combustor velocity was obtained based on
the air mass flow the total pressure and temperature in
plane D, and the full air casing internal
」イッウウセウ・」エゥッョ。ャ@
area.3.2 Total Head Pressure Loss - Hot Condition
No specific tests were performed to measure directly the total head pressure loss with combustion taking place
because the total head pressure probes in plane 0 could not
be used under these conditions. However, this loss was calcu
-lated from information obtained in other tests under hot and cold conditions.
3.3 Weak Stability Limits
The weak stability limits of the combustor were measured over a range of combustor nominal velocities with
and without the screen. An approximation of a chosen velocity,
with combustion occurring, could be obtained by adjustment of
the mass flow, and then measured accurately. The fuel flow
was then reduced until an observer looking upstream into the combustor outlet signalled that the first vaporizer tube
(inv a riably one at the top of the combustor) had blown out,
whereupon the fuel flow was read. The fuel flow was further
reduced until the last vaporizer tube had blown out and the
fuel flow read again. During reduction of the fuel flow the
air mass flow remained very steady.
3 . 4 Weak Ignition Limits
The maximum velocity at which ignition of the
chamber could be effected was determined for main fuel flows of 500, 1000, and 1500 lb .. jhr., and primary fuel pressures (at t he ma nifold) of O, 30, 50, and 100 p.s.i.g. with and without t he screen.
The procedure was to switch on the ignition system the pr i mary f uel, and the main fuel at 3-sec. intervals and ' to wait a maximum of 15 sec. for ignition of the fuel to
o c c ur. If ignition occurred the test was repeated and three
c ons ec u t ive ignitions were necessary to constitute a 11light
ーッセョエBN@ The velocity was then raised in steps of 。ーーイックゥセ@
ュ。エ・ セケ@ 5 ft.jsec. and measured at each condition, until a
c ond1tion was reached where three consecutive ignitions could no t be obtained, th i s constituting a "no-light pointrr.
3.5 Outlet Temperature Distribution
The outlet temperature distribution was measured
Page = 7
LR =1 54 with the traversing stagnation thermocouple at velocities of
approximately 70, 80, 90, 100 and 110 f t .jsec. and ヲオ・ャェ。 ゥ セ@
ratios of approximately .004, .008, .0-12, .0 16 , and .020 , t h e
sc reen being in place in all cases. Since only one t raversing
ge ar was available it was necessary to install it i n one
quad ran t at a time so tha t each test, consist i ng of a 」ッュ「ゥョN。セ@
t i on of one pair of the above condi ti ons, had to be repeat ed
fo ur times. Each r e peat test consisted of one travers e
radially inwards and one outwards, measurement of ve l o city , and measurement of fuel flow.
3a6 Flame Pa ttern within the Combustor
Concurrently with the measurement of outlet tempe ra = ture distribution, observations of the appearan ce of the fl ame within the combustor were made by an observer looking i nt o t h e
outlet from downstream. These observat ions were recorded as
brief d e scriptions of the dispos i tion of blue and yellow flame . 3.7 Analyses of Combustion Roughness
For all tests concerned with the analysis of t he noise and the flame tube vibrations the combustor was operated at the maximum velocity obtainable (approx imat ely 110 f t . jsec .)
with the screen in place. Fuel/air ratios of 0, .004, .008,
.012, .. 016, and .020 were employed.
The following procedure was followed for tests a t
each of the above conditions. The ana lyser was first c al i.=
brated using the audio osc il la tor . The s ignal from the
micro pho n e was then applied to t he ana lyser and a phot og raph
of the analyser s creen take n. Th is was r epeated once . The
signa l f r om the a ccelerometer was then app lie d to the ana l y :s e ·r·
and a p hotograph of the s c r een t ake n . This also was repea ed
once .
The ana l ysis of pressure os cill ations i n the fue l
line wa s made with the trans duc er in two locati ons as men· i o .. Bd
ab ove , one lose to the comb ustor, ·h e other close t o t he
pu.rnps. With the t ransduce r clo se to t he pumps it was po ssib le'
to pump fuel around the loop c ircui t s using either of t h e エ キ Zセ@
pumps available in 2uch a way that all. fuel pass e d t h rough the sect io n o f l ine containi ng t h e transducer but no ne flo wed
t o the combustor . Wi th t he tr ansduc er c lose t o the combus tor
a ll fuel f lowing thr ough t h e main f u el jets passed t hro ugh the line containing the t ransdu cer .
Page - 8 LR-154
Three tests were done. In each case the analyser
was calibrated first, then the signal from the transducer was applied to the analyser and a photograph was taken of the
screen. In the first test the transducer was close to the
combustor which was operating using pump No . 1 at a condition where combustion hum (to be discussed later) was occurring and the main fuel pressure was 100 p.s.i., the maximum allowed by
the transducer operating limits. In the second test the エイ。ョウセ@
du c er was close to the pumps, the combustor was not operating,
but pump No. 1 was running. The third test was the same as
the second except that pump No. 2 was running .
The analyser screen displays panoramically the
Fourier analysis of the signal into frequencies between 0 and
1000 cyclesjsec. The oscilloscope takes 3 sec. to make one
sweep during which the analysis is displayed. Each photograph
was e x posed for 30 sec. so that ten sweeps were superimposed
on each., This procedure showed up the presence of strongly
dominant frequencies very clearly and eliminated errors which might have been caused by spurious frequencies occurring on
one sweep only.
4.0 RESULTS AND DISCUSSION
4.1 Pressure Loss
4 .1 .1 Cold Condition
The total pressure measurements in plane B with and
witho ut the screen are plotted i n Figure 5. Six only of t he
'11 ma s s flow conditions measured wi thout the screen are plo tt ed.
S i n ce in all cases the total pressure profile is qui t e fl at the mean pressure in plane B has b e en taken as t he a r ithmetic average of the 28 readings from the four rakes.
The me an static pressure for the plane was take n as the average
oi' the four readings from the wall taps in each case.
It will be noted that after the screen was removed t h e t otal pres sure in quadrant No. 3 was invariably lower than
i n t h e othe r three quadrants. To check whether this was due
to the prob e it was interchanged with the one i n quadrant
No. 1 and a te st repeated. The probe in quadrant No. 3
c ontinued to give low total pressure readings from which it wa s concluded that the velocity in the vi c ini ty of the quadrant
nッ セ@ 3 probe was low. Although this low v e locity region may
Page セ@ 9
lr セゥ@ 54
have b e en s mall, so that the reading s should h a v e be en given less wei ght in the averagin g than the o the rs, t here was no evi denc e to i n dicate this a nd it was d ecided t o g i v e a l l re ad i ngs e q u al weight.
Since these mea s urements were performe d i t has b een fou n d that the swirl ang le in plane D varies c onsiderably ac ross the annulus from t he value o f 30 degree s a t wh i c h the
p lane D probes were set. The effect of v ary ing sw irl on the
t otal pressure readings is ser ious but the effe c t on the
stagnation temperature is small, and i n fact t h e the r moc ouple r eadings varied only slightly in both r a dial and cir cumfe r ent i a l.
directions. Consequently the mean stagnat i on temperature in
plan e D was taken as the arithmeti c average of the 24 エィ・イュッ セ ᄋ@
c ouple re a dings (see Table II).
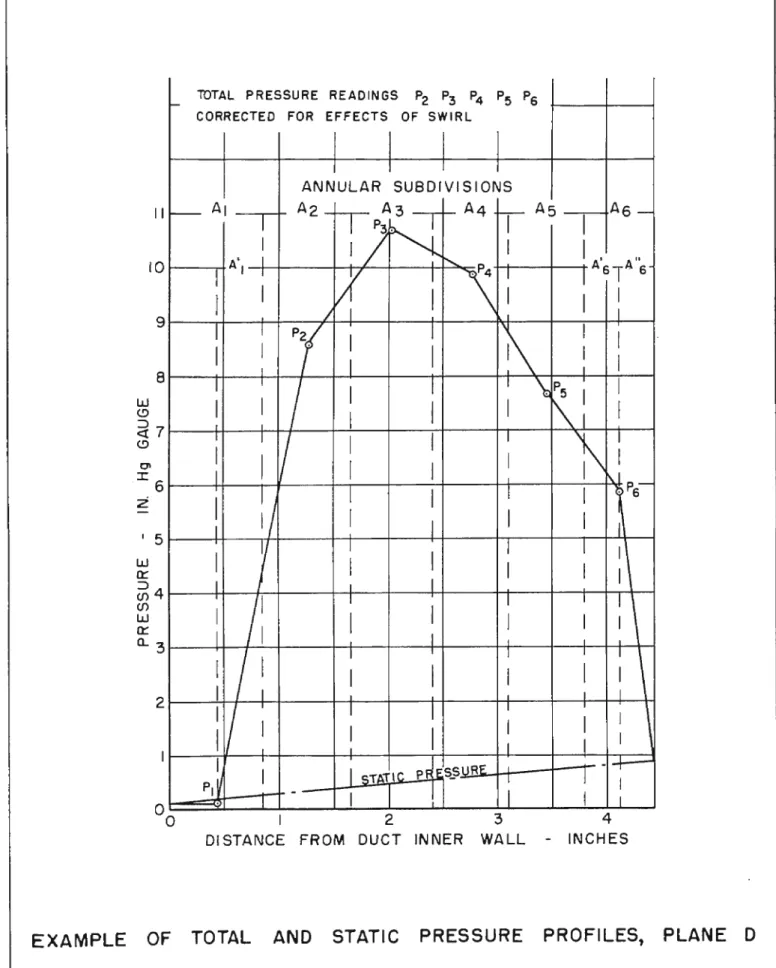
The readings from the total head pre ssure rake s i n plane D are tabulated in Table I. Thes e were not plott e d
b e c ause unl i ke plane B, i ndivi dua l r e ad i ngs were no t v a l u e s
of total pressure at that poin t . The me thod of c al culatin g a
representat i ve mean to t al head pressure in plane D from t h e r e adings obtained is described in Append i x Ae
The mean total and stati c pressur es i n p l ane 0 were taken as the averages of the v alues in t h e fou r quad r ant s a t e ach condition.
Table II summariz es the meas u re ment s in planes B, D, and 0 and the cal culati ons o f mass f low, combust or n omj_nal
PV
2velocit y, a nd c omb u s t or nominal q wh ere q =-
-2-,
p = total d e nsi ty at plane D b ased on me as ure d tota.l
pres s ure and temperature V - combustor· nomi n a l velocity
Pres sure los ses be tween planes B and D and planes D and 0 in te rms of' percent a ge of in let total pre ssure i n e a c h c ase and in terms o f q are plo tte d in Figu re s 6 , 7 , 8 a nd 9 .
4 . '1 . 2 Ho t Cond i tion
Th e r es u lts of t h e c old p ressur'e loss test s and t h e
outlet t emper a ture dis tr ib u tio n tests were セウ・、@ to c a l cula te
Page - 10 LR - 154
The total pressure at plane 0 was obtained from the
t t 1 essure at plane Z (calculated using the measured air
0
a
ヲャセキ@
and averaged exit temperature) and an estimatedmass re loss in the exit diffuser between planes 0 and Z
bpresdsu n the cold loss in this section corrected for the ase 0
ゥョセ@
• 1 · t f b t ·
d temperature. Th1s oss 1n erms o com us or q lS
crease · ·t t• t • h l•ttl
small (approx. 1/2 q) and errors 1n 1 s es 1ma 1on ave 1 e
effect on the overall hot pressure loss.
The total pressure at plane D was not measured
during the outlet temperature distribution tests. Thus, エセ@
bt in its value it was necessary to calculate the loss bevween
P
Q
。セ・ウ@
Band D. This was done by assuming that for a givenセャ。ョ・@
B velocity, the loss in terms of q in plane B wasindependent of fuel/air イセエセッL@ and was therefore equal to that
measured in the cold cond1t1on.
From the total pressure at plane D the combustor
nominal velocity and q were obtained. For a given combustor
velocity the incremental pressure loss due to combustion in terms of combustor q was assumed to depend on the temperature rise according to the relation:
セー@
_ coldqloss) T
comb. =(hot qloss =
K
(T: - 1)
q
whe re K = a constant
To = combustor outlet temperature (plane 0)
TD
-
combustor inlet temperature (plane D)A summary of the hot pressure loss calculati.ons i s given in Table III from which the mean value for K of 4o36 is obtained.
The symbols used to designate the tests have the f ollowing meanings:
a
B Q. D ENominal velocity, ft.jsec. 70 80 90 100 110
1
2 3 4 5Nominal fuel/air ratio *004 .008 .012 .016 • 020
Page - 1 1 LR-154
The tests tabulated in Table III are those in which the outlet temperature distribution was measured in all four
quadrants. At other combinations of velocity and fuel/air
ratio the distribution was measured in one or more quadrants but the results were not considered useful and have not been included.
4.1.3 Discussion
The cold pressure loss at the design velocity of 109 ft.jsec. is 14.5 percent or 27.0 q (averaged from the
values with and without the screen). The results of the
cold and hot pressure loss tests can be extrapolated to the engine maximum condition where the combustor inlet tempera-ture is about 570°K. and the outlet temperatempera-ture is 1300°Ko to give a pressure loss of 11 percent or 32 q.
The non-dimensional pressure loss (32) is relatively high by normal standards (25 - 30), particularly in view of the high design velocity employed in this combustor, the
combination of factors resulting in a .high percentage pressure loss on the engine (11 percent cf. about 5 percent normal), leading to a gross thrust penalty of roughly 5 percent.
The effect of the screen on the total pressure
distributions in planes Band Dis small though not negligibleo It is considered reasonable however to employ the same averag-ing methods both with and without the screen to obtain the mean total pressure in planes B and D.
4.2 Weak Stability Limits
The results of the weak stability limit tests are plotted in terms of air/fuel ratio against velocity with the screen in place in Figure 10 and with the screen removed in
Figure 11. (It should be pointed out that a vaporizer tube
n e ar the top of the combustor is invariably extinguished first because of the relatively lower fuel static head which causes
a lower fuel flow.)
Removal of the screen had virtually no effect on the air/fuel ratio at which the first vaporizer tube was extinguished for velocities of 95 ft9jsec. and greater.
However, the air/fuel ratio at which the last vaporizer tube was extinguished in the same velocity range appears to have
been definitely lowere d. This may be a real effect of change
in the inlet air distribution since the last tube to be ex-tinguished burns with a very feeble flame, or it may simply represent scatter in the results •
Page - 12 LR-154
The weak stability limit air/fuel ratio is about what
one would expect for a vaporizing combustor. For instance, in
Reference 1 where a very similar combustor test was described, the limit at a velocity of 80 ft.jsec. was 400 when the inlet pressure was 26 in. Hg abs. Extrapolating the results of Reference 1 and the present results to the same pressure and
velocity conditions would result in about the same weak stability limit air/fuel ratio.
4.3 Weak Ignition Limits
The results of the weak ignition limit tests with the screen in place are plotted in Figure 12 in terms of
velocity against primary fuel pressure for different main fuel flows, and are cross-plotted in Figure 13 in terms of velocity against main fuel flow for different primary fuel pressures. The results with the screen removed are plotted in the same terms in Figures 14 and 15.
Removal of the screen seems to have reduced the limiting ignition velocity at most combinations of main and
primary fuel flows. However in at least one case (namely no
primary fuel and 1000 lb./hr. main fuel) the limit has been
raised by 5 ft.jsec. It is thus impossible to draw any
con-clusion. In fact the primary fuel and ignition arrangements
are in too tentative a state to allow any worthwhile comparison with other systems or conclusions as to their effe.ctiveness.
From Figure 30 it can be saen that the ignition limit curves at primary fuel pressures of 50 and 100 p.s.i. e xtend into the weak extinction regions of the combustor.
Presumably, if the primary fuel were turned off after ignition had be e n accomplished in these regions one or more of the
vaporizer tubes would be automatically exting uished, but no tests were conducted to test the c o rr e ctne ss of this predic-t i on.
4 .4 Outlet Temperature Distribution
Since, for a given combination of nominal velocity
and fuel/air ratio, four separate エ・ウエセ@ had to be made in
order to obtain outlet temperature traverses in the four quadrants, the measured results from the four quadrants are not directly comparable from the point of view of determining
the circumferential temperature distribution . The measured
results were therefore corrected for the effects of variation i n the actual fuel/air ratio and the inlet temperature, the
Page - 13 LR -154 two quantities which would have the greatest effect on the
outlet temperature. The measured outlet temperatures were
corrected to a common standard inlet temperature and fuel/ air ratio by a degree per degree correction based on the difference between the actual inlet temperature and the
standard temperature in the first case, and on the difference between the theoretical temperature rises corresponding to
the actual fuel/air ratio and the standard fuel/air ratio in
the second case. The standard inlet temperature and fuel/air
ratio were taken to be the arithmetic means of the actual
values. Since, of course, the actual values all apply to the
same nominal condition these corrections were small.
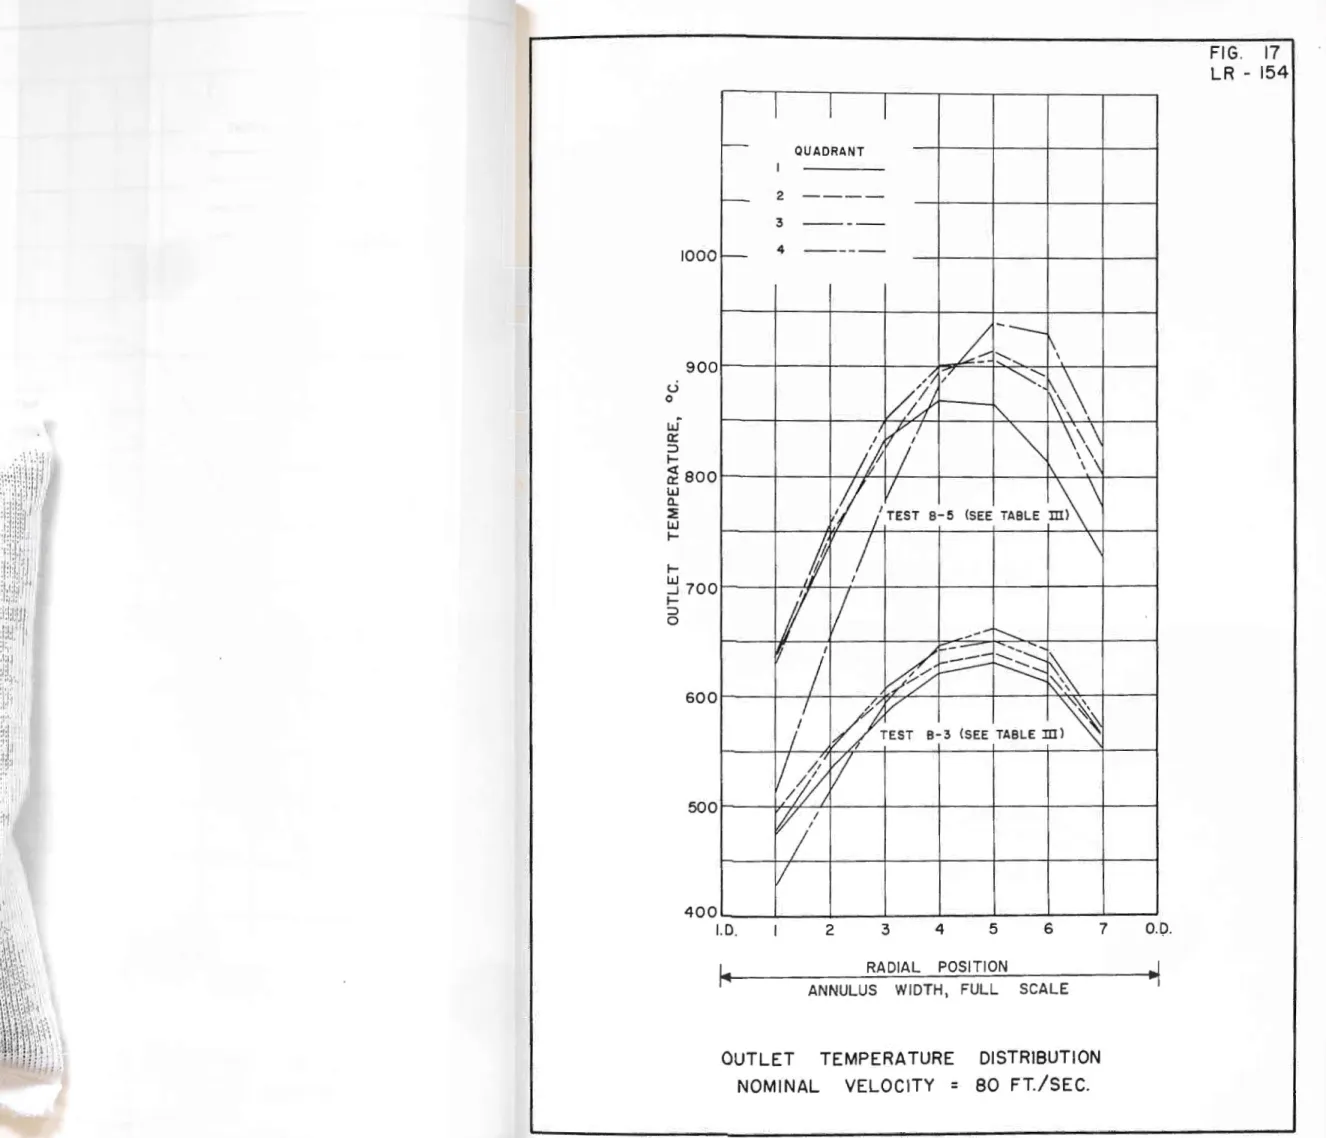
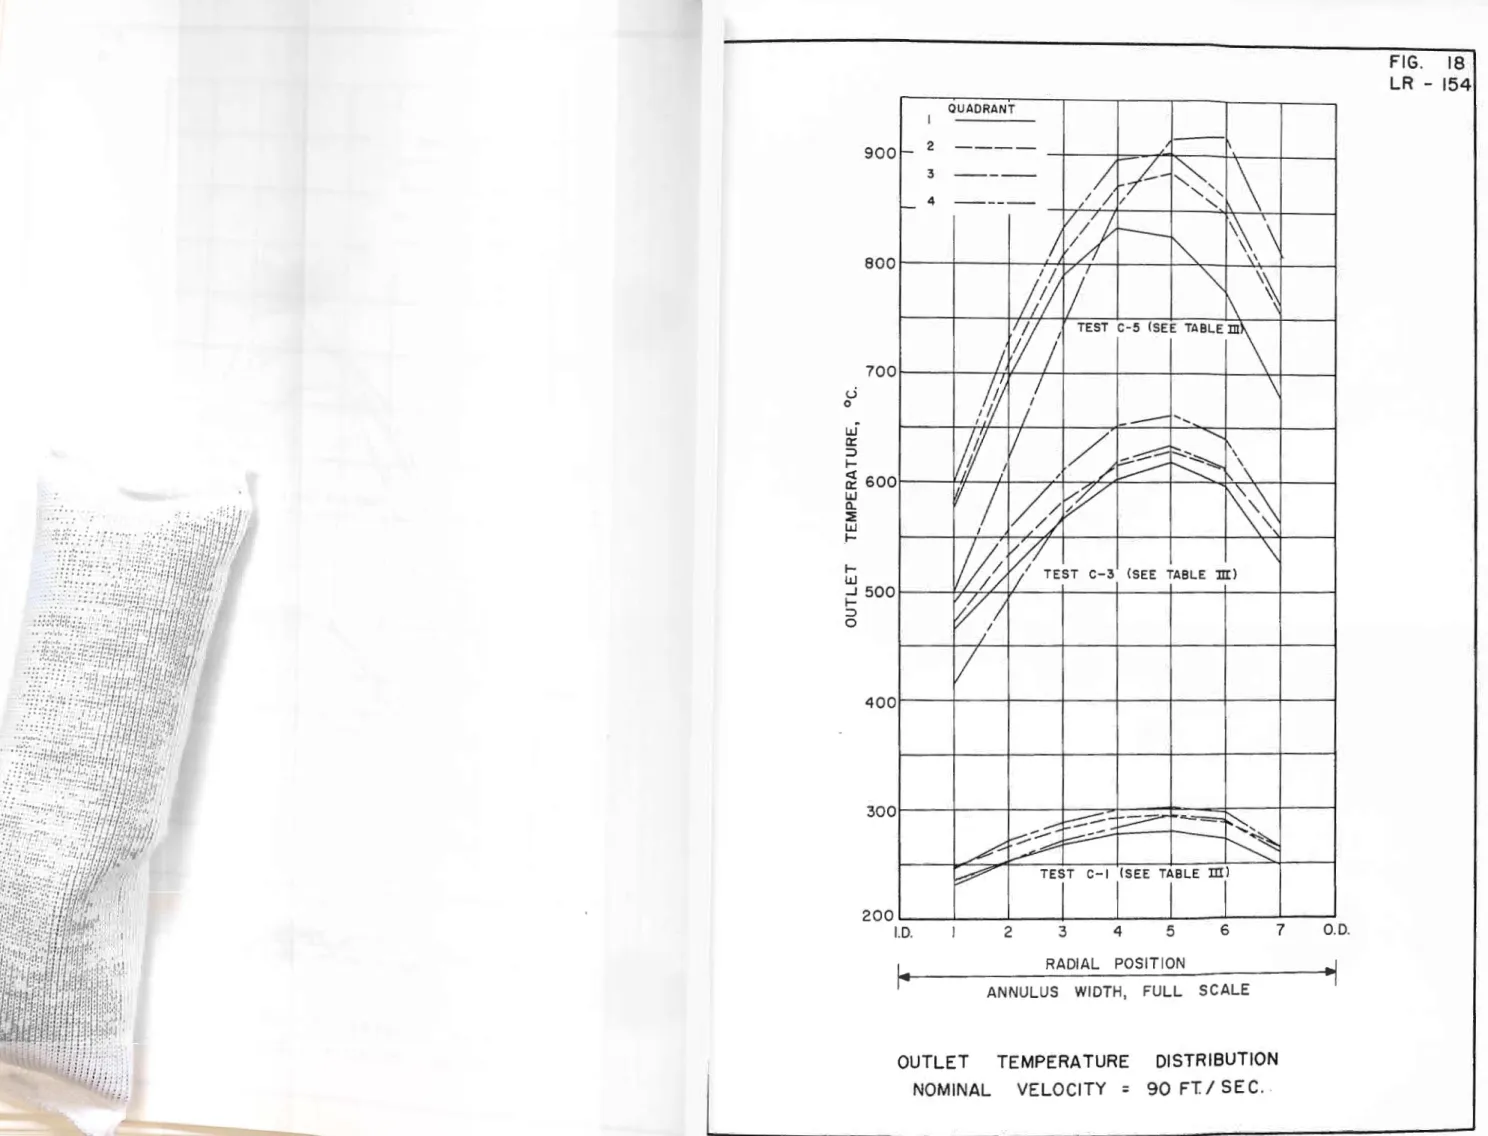
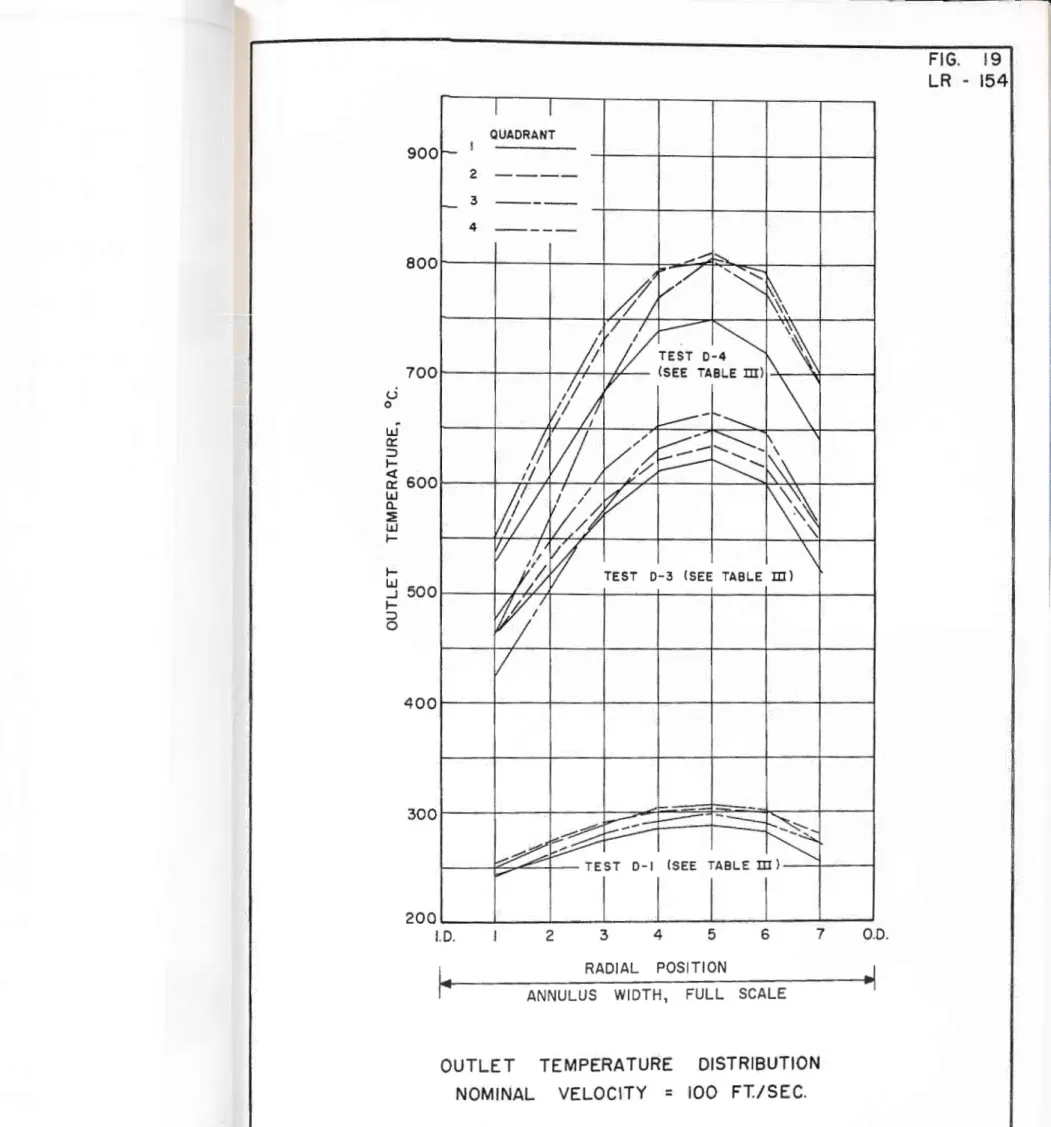
The outlet temperature distributions are plotted in Figures 16, 17, 18, 19 and 20.
The temperature spread index, I, defined as
T - T
I
=
max meanTmean
was calculated from values of temperature as plotted. It was
also calculated on the assumption of an inlet temperature of 300°C., the design value, rather than on the actual inlet
temperature. The results of these calculations are shown in
Table III.
A comparison of the outlet temperature profiles obtained with the ideal profile, which is shown in Figure 2 1 ,
indicates that some improvement is n e cessarye The tempera
-t u re spread index of -the ideal profile is low in rela-tion -t o
those obtained and the peak is ·1 .3 in e out from the centre
line, whereas the peaks of the prof i les obtained are general l y 0.5 in. out.
The circumferential temperature distribution is rather poor when the fuel/air ratio is .012 or greater for
all velocities. In particular, the temperature nea: the
inner wall in quadrant No. 3 is generally low, and ln severa l cases this is coupled with a relatively high peak temperature
i n the same quadrant. The reason for ti;is poor 、ゥウエイゥセオエゥNセョ@
in quadrant No. 3 is n ot known; no perslstent abnormallty ln the flame pattern in this region was observed.
Page - 14 LR-154
4.5 Flame Pattern within the Combustor
The results of the observations of the flame patterns within the combustor are given in Table IV.
Little information on the axial length of the :flame could be obtained since the observations were made :from well
downstream of the outlet. In some cases however, the :flame
extended through the turbine annulus (plane 0) in the :form of
long thin tongues extending 10 to 15 in. downs·tream o:f the
annulus and lasting a :fraction of a second. These observations
are recorded in the table o
The combustor conditions of high :fuel/air ratio and low velocity which produce these long :flames may occur during acceleration of the engine :from low speed and indicate the desirability of measures to ensure more rapid mixing and burning of the fuel at these conditions.
, At fuel/air ratios of .012 or less and at all
velocities, one of the vaporizer tubes at about 8 o'clock, looking upstream, produced a bright yellow spot of flame
almost invariably. In the photographs of the combustor
interior, discussed later (Fig. 28 and 29), this tube can
be seen to have a heavier deposit of carbon than any of the adjacent tubes.
At one point during the testing, the fuel jet supply-ing this tube was interchanged with one from the opposite side
of the combustor. The spot of :flame, however, remained in
t he same place suggesting that it was caused by some abnormality
of the
カ。ーッイゥコセイ@
tube. When the」ッュ「セウエッイ@
was、ゥウュ。ョエャセ、@
。ヲエ・セ@
the testing was completed, this vaporlzer tube was examlned and
the only abnormality which could be seen was a slight dent in .
the wall at its entrance. The dent may possibly have deflected
some of the fuel from the jet to the outside of the wall o:f t he tube rather than allowing it to pass down the ins ide. Fuel burning on the outside of the tube would produce the effects observed.
As mentioned in the ゥョエイッ、オ」エゥッセL@ the mechanical
performance of the base plate was o:f interest, and it . was expected that the most serious condition . would exist when the comb us tor was burning weak with the :flame close to the
base plate. Although the axial position o:f the flame could
not be determined, it will be noted from Table IV that at 90 ft.jsec. and .004 fuel/air ratio the base plate at the
Page - 15 LR-1 54 bottom of the combustor could be seen to be glowing red,
indicating that the flame was very close to it. No damage to the base plate resulted from this condition.
4.6 Analysis of Combustion Roughness
A
fairly high pitched hum became audible at anycombustor velocity when the fuel/air ratio was about .012 and
a rumble became audible at a slightly richer condition. 1rhe
rumble increased somewhat in volume as the f uel/air ratio was
increased up to a value of .020, the maximum used. At this
point the rumble did not appear serious and did not cause any visible movement of the flame tube or rig.
These noises were attributed to combustion roughness
or instability. The results of their analysis are descr i bed
be low ..
Photographs of the screen of the panoramic analyser
are shown in Figures 22, 23 and 24.
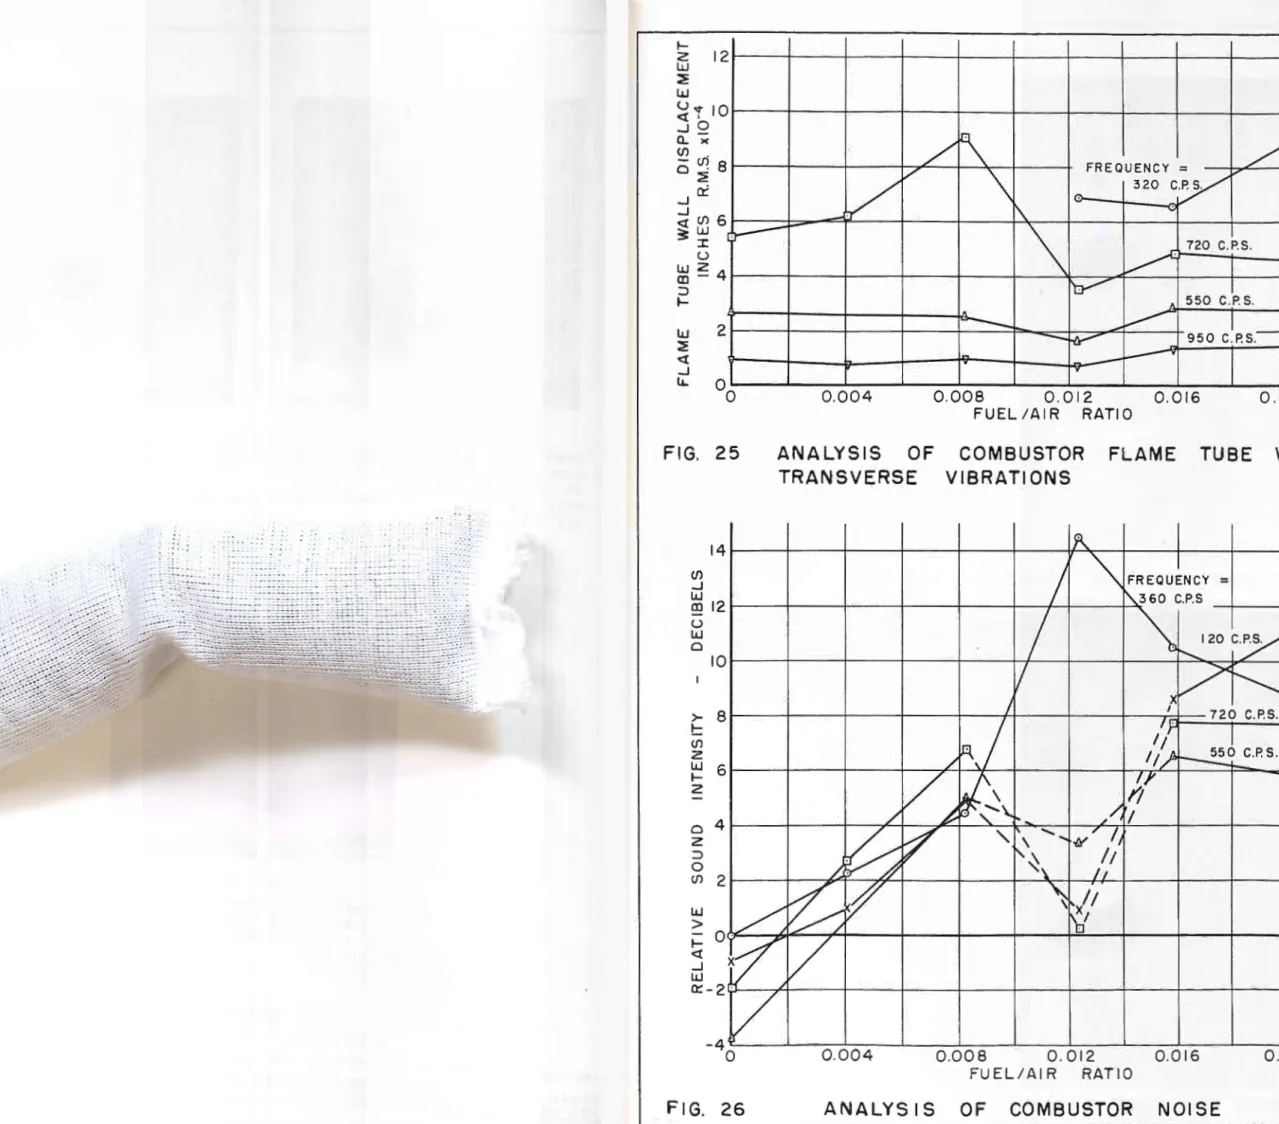
The traces obtained from the accelerometer attached to the flame tube were analysed by determining the :frequencies of the most prominent peaks appearing (utilizing the calibra-tion traces), and by measuring the height of these peaks by
means of the background grid. The heights were then converted
to values o f' root-mean-square displacement of the :flame tube wall by means o:f the expression:
whe re D
D
=
4.08 h x 10af20f2 displacement, in. r.m.s.
h height o f peak, grid divisions
a attenuator se"Gting, decibels
f frequency, cyclesjsec.
·rhe results are shown in Figure 25.
The traces ob tained f rom the microphone were analyse d by de termining the frequency and he ight o:f the most prominent
Page - 16 LR - 154
peaks again and converting the heights t o values of relative sound intensity with respect to the intensity of the 36 0- cyc l ej sec. component at a fuelja i r ratio o f zero by means of the
expression:
h
R : 20 log1 0 セ@ + a - a0
0
where R
=
relative sound intensity, decibels h height of peak, grid divisionsh0
=
height of 360 」ケ」ャ・ェウ・」セ@ peak at F/A=
0 a=
attenuator setting, decibelsa
0 = attenuator setting at F/A = 0
The results are shown in Figure 26o
The audible hum which starts at a fuel/air イ。セゥッ@ of . 012 at any velocity is presumably t he 360-cyclejsec. component of the noise shown in Figure 26. This component i s present in the no i se at all i'ueljair ratios down to zero, and just why it becomes so prominent at a certain critical value i s not known. At the same fueljair ratio a flame tube vibration c omponent of virtually the same frequency makes a sudden appearan c e as seen i n Figure 25. This flame tube vibration component may be
either the caus e or an effect of the hum.
It was thought that this vibrati on frequency might be correlated with a fuel pressure pulsa tio n frequency reach -ing the combustor, and it was for t his reason that t he analysis of t he fuel pressure pulsa ti ons was made.
The traces obta i ned from the each case, only one s ignifican t peak. peaks were not required but only their frequencies areg
t ransducer had, i n The he i ghts of these frequencies. ·rhe Test No. 1 - 272 cyclesjsec.
Test No. 2 - 285 cyclesjsec. Test No. 3 - 433 cyclesjsec.
Page - 1 ? LR -154 These results i ndicate that pressure pulsations produced by the supplying pump carry through the fuel line to the combustor, but the two frequencies ar i sing from the two pumps differ too greatly from 360 cyclesjsec. to indicate any correlation.
The remaining components of the noise and flame tube vibrations, since they are present at all fueljair ratios
including zero, are probably produced by the noise emitted by t h e injector. In particular, the 720-cyclejsec. component which is strong throughout probably corresponds to the high pitched screech of the injector.
It will be noted that the rumble, which appears at the higher fueljair ratios, does not appear to result in any prominent low frequency components in the analysis. This is probably because the rumble is aperiodic and not amenable to this type of analysis.
It i s believed that the onset of combustion rough-ness was shifted into a lower fuel/air ratio region by the low inlet temperature than would be t he case i f the inlet temperature were at the design value of 300°0. Also, at ·che design inlet temperature any combustion roughness could be expected to be milder.
4.7 Mechanical Failures
Three types of minor mechanical failure were
encountered during the testing. These are described below. The flanges joining the various parts of the outer casing and ducting of エィセ@ rig were held エッァ・セィ・イ@ by " Marmon ''1
couplings. After the ュセjッイ@ part of the セセウエQョァ@ had been
completed a growing fat1gue crack was ョッセャ」・、 N ゥョ@ one of these couplings. The coupling was replaced before 1t caused any t rouble.
The primary fuel jets were screwed into the primary fuel manifold and held by a piece of locking wire. One of
these jets became unscrewed after a セイ。」セオイ・@ of the . wi:e, and the resulting leak necessitated term1nat1on of the 1gn1tion limit tests. The cause of the leak could not be determined until the rig was dismantled at the end of the エ・セエゥョァ@
program, at which time it was found that 。ョッエセ・Z@ Jet. was. loose although the wire was intact. The rema1n1ng f1ve Jets were unaffected.
Pa g e - 18 LR-15 4
When the rig wa s d i smantled a ft er t h e tes t i ng was c ompleted, several cracks were f ound at t h e entry o f the flame
t ube snout. These crac k s were all in the regions o f t h e welds
where the sections of the straightening vanes (A, f ゥ ァセ@ 1) were
welded into the snout. Photographs of s ome of t hese cracks
are shown in Figure 27. The cracks did not i nterfere wi th t he
functioning of the flame tube during the testing.
The mechanical failures were probably due to vibra-tions caused by the injector noise rather than vibravibra-tions
result i ng from combustion roughness. The total leng t h o.f
time for which the combustor was operated at conditions of
rough combustion was about 13 hours, wh ereas t he total time
t h at air was blown through the comb ustor by t he i njector was
abou t 100 hours. During all this t i me the flame tube and
pre sumably all parts of the rig we r e sub j ec t ed to very intense v i brations at 720 cyclesjsec.
4o 8 Carbon Deposition
Operation of the combustor a t high f uelja i r ra t i o p roduced very light carbon deposit i on on t h e base pla t e, pr i mary air mixing slots, vapor i zer tubes, and parts of the
flame tube walls adjacent to the base pla t e. Thi s deposi t:. ion
c an b e s een in Figure 28. 'I'h e pictu r es were tak en at the
c onclusion of a tes t period involving 22 to 23 h ours 1 actual
b urning time over a range of fuel/air ratios from . 0 04 to oU22
and chamber v e locities from 4 0 to ·J·lO ft:..jsec. About 5 ho u rs
of t his time were spent at the high temperatur e condit i ona No ser i ous carbon bu i ld-up in any part of the combustor was observ ed a t any time during t h e tes t i n g .
Operation o f the combus t or a t l ow f 'uelja i r ra t io r e moved muc h of any c a rb on depo s i t ion whic h had re s ulte d fr om
pre vious r i ch oper a ti on. For instance, ·che pho t ographs in
F i gure 29 were taken after a few mi nu t e s of low P ue l ja i r ra t:i. o
ope rat i on f ollow i ng t h e p h o t ographs i n F i gure 28a I t c an b e
seen tha t much o f t h e car bon h as b een remo v ed.
4 a9 Di s t or ti on
No d i s t ort i on o f any part of t he base plat e, f lame t ube walls, or conical sections of the flame t ube at the out-let was observe d at the compout-let i on of the tes t ing.
However, some sli ght effec t s o f local overhea t ing
c a n be se e n i n Figure 2o The dar k pa t c h es o n the f i rst
Page セ@ '19
LR セQ UT@
s e ction of the flame tube wall downstream f rom the snout are re gions which have turned blue as a result of having been raised to a high temperature.
It is to be expected that some distortion of the f lame tube, particularly the conical sections at the outlet,
mi g ht occur at the design temperature r i se i f the inle t エ・ュー・イ。 セ@
ture were t h e des i gn value since t he tempera t u r•e level thr ough
-out the combustor would be raised. However, the tempera t ure
of the base plate would not be unduly high except under t he fairly unusual conditions of very weak burning, and in view of its performance in these tests it would not be expected to g ive trouble.
4.10 Summary
A semi-quantitative summary of the results of the
tests on stability limit s, ignition limi ts, flame pat t erns, outlet temperature distribution, and combustion roughness is
shown in Figure 30. The stability and i gnition limit results
h ave been plotted in terms of velocity vs. fuel/air ratio and are averages of the results with and without the screen.
The total operating time of the combus tor can be summarized as follows:
Total operating time, hot and 」ッャ、セ@ 100 hr.
Total combustion time セ@ 25 hr.
Total t ime at rich (rough) combustion 」ッョ、ゥ エゥ ッョウセ@ 1 3 h r o
5 . 0 CONCLUSIONS
The cold pressure loss appears to be h igh. The resu lt .s
indic a t e a pressure loss on the engine at maximum rating of abo ut 1 1 p ercent o f c ombustor entry to t al pressure.
The weak stability limit near atmospheric pressure app ears to be satisfactory.
The outlet temperature distribution requires improve -me nt to bring the radial distribution mo r e in l i ne wi th the
Page - 20 LR-154
Measures to ensure more rapid mixing within t he ch amber at rich low velocity conditions are indicated to prevent long
flames セィゥ」ィ@ extend through the turbine annulus.
The performance of the light sheet metal base plate was satisfactory.
Operation of the combustor at the design inlet tempera-ture of 300°C. ought to ameliorate the combustion roughness
encountered at lower inlet temperatures but may lead to some distortion of the flame tube at the design temperature rise.,
6. 0 ACKNOWLEDGEMENTS
The authors wish to acknowledge the assistance given by the following members and former members of the staff of the
N.A.E.: Mr. J.P. Beauregard who assisted in much of the work
in the early stages, Mr. F. Cheers who carried out the
develop-ment of the injector, and Messrs.
E.
Bowler andG.
Wright ofthe Aircraft and Allied Instrument Laboratory who supplied and operated the electronic analysing equipment$
7 .. 0 REFERENCE
1 •
/LES
Pouchot,
W.D.
Hamm, J.R.
Characteristics of a Vaporizing Combustor for Aviation Gas Turbines.
A.S.M.E. 53-A-182, Nov.-Dec. 1953.,
Quad Ref. 1 1 2 3 4 Ref. 2 1 2 3 4 Ref. 3 1 2 3 4 Ref., 4 1 2 3 4 Ref. 5 1 2 3 4 Ref. 6 'i I 2 3 4 · TABLE Ia
READINGS FROM TOTAL HEAD PRESSURE RAKES IN PLANE D, SCREEN IN PLACE
Hole Position on Rake Inner Hole 1 2 3 4 5 30.15 31.60 31.75 31.70 31 .25 30.00 31.75 31.75 31.60 31.35 30.00 31.60 31 .. 75 31o65 31.,25 30.05 31 0 70 31.75 31.60 31.20 30.15 32.00 32o30 32.25 31.60 30.00 32.25 32.25 31.95 31.75 30.40 32.05 32.20 32 015 3"1 .65 30.,05 32.25 32.25 32.05 31.55 30.10 32.85 33.,25 33.20 32.30 29.95 33.20 33 .. 25 32.80 32.50 30.45 32.95 33.15 33.00 32.40 30.05 33.15 33.20 32.95 32 o30 30.10 33.,80 34.40 34.,40 33.,15 29.85 34 .. 35 34.40 33.70 33.45 30.,40 34.,00 34.,30 34.15 33.,30 29.95 34 .. 30 34 .. 35 33 .,90 33. 15 29.90 34.,80 35 .. 85 35.85 34 .. 25 29.,55 35.70 35.25 34.80 34.45 30.25 35.15 35.70 35.40 34.25 29,.65 35.65 35.75 35.,15 34.20 29.85 35.25 36.60 36.,60 34.85 29.45 36.,50 36.05 35.90 34.55 30.10 35.,75 36.45 36.10 34.80
-29.60 36.35 36.,50 35.80 34.,75 Page - 21 LR-154 Outer Hole 6 31 .. 85 31.75 31 .85 31.65 32.35 32o25 32.40 32.15 33.30 33.25 33.,40 33.,10 34 .,40 1 34.,40 34.,55 34.20 35,.35 35.75 35.70 35.55 35.,60 -36 .. 00 36.30Ref. No. 1 2 3 4 5 6 1 2 3 4 5 6 7 8 9 10 11 Total Press TAB LE Ib
READINGS FRO!:! TOTAL HEAD PRESSURE RAKES IN PLANE D. SCREEN RE MOVED
-Hole Position on Rake
Hole Position on Rake
Inner Outer Inner Hole Hole Hole Quad 1 2 3 4 5 6 Quad 1 2 3 4 5 Re:f'. 1 Rc:f. 7 1 30.05 32.15 .32. 50 .32 • .30 31.65 .32.40 1 29.55 35.60 37.90 37.65 35.55 2 29.80 32.40 32.45 32.05 31.85 32.35 2 28.90 37.25 37.75 36.30 35.65 3 29.70 32.65 32.65 32.25 31.80 .32.45 3 29.00 37.85 38.15 36.90 35.70 4 30.05 32.45 32.70 32.35 31. 80 32.50 4 29.55 36.55 38.00 37.20 35.55 Ref. 2 Ref. 8 1 30.45 32.95 33.45 33.25 32.45 33.30 1 29.85 36.05 38.35 38.00 35.95 2 30.20 32.40 33.45 32.85 32.65 33.30 2 29.65 37.55 38.15 37.65 36.10 .3 30.10 33.55 33.60 33.05 32.50 33.15 3 29.40 38.25 38.55 37.15 36.oo 4 30.30 33.25 33.6o 33.15 32.50 33.40 4 29.85 36.95 38.45 37.60 35.90 Re:f', 3 Ref. 9 1 29.95 33.30 34.15 33.90 32.80 33.95 1 29.50 37.15 39.90 39.50 37.20 2 29.65 34.05 34.20 33.45 33.00 33.85 2 28.80 39.30 39.60 37.70 36.65 3 29.50 34.05 34.20 33.65 32.85 33.90 3 29.10 39.85 39.95 38.30 36.75 4 30.05 33.75 34.20 33.75 32.85 33.90 4 29.65 38.30 39.85 38.95 37.05 Re:f'. 4 Re:f'. 1D 1 30.40 33.75 .34.50 .34.25 3.3. 15 34.85 1 29.55 .37. 15 SYセXP@ 39.40 37.10 2 30.05 34.50 34.60 36.75 .33.50 34.40 2 28.80 .39.30 39.65 .37.75 .36. 65 3 29.90 34.70 .34.80 34.05 .33.35 34.15 3 29.05 40.00 40.00 38.40 36.70 4 30 • .30 .34.20 34.70 34.10 .33 • .30 34.45 4 29.65 38.50 40.05 39.10 37.15 Re:f'. 5 Ref. 11 1 30.30 34. 75 .35.85 35.60 34.15 .35.45 1 29.65 37.75 40.50 39.95 37.60 2 29.85 .35.70 35.45 34.90 34.55 35.60 2 29.00 40.15 40.30 38.05 37.05 3 29.70 36.10 36 • .30 .35.30 34.40 35.25 3 29.39 40.75 40.65 38.85 37.25 4 30.15 35.25 36.15 35.40 34.30 35.65 4 29.70 39.35 40.70 39.50 37.45 :{e:f. 6 1 30.15 34.80 36.25 35.90 34.30 35.60 2 29.60 .35.85 36.15 35.00 .34. 6o .35.70 .3 29.55 36.20 .36.45 35.45 .34.55 .35.90 4 .30.00 .35 • .35 36.25 35.65 34.40 35.70
SUMMARY OF RESULTS OF COLD PRl!:SSUllli LOSS t.iEASUllliM.b:NTS
Plane B Plane D Plane 0
Static Press
Static Total in. Hg Abs. Total Static Mass
Press Temp. Press (Outer Press Press Flow
Outer Hole 6 36.15 36.95 37.15 36.40 36.55 37.40 36.55 36.90 36.20 36.70 37.50 36.oo 36.20 36.70 37.40 35.90 36.50 36.90 37.30 36.00 Velocity
in. Hg Abs, in. Hg Abs. oK. in. Hg Abs. Wall) in. Hg Abs. in. Hg Abs. lb./sec. ft./sec.
SCREEN IN PLACE 31.85 31.15 349 31.63 30.12 30.07 29.63 34.72 67.8 32.39 31.51 354 32.09 30.17 30.11 29.53 39.17 76.45 33.40 32.20 361 32.98 30.22 30.15 29.35 45.4 87.9 34.63 33.10 369 34.04 30.35 30.22 29.13 51.45 98.7 36.14 34.23 372 35.24 30.45 30.28 28.86 58.25 108.8 36.94 34.83 375 35.84 30.56 30.30 28.79 61.6 114.0 SCREEN REMOVED 32.52 31.54 320 32.46 30.06 30.02 29.34 43.2 75.4 33.55 32.33 331 33.16 30.43 30.36 29.56 47.9 84.6 34.16 ' 32.69 328 33.86 30.16 30.05 29.05 53.3 91.3 34.71 33.13 336 34.17 30.54 30.38 29.36 54.7 95.2 36.13 34.18 342 35.33 30.70 30.47 29.10 61.3 104.9 36.32 34.30 343 35.50 30.52 30.30 28.89 62.6 107.0 38.05 35.68 347 36.88 30.52 30.19 28.48 68.7 114.4 38.51 36.06 349 37.23 30.90 30.56 28.76 70.0 116.0 40.06 37.38 355 38.14 30.95 30.48 28.38 73.8 121.5 40.16 37.41 350 38.13 30.90 30.43 28.35 75.4 122.5 40.82 38.02 352 38.63 31.17 30.68 28.50 76.6 123.5 - -'dl ::U.a _:_Cl> U1 • .l:>N N q in. Hg 0.0674 0.0857 0.1142 0.1454
o.
1814 0.2010 0.0933o.
1160 0.1392 0.1491 0.1840 0.1917o.
2250 0.2322 0. 2567o.
2645 0.2713 イセ@ :::O.o セHAI@ ()1' .P,N (.)J• セ@ セ@ w セ@ TllJ3LE III
SUMMARY OF RESULTS OF lOT PRESSURE LOSS CALCULATIONS AND OUTLET TEMPERATUIE DISTRIBUTION MEASUREMENTS
rdl
::0<0 1(1) ()1• 4:>1\.) 4:> Total Pressures AirMass in. Hg Abs.
Flow Plane Plane Plane Plane
Test lb. / sec. B D 0
z
A-5 33.66 32.43 32.23 30.11 30.08 B-3 38.78 32.96 32.68 30.12 30.09 B-5 40.47 33.55 33.24 30.23 30.18 C-1 45.44 33.51 33.09 30.08 30.05 C-3 46.24 34.33 33.89 30.25 30.20 C-5 48.16 35.14 34 .• 67 30.43 30.37 D-1 52.32 34.88 34.27 30.17 30.13 D-3 52.74 35.84 35.21 30.40 30.34 D-4 54.29 36.32 35.64 30.54 30.47 E-2 59.18 37.04 36.10 30.45 30.39 E-3 58.54 37.29 36.42 30.57 30.50 j _t .004 .00870
I
All blue exceptI
All yellow. for a few yellow80
flashes in bottom half of chamber.
All blue except for a few yellow fl ashes in bottom half of chamber.
Yellow with very little blue inter-mixed all around.
Temperature Spread Index, Percent
Based Based
on on
Inlet :; ombustor Combustor Fuel Outlet Actual Inlet
Temp. lfeloci ty q Air Temp. Inlet Temp.
=
oK. f t./sec. in. Hg Ratio oK.
K Temp. 300°C. 354 65.4 0.063 359 75.3 0.084 3 63 78.1 0.090 362 ts8.o 0.114 369 68.6 0.117 370 90.9 0.125 368 99.4 0.149 374 99.0 0.149 376 101.3 0.158 379 109.8 0.186 379 107.7 0.180 .J l FLAME PATTERNS Fuel/Air Ratio .012
Yellow with narrow blue inner and outer fringes all around.
Yellow and blue intermixed with a blue inner fringe
all around . 02 27 1130 4. 83 18.8 15.0 .0129 856 4.92 14. 1 10.3 .0209 1075 4. 74 17.3 13.7 • 0041 546 2.95 11.0 6.2 .0124 842 4.99 16.2 11.9 .0201 1049 4.80 19.2 15.2 .0041 552 3.40 10.0 5.8 .0123 846 5.07 16.2 12.0 .0160 967 3.94 16.7 13.0 .0082 714 3.85 12.7 8.8 .0122 857 4.44 14.9 11 . 2 I l 1 .016
Bright yellow with very narrow blue inner and outer fringes all around. Small amount of fl arae through turbine annulus. Yellow and blue
intermixed with blue inner and outer fringes all around. No flame through turbine annulus.
\
\ .020Bright yellow with very narrow blue inner and outer fringes all around. Considerable amount of flrune through turbine annulus. Bright yellow with
very narrow blue inner and outer fringes all around. Some flame through turbine annulus.
)
ᄋセMMMMセセMMMMMMMMMMMMMMMMMMMMMMMMMイMMMMMMMMMMMMMMMMMMMMMMMMMMMMTMMMMMMMMMMMMMMMMMMMMMMMMMMMセセMMMMMMMMMMMMMMMMMMMMMMMMMMMMKMMMMMMMMMMMMMMMMMMMMMMMMMMMMMセ@セi@
9o l :>.Yellow and blue intermixed with blue inner and
セャ⦅@
____
ェ⦅セセセZZZZセセ]MMMMMセセセセセセセセセセセMMMエMケセセセセセセセセZMMMMエセセセセセセセセセZMMMMMャャセセセ[[セセセセセセZZ]M
All blue with very o.ccasional yellow flashes. Base plate red
at bottom.
Mostly blue with a yellow spot at outlet of each vaporizer tube.
100 I All blue with very occasional yellow flashes.
Mostly blue with a yellow spot at outlet of each vaporizer tube.
Yellow and blue intermixed with blue inner and outer fringes all around.
Yellow and blue intermixed with blue inner and outer fringes all around.
Yellow and blue intermixed with blue inner and outer fringes all around.
Yellow and blue intermixed with blue inner and outer fringes all around.
outer fringes all
around. Very little
flame through turbine ammlus. Yellow and blue
intermixed with blue inner and outer fringes all around. No flame through turbine annulus.
110 Mostly blue with
a yellow spot at outlet of each vaporizer tube.
Yellow and blue intermixed with blue inner and outer fringes all around.
Yellow and blue intermixed all around. r;:F ::O.a I Ill ( ] I I セn@ (JI
Zセᄋ@ セ@
..
jセセ[[LQNセINセ@
:. '
ZᄋᄋNZセZ セセZセZセセ
セZZZ\ZM[ [セ@
. ,;·.
Mセ@
. . . .·
. '
GGスL セセ[ZセセセGZセ
Hサ[[[[セ G@
.?/.
> •
AIR FLOW --. --.N[ セセZセセM
セZ_[@
...LLN Zᄋ NM セN\@
• .• ·' •", ·'-·:· • .-. . . · ..'
GGGゥセj セセサセセエセセセZZ^\セᄋᄋ@
.ᄋM NM Zセ Nセ MMZォセセセ|ZN
セGM ᄋGᄋᄋᄋᄋN@
·. ·'< .• ' .-.· , .• , .•.: ···
·.·. .·ᄋᄋᄋᄋᄋセ ZZ セ ᄋ@
ᄋNGᄋZセセ ᄋMNセセセセセM[NAᄋNMセᄋM
...
セGDZ セ ᄋセZZMZ\ Z セZ@
... ·.,:. __ ..
ZᄋNᄋL セM
ᄋᄋLセ NセMᄋN@
. .
ᄋ NセZ ⦅Z⦅@
:
. ,-·. :,:• •' '.-.·. ·.· . . ·-::.-/( . NG MZ[NセQM^⦅LZLN@·.
G GBセᄋMBᄋ
LGᄋセ[ZセMZML@ᄋᄋL N[L セ [ᄋ@
:-··· •• , .. ·','•' •• ,. ,,_ ••• ,... ·-:. ·,;,•.·,,. ,;,.•..
·' ·' • • • •. ·.- . ·.·..
· . . GG | セセ@.
•,-,.•,..
'. . •".
' •'' '.
'.
•.· ' . . . .ᄋZセ| ᄋセMN[NZPZセセZNNMN@
ᄋ セセ セ[ᄋセセ ᄋ ᄋセ ᄋセGセJセᄋ@ ᄋᄋュ ᄋセ@
'•;-.[セ@
...ᄋセMMセZ MᄋセM
..MMMセ@ MセᄋNM
.•セ@ セ@
.. ...ᄋセZMセ|@
..ᄋセ@
... ,-;..· ...セ@
·. Zセ セ@... ,:-,;... .
..:.
.
,.,_. '•'·· ... ,... . . ,. &',. '"\:. ,..:.,, .. .. , •. ' - ... ᄋセ|| セ セセ Z セセスG@ ᄋセZセセᄋ@ ,._' ·'sK• SCREEN DIAGRAMMATIC LONGITUDINAL PLANE DMAIN FUEL MANIFOLD
I
SUPPORTING PIN10TH STAGE STATOR ROW \
'T' \
セセセ@
•c• 5 ; _ - . · ---セ@
i
SECTION THROUGH
SECONDARY AIR PIPE PRIMARY FUEL MANIFOLD
---'-ACCELEROMETER ATTACHMENT
PS. 13 ANNULAR VAPORIZING COMBUSTOR
PLANE Z
r"TT
:::o-.0
( ] l _ セ@ ...FLAME TUBE OF PS. 13 ANNULAR VAPORIZING
FIG. 2 LR-154
ATMOSPHER IC P.S. 13 ANNULAR PRESSURE TEST
(b)
VAPORIZING RIG WITH COMBUSTOR INSTRUMENTATION FIG. 3 L R- 15 4 INSTALLEDl
-:::
ヲ セセセセ MZ セセセセwZ@ Zセセセセ Lゥ セ セ@ セセM セZャイセセ|ャ セセセセ セ[[ ゥᄋ@
CATHODE
accelerometerセ@ FOLLOWER 30-FT. SHIELDED CABLE
MUFFLED MICROPHONE PRES SURE TRANSDUCER PRE-AMPLI Fl ER 20-FT. SHIELDED CABLE
セ@
"-o-セ@ PANORAMIC WAVE ANALYSER AUDI 0 OSCILLATOR CAMERAI
BLOCK DIAGRAM OF COMBUSTION ROUGHNESS ANALYSING EQUIPMENT
r"TJ
::u-,0
uャセ@